
Spatio-temporal Heterogeneity Characteristics and Spillover Effects of Total Factor Productivity of Urban Digital Economy in China
Received date: 2024-07-11
Revised date: 2025-02-21
Online published: 2025-05-13
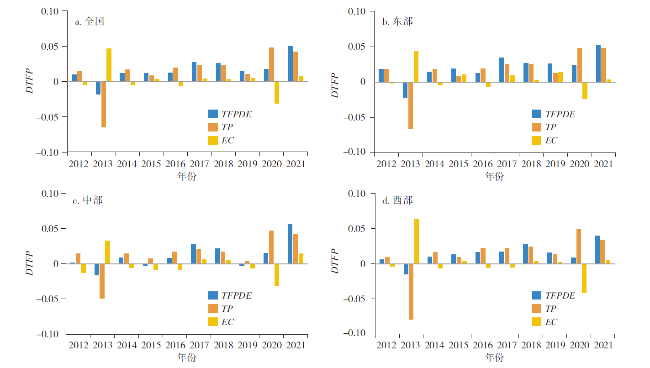
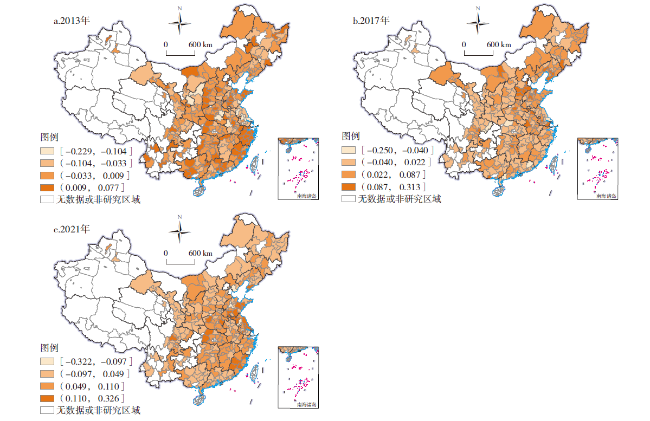
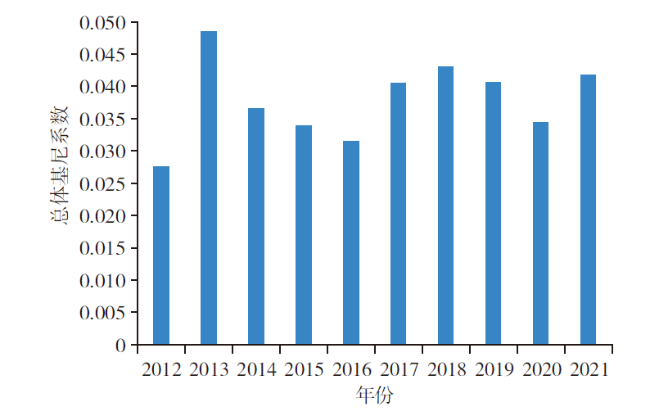
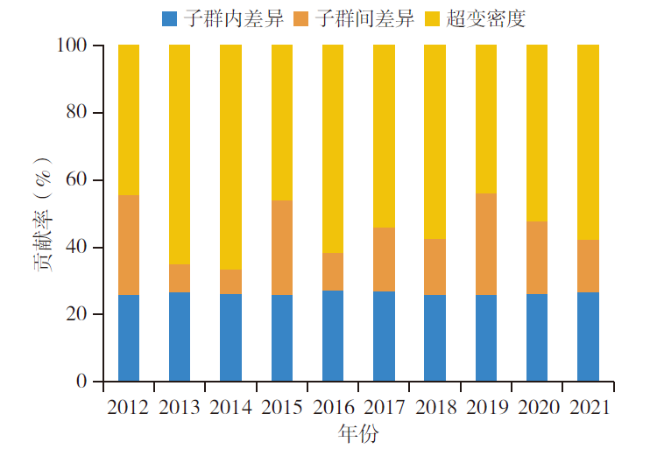
In the context of the deep integration between the digital and real economies, enhancing the total factor productivity of digital economy (TFPDE) is crucial for cultivating new quality productive forces and achieving high-quality economic development. This paper uses the two-stage modified Epsilon-based measure and Luenberger productivity index to measure the TFPDE of 275 Chinese cities from 2012 to 2021, and investigates its spatiotemporal evolution and influencing factors. The findings are as follows: 1) China's TFPDE shows an overall upward trend, driven primarily by technological progress as a single driving force. 2) The overall Gini coefficient of TFPDE exhibits a fluctuating downward trend, and the excess variation density is the main source of differences in TFPDE among the four major regions. 3) Factors such as economic development level, industrial specialization and agglomeration, and regional integration have significant positive effects on TFPDE, and these effects exhibit spatial spillover effects. 4) There is a significant β-convergence characteristic in China's TFPDE. The local TFPDE and its rate of change have a positive spatial spillover effect on the rate of change of TFPDE in neighboring cities.
CAO Xiguang , PAN Chenyu . Spatio-temporal Heterogeneity Characteristics and Spillover Effects of Total Factor Productivity of Urban Digital Economy in China[J]. Economic geography, 2025 , 45(3) : 109 -118 . DOI: 10.15957/j.cnki.jjdl.2025.03.011
表1 TFPDE测度指标体系及说明Tab.1 Indicator system of total factor productivity of digital economy and its explanation |
| 要素 | 指标 | 衡量变量及其单位 | 均值 | 标准差 |
|---|---|---|---|---|
| 资本投入 | 物质资本存量(K) | 以2010年为基期,通过永续盘存法,初始资本存量10%、折旧率9.6%计算资本存量(亿元) | 7927.084 | 7494.134 |
| 劳动投入 | 人力资本存量(L) | 年末从业人员数量(万人) | 50.953 | 52.969 |
| 资源投入 | 资源要素指标(E) | 通过熵权法构建资源要素投入综合指标·100 | 0.111 | 0.120 |
| 数字投入 | 数字要素指标(D) | 通过熵权法构建数字要素投入综合指标·100 | 0.207 | 0.131 |
| 期望产出 | 经济效应指标(G) | 以2010年为基期,对各城市的GDP进行平减处理(亿元) | 1941.706 | 2231.418 |
| 非期望产出 | 发展失衡指标(U) | 通过熵权法构建城市发展失衡综合指标·100 | 0.203 | 0.134 |
| 环境污染指标(P) | 通过熵权法构建城市环境污染综合指标·100 | 0.568 | 0.188 |
表2 中国四大区域城市TFPDE组内差异的区域内及区域间差异演化Tab.2 Intra- and inter-regional differences of TFPDE in four regions of China |
| 年份 | 区域内差异 | 区域间差异 | |||||||||
|---|---|---|---|---|---|---|---|---|---|---|---|
| 东部 | 中部 | 西部 | 东北 | 东部—中部 | 东部—西部 | 东部—东北 | 中部—西部 | 中部—东北 | 西部—东北 | ||
| 2012 | 0.0258 | 0.0244 | 0.0224 | 0.0313 | 0.0267 | 0.0270 | 0.0319 | 0.0239 | 0.0286 | 0.0270 | |
| 2013 | 0.0408 | 0.0338 | 0.0669 | 0.0452 | 0.0377 | 0.0556 | 0.0450 | 0.0528 | 0.0425 | 0.0603 | |
| 2014 | 0.0347 | 0.0428 | 0.0303 | 0.0386 | 0.0401 | 0.0330 | 0.0388 | 0.0381 | 0.0425 | 0.0354 | |
| 2015 | 0.0361 | 0.0326 | 0.0256 | 0.0386 | 0.0367 | 0.0337 | 0.0428 | 0.0293 | 0.0368 | 0.0334 | |
| 2016 | 0.0318 | 0.0276 | 0.0309 | 0.0326 | 0.0301 | 0.0317 | 0.0326 | 0.0300 | 0.0308 | 0.0320 | |
| 2017 | 0.0292 | 0.0528 | 0.0344 | 0.0346 | 0.0428 | 0.0339 | 0.0354 | 0.0448 | 0.0455 | 0.0349 | |
| 2018 | 0.0493 | 0.0320 | 0.0476 | 0.0427 | 0.0444 | 0.0531 | 0.0516 | 0.0402 | 0.0380 | 0.0454 | |
| 2019 | 0.0314 | 0.0399 | 0.0430 | 0.0336 | 0.0358 | 0.0389 | 0.0401 | 0.0430 | 0.0440 | 0.0409 | |
| 2020 | 0.0393 | 0.0379 | 0.0292 | 0.0314 | 0.0397 | 0.0362 | 0.0382 | 0.0339 | 0.0354 | 0.0308 | |
| 2021 | 0.0281 | 0.0685 | 0.0298 | 0.0258 | 0.0498 | 0.0305 | 0.0305 | 0.0519 | 0.0518 | 0.0286 | |
| 均值 | 0.0347 | 0.0392 | 0.0360 | 0.0354 | 0.0384 | 0.0374 | 0.0387 | 0.0388 | 0.0400 | 0.0369 | |
表3 基准回归结果Tab.3 Baseline regression results |
| 变量 | (1) TFPDE | (2) TFPDE |
|---|---|---|
| Eco | 0.0102***(0.0009) | 0.0064***(0.0010) |
| Pop | 0.0017***(0.0003) | 0.0013***(0.0004) |
| Innov | 0.0464***(0.0058) | 0.0165**(0.0064) |
| Fin | 0.0045***(0.0011) | 0.0133***(0.0025) |
| Gov | -0.0230***(0.0045) | -0.0289**(0.0142) |
| Ksl | 0.0047***(0.0005) | 0.0044***(0.0006) |
| Meg | 0.0006**(0.0003) | 0.0011**(0.0005) |
| R2 | 0.125 | 0.288 |
表4 空间杜宾模型回归结果Tab.4 Regression results of spatial Durbin model |
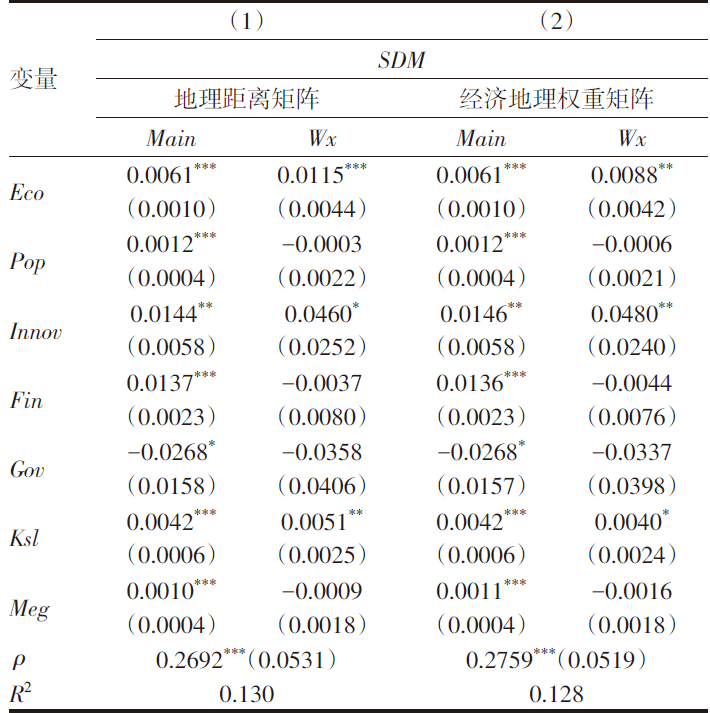 |
表5 空间溢出效应分解结果Tab.5 Decomposition results of spatial spillover effect |
| 变量 | 地理距离矩阵 | 经济地理权重矩阵 | |||||
|---|---|---|---|---|---|---|---|
| 直接效应 | 间接效应 | 总效应 | 直接效应 | 间接效应 | 总效应 | ||
| Eco | 0.0063***(0.0010) | 0.0170***(0.0053) | 0.0233***(0.0056) | 0.0063***(0.0010) | 0.0135***(0.0051) | 0.0198***(0.0054) | |
| Pop | 0.0012***(0.0004) | -0.0001(0.0029) | 0.0011(0.0030) | 0.0011***(0.0004) | -0.0006(0.0028) | 0.0006(0.0029) | |
| Innov | 0.0157**(0.0063) | 0.0684*(0.0372) | 0.0841**(0.0383) | 0.0158**(0.0063) | 0.0718**(0.0354) | 0.0876**(0.0366) | |
| Fin | 0.0139***(0.0025) | -0.0000(0.0115) | 0.0138(0.0117) | 0.0137***(0.0025) | -0.0007(0.0111) | 0.0130(0.0113) | |
| Gov | -0.0306*(0.0183) | -0.0532(0.0575) | -0.0838(0.0539) | -0.0306*(0.0182) | -0.0520(0.0570) | -0.0825(0.0536) | |
| Ksl | 0.0043***(0.0006) | 0.0083**(0.0033) | 0.0126***(0.0034) | 0.0043***(0.0006) | 0.0068**(0.0032) | 0.0111***(0.0033) | |
| Meg | 0.0011***(0.0004) | -0.0004(0.0023) | 0.0006(0.0024) | 0.0010***(0.0004) | -0.0014(0.0023) | -0.0004(0.0024) | |
| [1] |
习近平. 加快发展新质生产力扎实推进高质量发展[N]. 人民日报,2024 -02- 02(01).
|
| [2] |
黄群慧, 杨耀武, 杨虎涛, 等. 结构变迁、效率变革与发展新质生产力[J]. 经济研究, 2024, 59(4):4-23.
|
| [3] |
李芃达. 数实融合推进新型工业化[N]. 经济日报,2024 -01- 03(01).
|
| [4] |
|
| [5] |
周小亮, 吴武林. 中国包容性绿色增长的测度及分析[J]. 数量经济技术经济研究, 2018(8):3-20.
|
| [6] |
李华, 董艳玲. 中国经济高质量发展水平及差异探源——基于包容性绿色全要素生产率视角的考察[J]. 财经研究, 2021, 47(8):4-18.
|
| [7] |
杨耀武, 张平. 中国经济高质量发展的逻辑、测度与治理[J]. 经济研究, 2021, 56(1):26-42.
|
| [8] |
李冬, 杨万平. 面向经济高质量发展的中国全要素生产率演变:要素投入集约还是产出结构优化[J]. 数量经济技术经济研究, 2023, 40(8):46-68.
|
| [9] |
李兰冰, 刘秉镰. 中国区域经济增长绩效、源泉与演化:基于要素分解视角[J]. 经济研究, 2015, 50(8):58-72.
|
| [10] |
|
| [11] |
杨万平, 李冬. 中国生态全要素生产率的区域差异与空间收敛[J]. 数量经济技术经济研究, 2020, 37(9):80-99.
|
| [12] |
张永姣, 丁少斌, 方创琳. 中国数字经济产业发展的时空分异及空间收敛性分析——基于企业大数据的考察[J]. 经济地理, 2023, 43(3):120-130.
|
| [13] |
|
| [14] |
刘岩, 程钰, 王亚平. 黄河流域生产性服务业集聚对城市绿色全要素生产率的影响效应与空间溢出[J]. 地理研究, 2023, 42(4):917-935.
|
| [15] |
|
| [16] |
宋清华, 周学琴. 金融科技能提升城市包容性绿色全要素生产率吗?[J]. 中南财经政法大学学报, 2024(2):67-80.
|
| [17] |
周忠民, 李佳威, 秦艺芳, 等. 财政科技支出对全要素生产率的影响及其机理分析[J]. 经济地理, 2022, 42(1):108-116.
|
| [18] |
刘珊, 马莉莉, 郭家琛. 制度型开放与企业全要素生产率——来自准自然实验的证据[J]. 国际贸易问题, 2024(5):159-174.
|
| [19] |
王军, 朱杰, 罗茜. 中国数字经济发展水平及演变测度[J]. 数量经济技术经济研究, 2021, 38(7):26-42.
|
| [20] |
黄建欢, 方霞, 黄必红. 中国城市生态效率空间溢出的驱动机制:见贤思齐VS见劣自缓[J]. 中国软科学, 2018(3):97-109.
|
| [21] |
|
| [22] |
|
| [23] |
陈景华, 陈姚, 陈敏敏. 中国经济高质量发展水平、区域差异及分布动态演进[J]. 数量经济技术经济研究, 2020, 37(12):108-126.
|
| [24] |
曹希广, 邓敏. 电子商务政策与企业家创业精神[J]. 世界经济, 2024, 47(4):31-64.
|
| [25] |
戴若尘, 祝仲坤, 张晓波. 中国区域创新创业指数构建与空间格局(1990—2020)[J]. 经济科学, 2024(1):5-34.
|
| [26] |
刘亮, 潘晨昱, 刘宗沅. 税负加重是否会影响企业金融资产配置?[J]. 财经理论与实践, 2024, 45(4):17-24.
|
| [27] |
陈黎明, 戴涛, 谭朵朵, 等. 财政分权、地方政府行为与经济绿色转型[J]. 财经理论与实践, 2024, 45(2):68-75.
|
| [28] |
张雯熹, 吴群, 王博, 等. 产业专业化、多样化集聚对城市土地利用效率影响的多维研究[J]. 中国人口·资源与环境, 2019, 29(11):100-110.
|
| [29] |
吕冰洋, 贺颖. 迈向统一市场:基于城市数据对中国商品市场分割的测算与分析[J]. 经济理论与经济管理, 2020(4):13-25.
|
| [30] |
丁华. 知识产权金融赋能科技型中小企业创新发展:作用机理、现实困境与政策建议[J]. 管理学刊, 2024, 37(5):81-94.
|
| [31] |
汪锋, 何京泽, 史东杰, 等. 城市集群发展的创新效应——基于人口集聚与要素流动的视角[J]. 管理学刊, 2024, 37(5):14-31.
|
| [32] |
|
/
| 〈 |
|
〉 |