
Correlation among the Construction Industry, Energy Consumption and Carbon Emissions in the Yangtze River Economic Belt and Their Spatiotemporal Evolution
Received date: 2024-08-21
Revised date: 2024-11-12
Online published: 2025-05-12
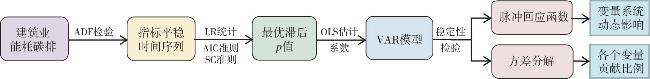
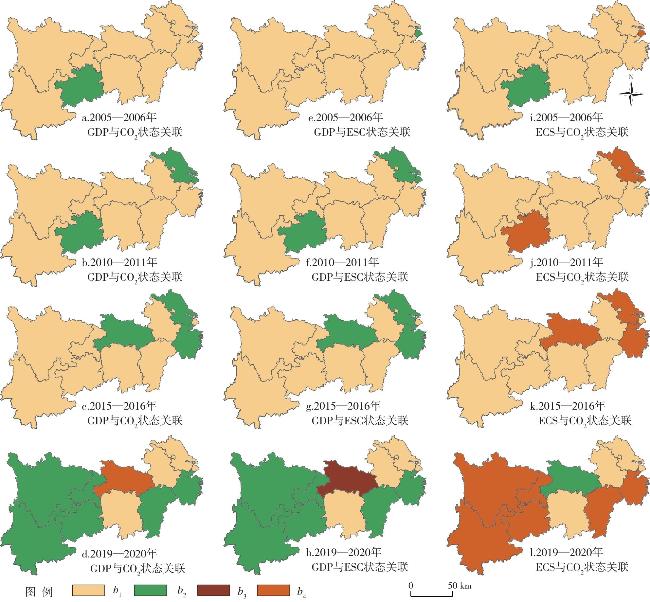
Taking the Yangtze River Economic Belt as the study area and based on the three-variable index data from 2005 to 2020, this study introduces a combined research method based on VAR model and moving time window sHMM (MV-sHMM), and investigates the correlation among the construction industry, energy consumption and carbon emissions, along with their spatiotemporal evolution. The results show that: 1) The development of the construction industry in the Yangtze River Economic Belt has a positive impact on energy consumption and carbon emissions, the impact of energy consumption and carbon emissions on the construction industry transitions from negative to positive before entering a phase of fluctuation, and the effect of energy consumption on carbon emissions shifts from negative to fluctuating. 2) In comparison to the construction industry and energy consumption, carbon emissions exhibit a quicker return to stability. However, in the absence of robust external intervention, the overall recovery rate of the three-variable system is relatively slow. 3) The relationship among the state of the construction industry, energy consumption and carbon emissions demonstrates significant spatial and temporal heterogeneity in the Yangtze River Economic Belt. The decoupling of the construction industry from energy consumption and carbon emissions has gradually expanded from Shanghai and Guizhou to Jiangsu, Zhejiang and Hubei. By 2020, the development of the construction industry in the majority of provincial-level regions in the Yangtze River Economic Belt has decoupled from carbon emissions, with a substantial reduction in the growth rate of energy consumption. Carbon emissions, experienced a spatiotemporal evolution process from point to surface. Finally, it proposes some suggestions: the implementation of dynamic and scientific policies, optimization of the energy structure, and the enhancement of diversified cooperation, aiming to provide a reference for promoting the low-carbon, sustainable and high-quality development of the construction industry.
XIAO Yuxuan , HU Xijun , WEI Baojing . Correlation among the Construction Industry, Energy Consumption and Carbon Emissions in the Yangtze River Economic Belt and Their Spatiotemporal Evolution[J]. Economic geography, 2025 , 45(2) : 47 -57 . DOI: 10.15957/j.cnki.jjdl.2025.02.005
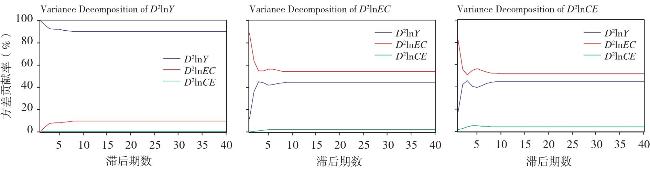
图2 D2lnY、D2lnEC、D2lnCO2的40期方差分解注:图中纵轴为各变量冲击对目标变量总回应的贡献比例。 Fig.2 The 40-period variance decomposition of D2lnY、D2lnEC、D2lnCO2 |
表1 三变量间的方差分解结果Tab1 Results of the variance decomposition among the three factors |
| 期 | D2lnY | D2lnEC | D2lnCO2 | |||||
|---|---|---|---|---|---|---|---|---|
| D2lnEC | D2lnCO2 | D2lnY | D2lnCO2 | D2lnY | D2lnEC | |||
| 1 | 0.000000 | 0.000000 | 11.71751 | 0.000000 | 17.27538 | 81.67563 | ||
| 2 | 4.366469 | 0.000105 | 36.23844 | 0.378031 | 41.61137 | 55.89716 | ||
| 3 | 7.536060 | 0.036493 | 44.65233 | 0.987255 | 45.23288 | 50.70885 | ||
| 4 | 7.876928 | 0.145912 | 43.77029 | 1.496842 | 40.49192 | 54.68084 | ||
| 5 | 7.883966 | 0.280845 | 42.00522 | 1.695050 | 39.06571 | 56.22838 | ||
| 6 | 8.485923 | 0.379641 | 42.30835 | 1.690757 | 40.92588 | 54.69888 | ||
| 7 | 9.167724 | 0.425839 | 43.35460 | 1.649117 | 42.88365 | 52.94746 | ||
| 8 | 9.527857 | 0.439106 | 44.01569 | 1.627205 | 43.85305 | 52.05631 | ||
| 9 | 9.623252 | 0.440763 | 44.21742 | 1.621361 | 44.11833 | 51.80941 | ||
| 10 | 9.625476 | 0.440475 | 44.23399 | 1.620518 | 44.14429 | 51.78523 | ||
| 均值 | 8.371359 | 0.302954 | 39.65138 | 1.276614 | 39.96025 | 56.24882 | ||
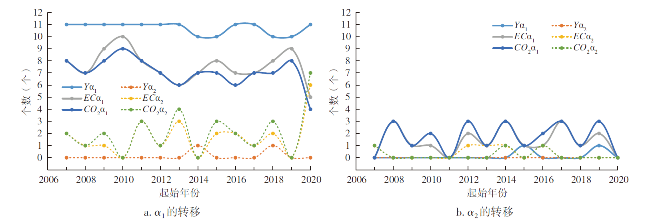
图3 隐含状态 和 1步转移地区数量变化注:图中纵轴为窗口内观察到的状态转移地区数量,实线代表转移为增长状态 ,虚线代表转移为降低状态 。 Fig.3 Number change of 1-step transfer regions in implicit states and |
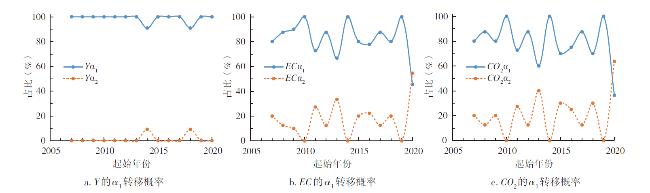
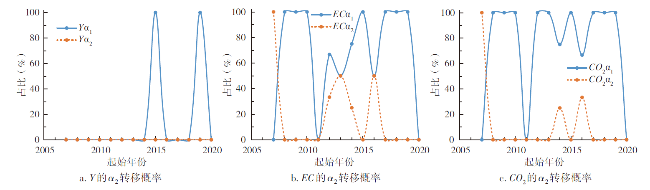
图4 隐含状态 1步转移概率变化注:图中纵轴为窗口内观察到的状态转移概率,实线代表转移为增长状态 ,虚线代表转移为降低状态 。 Fig.4 Probability change of 1-step transfer in implicit state |
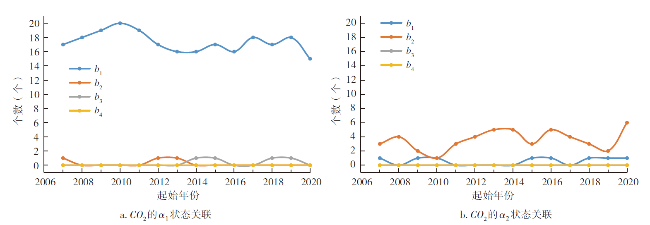
图6 1步转移 隐藏—观测状态关联地区数量变化Fig.6 Number change of 1-step shift in hidden-observation state-associated regions |
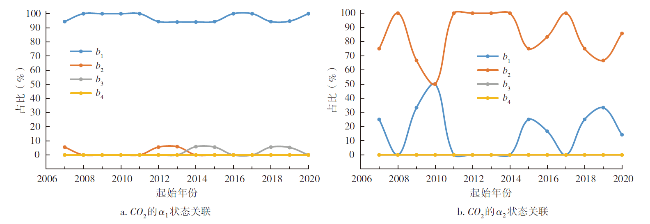
图7 1步转移 隐藏—观测关联状态概率变化Fig.7 Probability change of 1-step transfer in hide-observe associated state |
| [1] |
|
| [2] |
中国建筑节能协会. 2021 中国建筑能耗与碳排放研究报告[R/OL]. https://www.cabee.org/site/content/24237.html,2021-12-23.
|
| [3] |
|
| [4] |
|
| [5] |
|
| [6] |
|
| [7] |
|
| [8] |
|
| [9] |
|
| [10] |
|
| [11] |
Attílio Luccas Assis,Faria João Ricardo,Rodrigues Mauro. Does monetary policy impact CO2 emissions? A GVAR analysis[J]. Energy Economics, 2023,119:106559.
|
| [12] |
|
| [13] |
|
| [14] |
龙志. 县域尺度碳排放时空格局与碳平衡分区优化[D]. 兰州: 兰州大学, 2022.
|
| [15] |
|
| [16] |
|
| [17] |
|
| [18] |
|
| [19] |
|
| [20] |
|
| [21] |
|
| [22] |
|
| [23] |
|
| [24] |
|
| [25] |
IPCC. 2006 IPCC Guidelines for National Greenhouse Gas Inventories[R]. IPCC,2006.
|
| [26] |
|
| [27] |
|
| [28] |
清华大学建筑节能研究中心. 中国建筑节能年度发展研究报告2022[R]. 北京: 中国建筑工业出版社, 2022.
|
| [29] |
侯成琪, 肖雅慧. 住房价格与经济增长:基于中间品需求管道及其乘数效应的分析[J]. 经济研究, 2022, 57(4):120-137.
|
/
| 〈 |
|
〉 |