
Spatiotemporal Characteristics and Influencing Factors of Collaborative Development Between Coal and Thermal Power Industries at the Provincial Level
Received date: 2024-08-12
Revised date: 2025-02-20
Online published: 2025-05-12
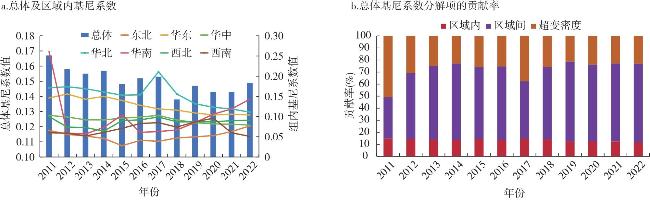
Based on the provincial-level data of coal and thermal power from 2011 to 2022, this paper investigates the spatiotemporal characteristics and influencing factors of the coupling coordination degree of coal-thermal power industries by the methods of the coupling coordination degree model, Dagum Gini coefficient, spatial autocorrelation, and econometric model. The results show that: 1) The coupling coordination degree of the coal-thermal power industries exhibited a state of primary coordination, exhibiting a trend of periodic fluctuation growth. 2) The coupling coordination degree of the coal-thermal power industries demonstrated a spatial pattern of "multi-core" radiation, evolving from a state of disharmony to coordination. 3) Regional disparities were identified as the primary source of differences in the coupling coordination degree. 4) The coupling coordination degree displayed positive spatial autocorrelation, which remained fundamentally stable over time. 5) The driving mechanism analysis highlights that the economic development, industrial structure and electricity demand are significant factors that promote coal-thermal power integration. These conclusions provide empirical evidence for understanding the development trends and regional differences of coal-thermal power industries and promoting coal-thermal power integration.
LIU Nan , KONG Jun . Spatiotemporal Characteristics and Influencing Factors of Collaborative Development Between Coal and Thermal Power Industries at the Provincial Level[J]. Economic geography, 2025 , 45(2) : 133 -143 . DOI: 10.15957/j.cnki.jjdl.2025.02.013
表1 区域煤—电系统耦合协调水平评价指标体系及说明Tab.1 Evaluation index of coupling coordination of coal-thermal power industries and its explanation |
| 类型 | 一级 | 二级指标 | 指标定义 | 单位 |
|---|---|---|---|---|
| 煤 炭 子 系 统 | 产业规模 | 固定资产投资额 | 煤炭产业固定资产投资 | 亿元 |
| 产值 | 煤炭产业产值 | 亿元 | ||
| 经济效益 | 就业人员年平均工资 | 煤炭产业年平均工资 | 元 | |
| 劳动生产率 | 煤炭产业产值/产业就业人数 | 万元/人 | ||
| 成长潜力 | 产值增长率 | (当年煤炭产业产值-上一年煤炭产业产值) /上一年煤炭产业产值×100% | % | |
| 固定资产投资增长率 | (当年煤炭产业固定资产投资-上一年煤炭产业固定资产投资)/上一年煤炭产业固定资产投资×100% | % | ||
| 产业贡献 | 就业人员人数 | 煤炭产业就业人数 | 万人 | |
| 税收贡献率 | 煤炭产业税收收入/煤炭产业产值×100% | % | ||
| 生产效率 | 火力发电投入产出量 | 火力发电投入产出量 | 万t | |
| 火 电 子 系 统 | 产业规模 | 装机容量 | 火力发电装机容量 | 万kW |
| 火电产业产值 | 火力发电量×发电企业平均上网电价 | 亿元 | ||
| 经济效益 | 就业人员年平均工资 | 电力产业就业人员年平均工资 | 元 | |
| 劳动生产率 | 电力产业产值/电力产业就业人数 | 万元/人 | ||
| 成长潜力 | 产值增长率 | (当年火电产业产值-上一年火电产业产值)/上一年火电产业产值×100% | % | |
| 装机容量增长率 | (当年火电装机容量-上一年火电装机容量)/上一年火电装机容量×100% | % | ||
| 产业贡献 | 就业人员人数 | 电力产业就业人数 | 万人 | |
| 税收贡献率 | 电力产业税收收入/电力产业产值×100% | % | ||
| 生产效率 | 电力设备工作时长 | 火力发电量/火力发电装机容量 | h |
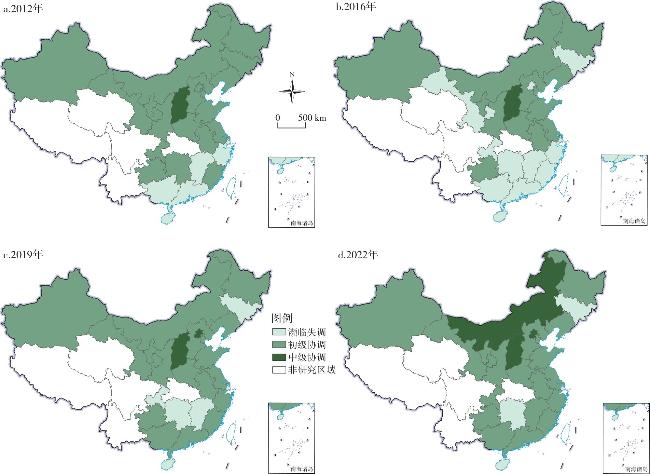
表2 耦合协调类型划分标准Tab.2 Classification criteria of coupling coordination degree |
| D值 | (0.00,0.10] | (0.10,0.25] | (0.25,0.50] | (0.50,0.75] | (0.75,1.00] |
|---|---|---|---|---|---|
| 协调类型 | 衰退失调 | 濒临失调 | 初级协调 | 中级协调 | 高级协调 |
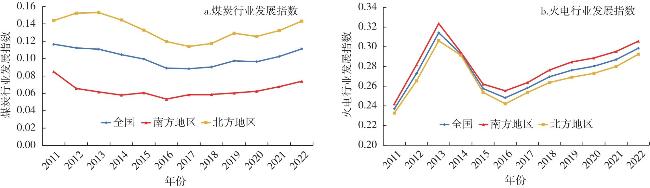
图2 2011—2022年中国煤炭与火电行业发展水平变化趋势Fig.2 Variation trend of the development level of coal and thermal power industries in China from 2011 to 2022 |
表3 2011—2022年全国及分区域煤—电系统耦合协调度Tab.3 Coupling coordination degree of coal-thermal power industries in China from 2011 to 2022 |
| 地区 | 2011 | 2012 | 2013 | 2014 | 2015 | 2016 | 2017 | 2018 | 2019 | 2020 | 2021 | 2022 |
|---|---|---|---|---|---|---|---|---|---|---|---|---|
| 全国 | 0.3214 | 0.3186 | 0.3193 | 0.3108 | 0.3036 | 0.2933 | 0.2933 | 0.2987 | 0.3077 | 0.3069 | 0.3152 | 0.3262 |
| 南方 | 0.2847 | 0.2656 | 0.2628 | 0.2550 | 0.2568 | 0.2457 | 0.2540 | 0.2558 | 0.2590 | 0.2620 | 0.2699 | 0.2787 |
| 北方 | 0.3530 | 0.3640 | 0.3677 | 0.3587 | 0.3436 | 0.3340 | 0.3270 | 0.3354 | 0.3495 | 0.3454 | 0.3541 | 0.3669 |
| 华北 | 0.3846 | 0.3960 | 0.4078 | 0.4103 | 0.3840 | 0.3876 | 0.3432 | 0.3702 | 0.4151 | 0.4071 | 0.4168 | 0.4396 |
| 东北 | 0.2963 | 0.3016 | 0.2908 | 0.2767 | 0.2624 | 0.2573 | 0.2608 | 0.2631 | 0.2621 | 0.2598 | 0.2670 | 0.2768 |
| 华东 | 0.2921 | 0.2995 | 0.2930 | 0.2798 | 0.2858 | 0.2703 | 0.2849 | 0.2798 | 0.2752 | 0.2740 | 0.2747 | 0.2779 |
| 华中 | 0.3504 | 0.3583 | 0.3453 | 0.3298 | 0.3154 | 0.2979 | 0.2951 | 0.2941 | 0.2860 | 0.2796 | 0.2830 | 0.2842 |
| 华南 | 0.3129 | 0.3198 | 0.3097 | 0.2955 | 0.2879 | 0.2752 | 0.2803 | 0.2790 | 0.2745 | 0.2711 | 0.2749 | 0.2797 |
| 西南 | 0.3316 | 0.3391 | 0.3275 | 0.3127 | 0.3016 | 0.2866 | 0.2877 | 0.2866 | 0.2802 | 0.2754 | 0.2790 | 0.2819 |
| 西北 | 0.3218 | 0.3292 | 0.3189 | 0.3045 | 0.2977 | 0.2825 | 0.2870 | 0.2849 | 0.2790 | 0.2750 | 0.2779 | 0.2809 |
表4 2011—2022年区域间基尼系数变化率和年均值Tab.4 Rate change and annual average of inter-regional Gini coefficient from 2011 to 2022 |
| 东北—华东 | 东北—华中 | 东北—华北 | 东北—华南 | 东北—西北 | 东北—西南 | 华东—华中 | |
|---|---|---|---|---|---|---|---|
| 变化率(%) | -20.33 | -30.71 | 31.43 | -43.35 | 48.39 | 42.86 | -35.29 |
| 年均值 | 0.1064 | 0.1067 | 0.2023 | 0.1195 | 0.1135 | 0.0829 | 0.1272 |
| 华东—华北 | 华东—华南 | 华东—西北 | 华东—西南 | 华中—华北 | 华中—华南 | 华中—西北 | |
| 变化率(%) | 16.58 | -43.15 | 4.41 | -10.00 | 38.13 | -44.40 | 10.92 |
| 年均值 | 0.2099 | 0.1477 | 0.1343 | 0.1153 | 0.1845 | 0.1680 | 0.1133 |
| 华中—西南 | 华北—华南 | 华北—西北 | 华北—西南 | 华南—西北 | 华南—西南 | 西北—西南 | |
| 变化率(%) | -24.81 | -6.00 | -13.53 | -9.44 | -32.91 | -41.81 | -12.37 |
| 年均值 | 0.1062 | 0.2615 | 0.1583 | 0.1833 | 0.1853 | 0.1414 | 0.1015 |
表5 2011—2022年煤—电系统耦合协调度全局莫兰指数Tab.5 Global Moran's I of coupling coordination degree of coal-thermal power industries from 2011 to 2022 |
| 地区 | 2011 | 2012 | 2013 | 2014 | 2015 | 2016 | 2017 | 2018 | 2019 | 2020 | 2021 | 2022 |
|---|---|---|---|---|---|---|---|---|---|---|---|---|
| Moran's I | 0.002 | 0.430 | 0.422 | 0.373 | 0.262 | 0.198 | 0.340 | 0.314 | 0.172 | 0.174 | 0.211 | 0.207 |
| P值 | 0.762 | 0.001 | 0.001 | 0.002 | 0.026 | 0.086 | 0.006 | 0.009 | 0.124 | 0.124 | 0.070 | 0.077 |
表6 驱动机制计量估计结果Tab.6 Estimation results of the driving mechanism |
| 变量 | FE | SLM | |||
|---|---|---|---|---|---|
| (1) | (2) | (3) | (4) | ||
| 经济发展水平 | 0.205* | 0.548*** | 0.141 | -0.089* | |
| (0.11) | (0.16) | (0.29) | (0.053) | ||
| 产业结构 | 0.120** | 0.159** | 0.060 | 0.018 | |
| (0.05) | (0.06) | (0.07) | (0.028) | ||
| 用电需求 | 0.214** | 0.104 | 0.420* | 0.300*** | |
| (0.08) | (0.10) | (0.24) | (0.067) | ||
| 煤炭运输 | -0.009 | -0.028*** | 0.012 | 0.003 | |
| (0.01) | (0.01) | (0.01) | (0.006) | ||
| 电力输送 | -0.098 | -0.569*** | -0.019 | -0.078 | |
| (0.10) | (0.14) | (0.30) | (0.052) | ||
| 煤炭工业投资 | 0.014 | 0.083*** | -0.005 | 0.040*** | |
| (0.01) | (0.02) | (0.02) | (0.011) | ||
| 电力产业投资 | -0.015 | -0.072*** | -0.036 | -0.012 | |
| (0.02) | (0.02) | (0.04) | (0.016) | ||
| 煤炭价格 | -0.097 | -0.167 | -0.062 | -0.034 | |
| (0.08) | (0.13) | (0.10) | (0.052) | ||
| 常数项 | 1.389 | 4.539** | -0.463 | 2.466*** | |
| (1.45) | (1.99) | (2.78) | (0.442) | ||
| 样本量 | 312 | 168 | 144 | 312 | |
| ρ | 0.138** | ||||
| (0.065) | |||||
| R2 | 0.184 | 0.362 | 0.193 | 0.138 | |
| 双向固定效应 | 是 | 是 | 是 | ||
注:括号内数值为标准误,*** 、** 、*分别表示在1%、5%、10%的水平上显著。 |
| [1] |
于伟静, 杨鹏威, 王放放, 等. 双碳战略背景下中国煤电技术发展与挑战[J]. 煤炭学报, 2023, 48(7):2641-2656.
|
| [2] |
|
| [3] |
马文瑾. 煤电联营企业利润分配分析[J]. 内蒙古煤炭经济, 2021(9):62-63.
|
| [4] |
贾晶莹, 马占新. 煤电联营企业经济状况效率分析与实证[J]. 统计与决策, 2009(11):89-91.
|
| [5] |
|
| [6] |
张华明. 产业纵向结构视角下的山西煤电一体化发展对策[J]. 宏观经济管理, 2017(6):81-85.
|
| [7] |
李丽, 杨力, 韩静. 煤电一体化趋势下煤电联营的博弈分析[J]. 中国煤炭, 2011, 37(1):29-32.
|
| [8] |
朱大庆, 欧国立. 煤电一体化的若干问题与政策建议[J]. 宏观经济管理, 2013(7):67-68,71.
|
| [9] |
杨彤, 时如义, 康长安. 煤电一体化的不利影响及防范措施[J]. 中国煤炭, 2013, 39(3):17-19,52.
|
| [10] |
梁庆平, 许若琪, 孙自愿. 煤企纵向一体化程度与投资效率研究——地方政府规制视角[J]. 会计之友, 2015(22):36-40.
|
| [11] |
周幸窈. 基于产业链视角的煤电联营协同机制研究[D]. 北京: 中国矿业大学(北京), 2021.
|
| [12] |
王雨佳. 能源产业链整合与企业生产效率——以煤电纵向一体化为例[J]. 北京理工大学学报(社会科学版), 2019, 21(4):29-38.
|
| [13] |
郭金刚, 王团维. 煤电一体化产业经济研究[J]. 会计之友, 2013(26):53-61.
|
| [14] |
|
| [15] |
林圣华. 煤电联营对用能成本和能源安全影响研究[J]. 煤炭经济研究, 2022, 42(3):11-16.
|
| [16] |
刘希颖, 林伯强. 改革能源定价机制以保障可持续发展——以煤电联动政策为例[J]. 金融研究, 2013(4):112-126.
|
| [17] |
|
| [18] |
张熙霖, 张中彦. 国家能源投资集团重组整合研究和思考[J]. 煤炭经济研究, 2018, 38(4):14-17.
|
| [19] |
|
| [20] |
吴亚平. 我国煤电联营发展情况分析和措施建议[J]. 煤炭工程, 2016, 48(12):138-141.
|
| [21] |
于树奎. 浅谈煤电一体化存在的问题和对策[J]. 中国管理信息化, 2019, 22(21):155-156.
|
| [22] |
张华明, 赵国浩, 侯若瑶. 电煤价格上涨对电力行业影响的实证分析——以山西省为例[J]. 价格理论与实践, 2008(10):33-34.
|
| [23] |
王强, 刘海英. 煤炭中长期合同“压舱石”作用的机制研究——兼析煤炭中长期合同签订与履约及其影响因素[J]. 价格理论与实践, 2022(11):84-87.
|
| [24] |
杨娜, 谢道清, 任曦骏, 等. 电力现货市场、火电企业成本与输电定价决策[J]. 会计之友, 2023(16):39-44.
|
| [25] |
张引刚. 浅议电力行业煤炭需求变异风险[J]. 中国煤炭, 2014, 40(5):23-25.
|
| [26] |
李绪茂, 王成金. 中国煤炭产业经济效率类型与空间分异[J]. 干旱区资源与环境, 2020, 34(5):58-63.
|
| [27] |
郭金. 资源型经济转型与煤炭产业提升研究[J]. 经济问题, 2020(6):118-123.
|
| [28] |
陈梦根, 侯园园. 中国行业劳动投入和劳动生产率:2000—2018[J]. 经济研究, 2021, 56(5):109-126.
|
| [29] |
袁家海, 王媛, 杨晓文, 等. “双碳”目标下省级煤电退出的就业影响与脆弱性评估[J]. 中国人口·资源与环境, 2023, 33(7):67-80.
|
| [30] |
邝嫦娥, 李文意, 黄小丝. 长江中游城市群碳排放强度与经济高质量发展耦合协调的时空演变及驱动因素[J]. 经济地理, 2022, 42(8):30-40.
|
| [31] |
赵林, 张春霆, 高晓彤, 等. 黄河流域绿色发展与共同富裕耦合协调水平变化及其影响因素[J]. 经济地理, 2024, 44(8):57-67.
|
| [32] |
|
| [33] |
周正柱, 冯博文. 长三角城市群商品流通发展的时空演变特征、区域差异及分布动态演进[J]. 上海交通大学学报(哲学社会科学版), 2024, 32(2):24-47.
|
| [34] |
李兰兰. 我国电力工业投资的影响因素研究[D]. 重庆师范大学, 2021.
|
| [35] |
柴建, 万欣, 寇红红, 等. 价格扭曲对电力市场供需失衡的影响研究[J]. 计量经济学报, 2022, 2(4):864-880.
|
/
| 〈 |
|
〉 |