
Regional Differentiation and Convergence of the Development Level of Active Aging Industry in China
Received date: 2024-06-26
Revised date: 2025-01-12
Online published: 2025-05-12
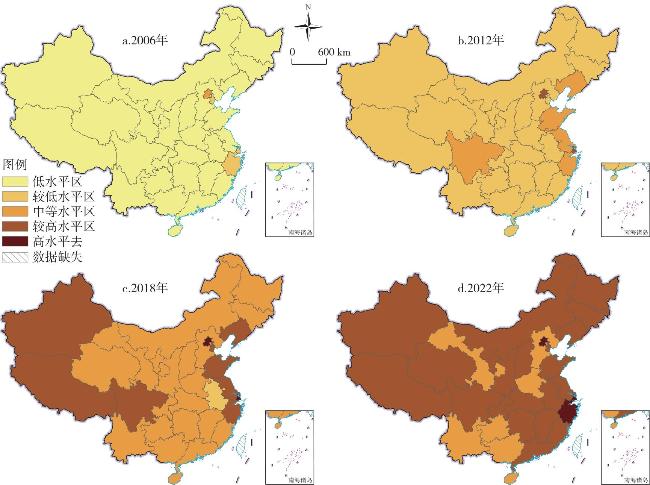
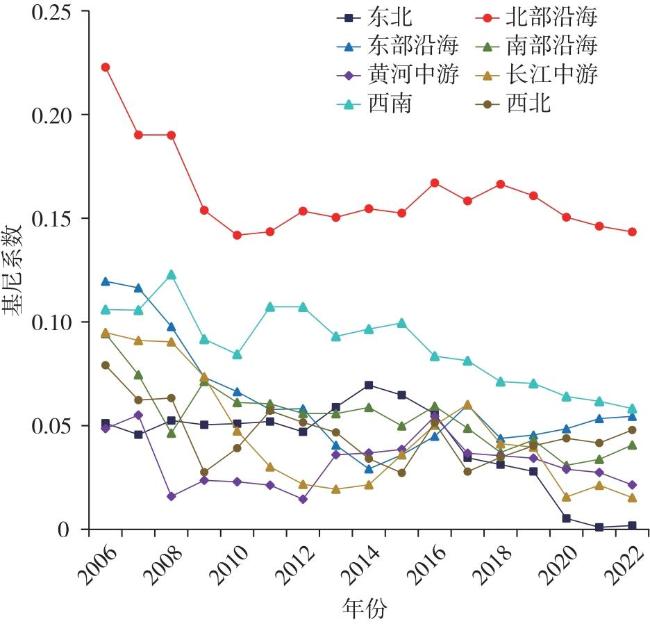
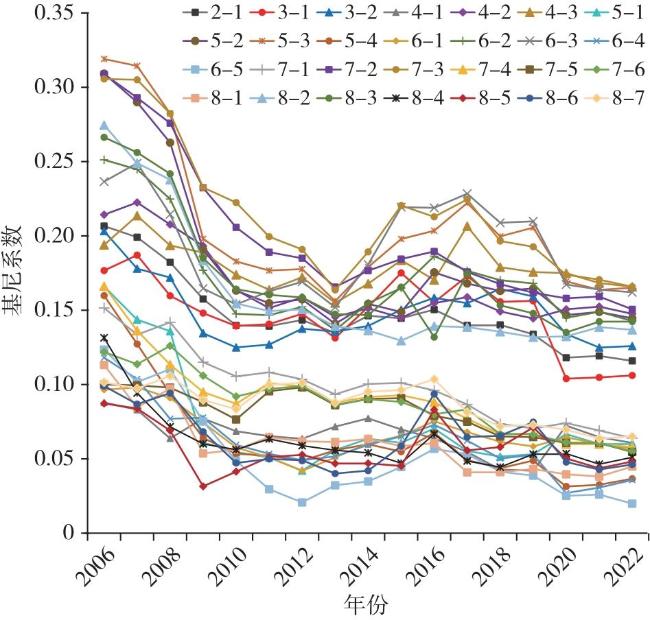
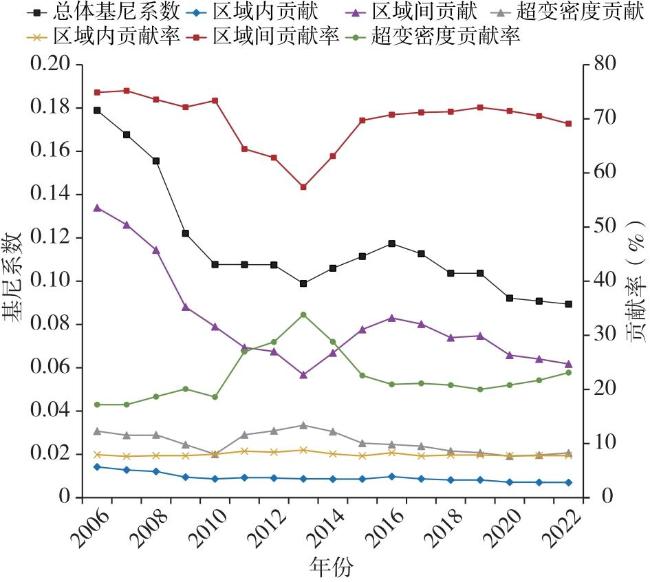
Based on the measurement index system of the development level of China's active aging industry from 2006 to 2022, this article uses the methods of Dagum Gini coefficient and variance decomposition to decompose the spatial differences in the development level of active aging industry in eight major regions of China, and relies on coefficient of variation method and spatial panel data model to reveal their σ and β convergence characteristics. It's found that: 1) During the sample observation period, the level of development of China's active aging industry continued to rise, but exhibited significant characteristics of structural instability and regional imbalances. 2) The inter-regional difference was the main source of overall regional disparities, and the largest source of structural difference was the differences of the friendly environment dimension. 3) The σ convergence test results show that the development level of active aging industry showed σ convergence characteristics in eight major regions of China. Except for the northeastern region which did not have absolute β convergence or conditional β convergence, and the southern coastal region which did not have conditional β convergence, the differences in the development level of active aging industry showed gradually diminishing trend after considering factors such as economic development level, population age structure, government policy orientation, and scientific and technological innovation, which ultimately converges to the same steady-state level. This article will provide factual basis for a clear understanding of the development pattern of China's active aging industry, and provide policy insights on how to promote the national strategy of actively responding to population aging in a gradient manner and promote balanced development of the aging industry.
LI Lei , HUANG Zhihong , WANG Zhen , HUANG Baocong . Regional Differentiation and Convergence of the Development Level of Active Aging Industry in China[J]. Economic geography, 2025 , 45(2) : 123 -132 . DOI: 10.15957/j.cnki.jjdl.2025.02.012
表1 中国积极老龄化事业发展水平测度指标及权重Tab.1 Indicators and weights of the development level of China's active aging industry |
| 一级指标 | 二级指标 | 三级指标 | 权重 |
|---|---|---|---|
| 健康维度(0.2088) | 健康水平(0.0428) | 人均预期寿命(岁) | 0.0079 |
| 人均医疗卫生机构门诊诊疗人数(次) | 0.0193 | ||
| 居民年住院率(%) | 0.0156 | ||
| 健康支出(0.0580) | 卫生总费用占GDP比重(%) | 0.0175 | |
| 人均卫生总费用(元) | 0.0336 | ||
| 个人卫生支出占总费用比重(%) | 0.0069 | ||
| 健康资源(0.1080) | 每千人拥有医生数(人) | 0.0186 | |
| 每千人拥有医疗机构床位数(张) | 0.0173 | ||
| 每千人拥有基层医疗机构数(个) | 0.0249 | ||
| 每千人拥有专业卫生机构数(个) | 0.0472 | ||
| 保障维度(0.3011) | 养老保障(0.0639) | 养老保险覆盖率(%) | 0.0172 |
| 人均养老金水平(元) | 0.0276 | ||
| 养老基金财政占比(%) | 0.0191 | ||
| 医疗保障(0.0732) | 医疗保险覆盖率(%) | 0.0249 | |
| 人均医保基金支出水平(元) | 0.0261 | ||
| 医保基金财政占比(%) | 0.0222 | ||
| 养老服务(0.1640) | 每万人拥有养老机构单位数(个) | 0.0179 | |
| 每万人拥有养老机构年末职工人数(人) | 0.0293 | ||
| 每万人拥有养老机构年末床位数(张) | 0.0242 | ||
| 养老机构老人人数(人) | 0.0492 | ||
| 人均养老产业增加值(元) | 0.0434 | ||
| 社会参 与维度 (0.1699) | 经济参与(0.0089) | 老年消费支出(居民人均医疗保健消费 支出/居民人均消费支出)(%) | 0.0089 |
| 活动参与(0.0522) | 每万人拥有老年活动站/中心/室数(个) | 0.0251 | |
| 每万人拥有老年人协会数(个) | 0.0271 | ||
| 社会参与 投入 (0.1088) | 人均地方财政社会保障和就业支出(元) | 0.0334 | |
| 人均地方财政教育支出(元) | 0.0291 | ||
| 人均地方财政文化体育与传媒支出(元) | 0.0463 | ||
| 友好环 境维度 (0.3202) | 绿色空间(0.0577) | 森林覆盖率(%) | 0.0259 |
| 每万人拥有公园数(个) | 0.0318 | ||
| 交通出行(0.0641) | 每万人拥有城市道路照明灯(盏) | 0.0212 | |
| 每万人拥有公共交通车辆(台) | 0.0137 | ||
| 人均客运量(人次) | 0.0292 | ||
| 生活服务(0.1984) | 人均天然气供气量(m3/年) | 0.0747 | |
| 人均供水综合生产能力(m3/日) | 0.0429 | ||
| 人均拥有互联网宽带接入端口(个) | 0.0378 | ||
| 每万人拥有邮政营业网点(处) | 0.0430 |
表2 中国积极老龄化事业发展水平统计Tab.2 Statistical table of the development level of China's active aging industry |
| 2006 | 2007 | 2008 | 2009 | 2010 | 2011 | 2012 | 2013 | 2014 | 2015 | 2016 | 2017 | 2018 | 2019 | 2020 | 2021 | 2022 | 年均增 长率(%) | |
|---|---|---|---|---|---|---|---|---|---|---|---|---|---|---|---|---|---|---|
| 全国 | 11.92 | 12.28 | 13.38 | 16.22 | 17.68 | 19.10 | 21.19 | 23.32 | 23.77 | 25.66 | 25.94 | 27.67 | 29.12 | 30.51 | 31.57 | 33.27 | 33.91 | 6.75 |
| 东部地区 | 15.50 | 15.67 | 16.71 | 19.25 | 20.58 | 22.08 | 24.38 | 26.42 | 27.31 | 29.98 | 30.23 | 32.20 | 33.55 | 35.06 | 35.30 | 37.30 | 37.94 | 5.75 |
| 中部地区 | 10.44 | 10.69 | 12.13 | 15.18 | 16.62 | 17.65 | 19.42 | 21.33 | 21.15 | 22.32 | 22.17 | 24.30 | 25.68 | 26.83 | 29.36 | 31.11 | 31.72 | 7.19 |
| 西部地区 | 9.63 | 10.22 | 11.16 | 14.13 | 15.73 | 17.33 | 19.46 | 21.81 | 22.26 | 23.94 | 24.53 | 25.76 | 27.36 | 28.79 | 29.62 | 31.03 | 31.68 | 7.72 |
| 健康维度 | 2.49 | 2.59 | 2.74 | 4.45 | 4.79 | 4.97 | 5.47 | 6.49 | 6.89 | 7.03 | 7.08 | 7.19 | 7.43 | 7.52 | 8.08 | 8.37 | 8.46 | 7.93 |
| 保障维度 | 3.96 | 3.74 | 4.23 | 4.94 | 5.77 | 6.30 | 6.95 | 7.56 | 7.12 | 7.70 | 6.98 | 7.81 | 8.37 | 8.91 | 9.35 | 9.96 | 9.96 | 5.93 |
| 参与维度 | 2.05 | 2.26 | 2.41 | 2.50 | 2.58 | 2.90 | 3.22 | 3.35 | 3.54 | 3.85 | 4.11 | 4.37 | 4.57 | 4.91 | 5.12 | 5.12 | 5.33 | 6.16 |
| 环境维度 | 3.42 | 3.68 | 4.00 | 4.33 | 4.55 | 4.92 | 5.55 | 5.92 | 6.22 | 7.09 | 7.77 | 8.30 | 8.75 | 9.17 | 9.01 | 9.83 | 10.17 | 7.04 |
表3 八大区域积极老龄化事业发展水平统计Tab.3 Statistical table of the development level of active aging in eight major regions |
| 区域 | 2006 | 2007 | 2008 | 2009 | 2010 | 2011 | 2012 | 2013 | 2014 | 2015 | 2016 | 2017 | 2018 | 2019 | 2020 | 2021 | 2022 | 年均增长率(%) |
|---|---|---|---|---|---|---|---|---|---|---|---|---|---|---|---|---|---|---|
| 东北 | 12.53 | 12.68 | 14.10 | 16.13 | 17.61 | 18.76 | 20.56 | 22.74 | 22.88 | 24.58 | 25.27 | 27.15 | 28.44 | 29.73 | 32.73 | 34.32 | 34.86 | 6.60 |
| 北部沿海 | 16.83 | 16.99 | 17.87 | 21.05 | 21.93 | 23.21 | 25.80 | 27.65 | 28.43 | 30.92 | 31.60 | 33.18 | 34.98 | 36.46 | 37.33 | 39.63 | 40.08 | 5.57 |
| 东部沿海 | 17.36 | 18.21 | 19.17 | 21.59 | 23.19 | 24.90 | 27.67 | 29.62 | 31.10 | 35.02 | 34.57 | 38.51 | 38.93 | 40.74 | 40.33 | 42.36 | 43.14 | 5.85 |
| 南部沿海 | 12.27 | 11.80 | 12.95 | 14.73 | 16.32 | 17.89 | 19.55 | 21.68 | 22.16 | 24.15 | 24.50 | 25.33 | 27.11 | 28.56 | 28.31 | 30.15 | 30.87 | 5.94 |
| 黄河中游 | 8.96 | 9.50 | 10.73 | 14.45 | 16.02 | 17.42 | 19.32 | 21.62 | 21.66 | 23.45 | 22.88 | 24.51 | 25.97 | 26.84 | 28.64 | 30.44 | 30.91 | 8.05 |
| 长江中游 | 10.88 | 11.03 | 12.40 | 15.48 | 17.00 | 17.93 | 19.67 | 21.81 | 21.58 | 22.42 | 22.15 | 24.19 | 25.48 | 26.61 | 28.77 | 30.43 | 31.11 | 6.79 |
| 西南 | 9.23 | 9.70 | 10.73 | 13.44 | 14.75 | 16.62 | 18.82 | 21.32 | 21.20 | 22.37 | 22.43 | 24.39 | 26.14 | 27.57 | 28.38 | 30.01 | 30.87 | 7.83 |
| 西北 | 10.06 | 10.78 | 11.70 | 14.85 | 16.65 | 18.02 | 20.10 | 22.01 | 23.14 | 25.07 | 26.51 | 27.06 | 28.58 | 30.24 | 30.73 | 31.80 | 32.39 | 7.58 |
表4 中国积极老龄化事业发展水平区域差异的分解结果Tab.4 Decomposition results of regional differences in the development level of China's active aging industry |
| 年份 | 总体基尼系数 | 区域内贡献 | 贡献率(%) | 区域间贡献 | 贡献率(%) | 超变密度贡献 | 贡献率(%) |
|---|---|---|---|---|---|---|---|
| 2006 | 0.1789 | 0.0142 | 7.94 | 0.1339 | 74.88 | 0.0307 | 17.18 |
| 2007 | 0.1677 | 0.0128 | 7.62 | 0.1261 | 75.19 | 0.0288 | 17.19 |
| 2008 | 0.1555 | 0.0121 | 7.77 | 0.1144 | 73.57 | 0.0290 | 18.66 |
| 2009 | 0.1221 | 0.0095 | 7.76 | 0.0881 | 72.16 | 0.0245 | 20.08 |
| 2010 | 0.1077 | 0.0086 | 8.03 | 0.0790 | 73.37 | 0.0200 | 18.60 |
| 2011 | 0.1076 | 0.0092 | 8.59 | 0.0694 | 64.43 | 0.0290 | 26.98 |
| 2012 | 0.1075 | 0.0090 | 8.41 | 0.0675 | 62.83 | 0.0309 | 28.76 |
| 2013 | 0.0989 | 0.0087 | 8.79 | 0.0568 | 57.40 | 0.0334 | 33.81 |
| 2014 | 0.1060 | 0.0086 | 8.08 | 0.0669 | 63.12 | 0.0305 | 28.80 |
| 2015 | 0.1115 | 0.0086 | 7.71 | 0.0777 | 69.71 | 0.0252 | 22.57 |
| 2016 | 0.1173 | 0.0097 | 8.30 | 0.0830 | 70.76 | 0.0246 | 20.94 |
| 2017 | 0.1127 | 0.0087 | 7.70 | 0.0802 | 71.19 | 0.0238 | 21.12 |
| 2018 | 0.1037 | 0.0082 | 7.88 | 0.0739 | 71.32 | 0.0216 | 20.80 |
| 2019 | 0.1037 | 0.0082 | 7.88 | 0.0748 | 72.11 | 0.0207 | 20.01 |
| 2020 | 0.0922 | 0.0071 | 7.75 | 0.0658 | 71.45 | 0.0192 | 20.80 |
| 2021 | 0.0908 | 0.0071 | 7.77 | 0.0640 | 70.53 | 0.0197 | 21.70 |
| 2022 | 0.0894 | 0.0070 | 7.79 | 0.0618 | 69.10 | 0.0207 | 23.11 |
| 均值 | 0.1161 | 0.0092 | 7.99 | 0.0814 | 69.60 | 0.0254 | 22.42 |
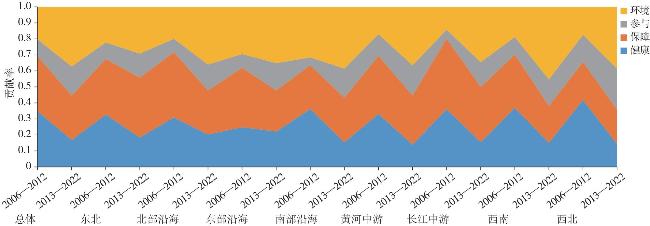
表5 中国及八大区域积极老龄化事业发展水平结构差异的分解结果Tab.5 Decomposition results of structural differences in the development level of active aging industry in China and eight major regions |
| 区域 | 健康维度(%) | 保障维度(%) | 参与维度(%) | 环境维度(%) |
|---|---|---|---|---|
| 全国 | 27.03 | 26.99 | 15.03 | 30.94 |
| 东北 | 25.53 | 33.61 | 12.99 | 27.87 |
| 北部沿海 | 23.72 | 31.87 | 13.14 | 31.28 |
| 东部沿海 | 22.18 | 31.98 | 13.43 | 32.41 |
| 南部沿海 | 26.14 | 23.80 | 13.96 | 36.10 |
| 黄河中游 | 27.74 | 27.16 | 16.45 | 28.65 |
| 长江中游 | 30.26 | 28.05 | 12.71 | 28.98 |
| 西南 | 29.52 | 24.34 | 13.94 | 32.20 |
| 西北 | 29.49 | 19.52 | 20.85 | 30.14 |
表6 中国及八大区域积极老龄化事业发展水平的变异系数结果Tab.6 Results of variation coefficient of the development level of active aging industry in China and eight major regions |
| 年份 | 全国 | 东北 | 北部 沿海 | 东部 沿海 | 南部 沿海 | 黄河 中游 | 长江 中游 | 西南 | 西北 |
|---|---|---|---|---|---|---|---|---|---|
| 2006 | 0.3670 | 0.1013 | 0.4250 | 0.2223 | 0.1780 | 0.0950 | 0.1778 | 0.2019 | 0.1441 |
| 2007 | 0.3372 | 0.0955 | 0.3583 | 0.2144 | 0.1581 | 0.1025 | 0.1717 | 0.2039 | 0.1135 |
| 2008 | 0.3105 | 0.0979 | 0.3631 | 0.1798 | 0.0853 | 0.0329 | 0.1742 | 0.2215 | 0.1197 |
| 2009 | 0.2467 | 0.1056 | 0.2913 | 0.1349 | 0.1329 | 0.0443 | 0.1387 | 0.1739 | 0.0527 |
| 2010 | 0.2164 | 0.1045 | 0.2661 | 0.1220 | 0.1124 | 0.0419 | 0.0857 | 0.1538 | 0.0745 |
| 2011 | 0.2120 | 0.1088 | 0.2705 | 0.1062 | 0.1120 | 0.0388 | 0.0540 | 0.1981 | 0.1071 |
| 2012 | 0.2179 | 0.0951 | 0.2977 | 0.1070 | 0.1045 | 0.0272 | 0.0409 | 0.2013 | 0.1046 |
| 2013 | 0.1993 | 0.1117 | 0.2938 | 0.0750 | 0.1126 | 0.0662 | 0.0365 | 0.1778 | 0.0894 |
| 2014 | 0.2100 | 0.1309 | 0.2975 | 0.0548 | 0.1163 | 0.0694 | 0.0414 | 0.1865 | 0.0615 |
| 2015 | 0.2244 | 0.1212 | 0.3023 | 0.0695 | 0.1043 | 0.0708 | 0.0673 | 0.1861 | 0.0498 |
| 2016 | 0.2368 | 0.1051 | 0.3374 | 0.0828 | 0.1093 | 0.0976 | 0.0937 | 0.1602 | 0.0913 |
| 2017 | 0.2302 | 0.0731 | 0.3078 | 0.1107 | 0.0924 | 0.0667 | 0.1129 | 0.1546 | 0.0542 |
| 2018 | 0.2232 | 0.0639 | 0.3426 | 0.0812 | 0.0688 | 0.0646 | 0.0778 | 0.1338 | 0.0678 |
| 2019 | 0.2190 | 0.0532 | 0.3289 | 0.0836 | 0.0795 | 0.0629 | 0.0724 | 0.1328 | 0.0825 |
| 2020 | 0.1921 | 0.0105 | 0.2893 | 0.0919 | 0.0571 | 0.0526 | 0.0285 | 0.1236 | 0.0823 |
| 2021 | 0.1879 | 0.0019 | 0.2713 | 0.1018 | 0.0635 | 0.0503 | 0.0383 | 0.1221 | 0.0779 |
| 2022 | 0.1846 | 0.0037 | 0.2684 | 0.1011 | 0.0775 | 0.0389 | 0.0280 | 0.1121 | 0.0928 |
| [1] |
艾伦·沃克, 朱火云. 从概念到政策:积极老龄化再认识[J]. 社会保障评论, 2023, 7(3):49-61.
|
| [2] |
国家应对人口老龄化战略研究课题组. 老龄事业发展指标体系研究[M]. 北京: 华龄出版社, 2014.
|
| [3] |
|
| [4] |
|
| [5] |
杨一帆, 张雪永, 陈杰, 等. 中国大中城市健康老龄化指数报告(2019—2020)[M]. 北京: 社会科学文献出版社, 2020.
|
| [6] |
周泽玄, 韩会然, 杨成凤. 县域尺度下长三角城市群人口老龄化时空特征及影响机理[J]. 经济地理, 2024, 44(2):90-101.
|
| [7] |
|
| [8] |
刘文, 杨馥萍. 中国积极老龄化水平测度——基于东中西部地区和28个省市的数据研究[J]. 人口学刊, 2019, 41(2):100-112.
|
| [9] |
张文娟, 薛诗睿. 中国农村老年人社会参与的脆弱性分析——基于CLASS2020数据的实证研究[J]. 人口与经济, 2024(2):61-74.
|
| [10] |
穆滢潭, 龙飞, 原新. 中国老年人健康老龄化的城乡差异及其变迁趋势——基于生命历程和健康公平视角的分析[J]. 人口研究, 2023, 47(4):82-97.
|
| [11] |
边恕, 王钰杰. 中国积极老龄化社会建设的区域系统协调水平研究[J]. 西安交通大学学报(社会科学版), 2023, 43(5):35-47.
|
| [12] |
李磊, 王震, 李连友. “双循环”新发展格局下银发经济高质量发展的三重逻辑[J]. 河海大学学报(哲学社会科学版), 2024, 26(5):49-61.
|
| [13] |
|
| [14] |
辛冲冲, 陈志勇. 中国基本公共服务供给水平分布动态、地区差异及收敛性[J]. 数量经济技术经济研究, 2019, 36(8):52-71.
|
| [15] |
李连友, 李磊. 构建积极老龄化政策体系释放中国老年人口红利[J]. 中国行政管理, 2020(8):21-25.
|
/
| 〈 |
|
〉 |