
Spatial Correlation Between Rail Transit Structure and Commercial Vitality in Shenzhen
Received date: 2020-04-29
Revised date: 2020-11-21
Online published: 2025-04-30
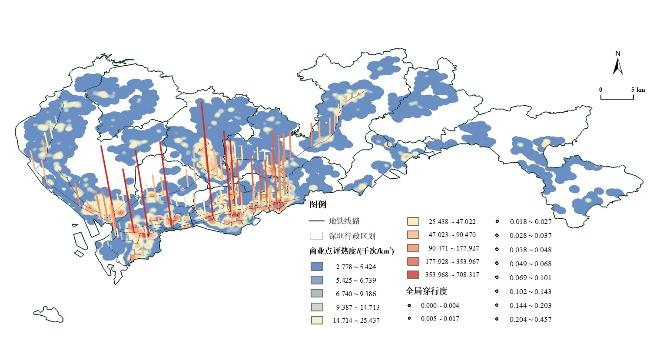
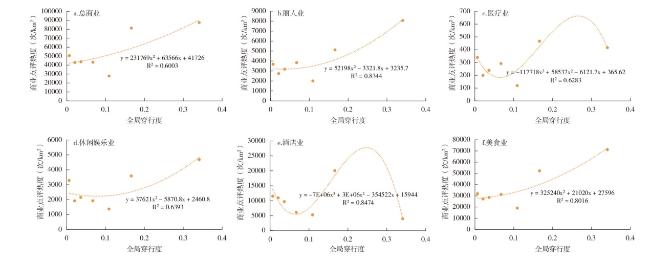
This article taking Shenzhen as research area,analyzes the spatial distribution of rail transit structure and commercial vitality based on the spatial syntax theory and the number of comment from Dianping. It studies the correlation between station structure attributes and surrounding commercial vitality by the means of the bivariate correlation method to,and explores the spatial differentiation of the correlation effect applying the Anselin Local Moran's I. The results show that: 1) It shows coupled relationship in the spatial distribution between rail transit station structure and commercial vitality,higher value areas of the global integration and global choice coincide with the higher value areas of commercial vitality. 2) It shows statistically significant positive correlation characteristics between the rail transit station structure and the total commercial vitality around station area. The correlation of commercial vitality with global integration value is more significant than the global choice value. It presents the different correlation between all types of commercial vitality and the rail transit station structure,and the hotel industry has the weakest correlation with the rail transit station structure. 3) There are differences for the correlation effect between the structure of different rail transit stations and commercial vitality. According to the factors influencing their coordination,this paper puts forward to improve the correlation effect,which is conducive to the coordinated development of urban rail transit and commerce.
HAN Han . Spatial Correlation Between Rail Transit Structure and Commercial Vitality in Shenzhen[J]. Economic geography, 2021 , 41(3) : 86 -96 . DOI: 10.15957/j.cnki.jjdl.2021.03.009
表1 空间句法变量与商业点评热度的相关性及显著性检验Tab.1 Correlation and significance tests of spatial syntactic variables and the number of comment |
| 热度类型 | 相关性 | 全局集成度 | 全局穿行度 |
|---|---|---|---|
| 总商业点 | r | 0.963** | 0.766* |
| 评热度 | Sig. | 0.001 | 0.045 |
| 丽人业点 | r | 0.931** | 0.865* |
| 评热度 | Sig. | 0.002 | 0.012 |
| 医疗业点 | r | 0.922** | 0.538 |
| 评热度 | Sig. | 0.003 | 0.213 |
| 休闲娱乐业 | r | 0.965** | 0.714 |
| 点评热度 | Sig. | 0.000 | 0.071 |
| 酒店业点 | r | 0.260 | -0.232 |
| 评热度 | Sig. | 0.573 | 0.617 |
| 美食业点 | r | 0.942** | 0.872* |
| 评热度 | Sig. | 0.002 | 0.011 |
注:*、**分别表示在0.05、0.01水平(双侧)上显著相关。 |
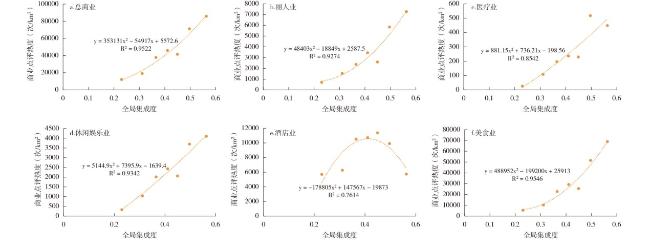
图4 全局集成度与商业点评热度散点图Fig.4 Scatter plots of global integration value and the number of comment |
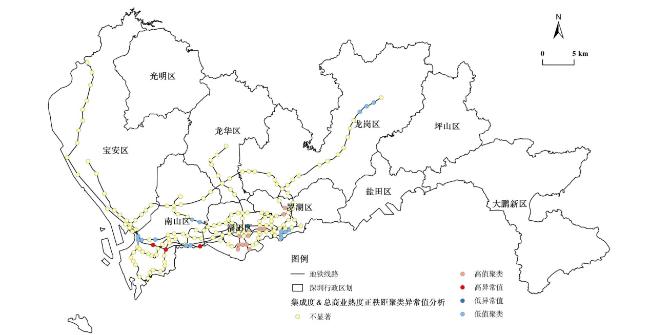
图6 全局集成度与商业活力关联效果的集聚和异常值分布Fig.6 Cluster and outlier distribution of correlation effects of global integration value and commercial vitality |
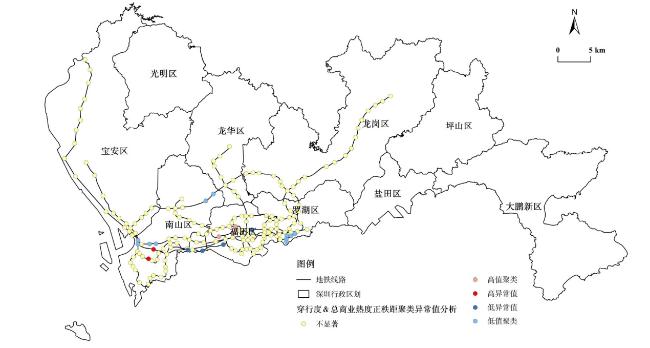
图7 全局穿行度与商业活力关联效果的集聚和异常值分布Fig.7 Cluster and outlier distribution of correlation effects of global choice value and commercial vitality |
表2 关联效果优劣显著的典型站点指标统计Tab.2 Index statistics of typical sites with significantly excellent and poor correlation effect |
| 站点编号 | 高低值显著 典型站点 | 集成度秩 | 穿行度秩 | 总商业热度秩 | 集成度&总商 业热度正秩距 | 显著类型 | 穿行度&总商 业热度正秩距 | 显著类型 |
|---|---|---|---|---|---|---|---|---|
| 1 | 益田 | 129 | 1 | 123 | 145 | 高值聚类 | 47 | 不显著 |
| 2 | 福田口岸 | 104 | 1 | 115 | 140 | 高值聚类 | 55 | 不显著 |
| 3 | 石厦 | 157 | 86 | 137 | 131 | 高值聚类 | 118 | 不显著 |
| 4 | 福民 | 137 | 82 | 139 | 149 | 高值聚类 | 112 | 不显著 |
| 5 | 皇岗村 | 130 | 36 | 152 | 129 | 高值聚类 | 53 | 不显著 |
| 6 | 岗厦 | 158 | 92 | 162 | 147 | 高值聚类 | 99 | 不显著 |
| 7 | 购物公园 | 175 | 132 | 179 | 147 | 高值聚类 | 122 | 不显著 |
| 8 | 水贝 | 68 | 163 | 73 | 146 | 高值聚类 | 79 | 不显著 |
| 9 | 洪湖 | 79 | 62 | 63 | 135 | 高值聚类 | 168 | 不显著 |
| 10 | 华强北 | 167 | 146 | 172 | 146 | 高值聚类 | 143 | 不显著 |
| 11 | 燕南 | 155 | 119 | 150 | 146 | 高值聚类 | 138 | 不显著 |
| 12 | 南山 | 171 | 176 | 149 | 129 | 高异常值 | 142 | 高异常值 |
| 13 | 后海 | 178 | 180 | 178 | 151 | 高异常值 | 167 | 不显著 |
| 14 | 深圳湾公园 | 144 | 13 | 143 | 150 | 高异常值 | 39 | 低异常值 |
| 15 | 景田 | 162 | 116 | 118 | 107 | 不显著 | 167 | 高值聚类 |
| 16 | 香梅 | 169 | 93 | 104 | 86 | 不显著 | 158 | 高值聚类 |
| 17 | 农林 | 166 | 129 | 125 | 110 | 不显著 | 165 | 高值聚类 |
| 18 | 荔林 | 24 | 49 | 51 | 124 | 不显著 | 167 | 高异常值 |
| 19 | 塘朗 | 92 | 140 | 20 | 79 | 不显著 | 49 | 低值聚类 |
| 20 | 长岭陂 | 102 | 141 | 1 | 50 | 不显著 | 29 | 低值聚类 |
| 21 | 下沙 | 160 | 18 | 168 | 143 | 不显著 | 19 | 低异常值 |
| 22 | 大新 | 88 | 48 | 155 | 84 | 不显著 | 62 | 低值聚类 |
| 23 | 前海湾 | 159 | 179 | 10 | 2 | 低值聚类 | 0 | 低值聚类 |
| 24 | 桂湾 | 118 | 157 | 17 | 50 | 低值聚类 | 29 | 低值聚类 |
| 25 | 桃园 | 67 | 35 | 159 | 59 | 低值聚类 | 45 | 低值聚类 |
| 26 | 鲤鱼门 | 121 | 68 | 23 | 53 | 低值聚类 | 124 | 不显著 |
| 27 | 人民南 | 49 | 49 | 174 | 26 | 低值聚类 | 44 | 低值聚类 |
| 28 | 国贸 | 85 | 23 | 182 | 54 | 低值聚类 | 10 | 低值聚类 |
| 29 | 罗湖 | 60 | 1 | 161 | 50 | 低值聚类 | 9 | 低值聚类 |
| 30 | 向西村 | 36 | 23 | 176 | 11 | 低值聚类 | 16 | 低值聚类 |
| 31 | 文锦 | 26 | 1 | 148 | 29 | 低值聚类 | 22 | 低值聚类 |
| 32 | 龙城广场 | 3 | 49 | 105 | 49 | 低值聚类 | 113 | 不显著 |
| 33 | 南联 | 2 | 23 | 107 | 46 | 低值聚类 | 85 | 不显著 |
| 34 | 吉祥 | 4 | 75 | 110 | 45 | 低值聚类 | 134 | 不显著 |
| 35 | 深云 | 131 | 108 | 5 | 25 | 低值聚类 | 66 | 不显著 |
| 36 | 桃源村 | 111 | 96 | 21 | 61 | 低值聚类 | 94 | 不显著 |
| 37 | 深湾 | 147 | 14 | 6 | 10 | 低值聚类 | 161 | 不显著 |
| 38 | 红树湾南站 | 180 | 181 | 29 | 0 | 低值聚类 | 17 | 低异常值 |
| 39 | 莲花村 | 177 | 174 | 46 | 20 | 低异常值 | 41 | 低异常值 |
| [1] |
姚巧爱, 宫同伟, 史津. 基于大众点评数据的城市轨道交通与商业设施耦合发展:以天津市为例[J]. 天津城建大学学报, 2019, 25(4):239-245.
|
| [2] |
何建华, 曹振琴, 李纯. 武汉市地铁可达性与餐饮网点的空间耦合性研究[J]. 测绘与空间地理信息, 2018, 41(2):10-13.
|
| [3] |
|
| [4] |
傅搏峰, 吴娇蓉, 陈小鸿. 空间句法及其在城市交通研究领域的应用[J]. 国际城市规划, 2009, 23(1):79-83.
|
| [5] |
蒙小英, 李春蕾, 杨子莹. 生态语境下交通廊道对城市空间割裂程度研究模型的建构[J]. 上海城市规划, 2019(1):27-32.
|
| [6] |
谢志祥, 任世鑫, 刘静玉, 等. 基于空间句法的郑州市地铁交通网络特征研究[J]. 河南大学学报:自然科学版, 2016, 46(4):392-399.
|
| [7] |
|
| [8] |
夏令军, 刘艳芳, 刘国炜. 中国地级城市餐饮业分布格局及影响因素:基于“大众点评网”数据的实证研究[J]. 经济地理, 2018, 38(5):133-141.
|
| [9] |
张红宇. 网络口碑对消费者在线行为的影响:基于“大众点评网”的实证研究[D]. 成都: 西南交通大学, 2014.
|
| [10] |
王圣音, 刘瑜, 陈泽东, 等. 大众点评数据下的城市场所范围感知方法[J]. 测绘学报, 2018, 47(8):1105-1113.
|
| [11] |
曲鹏. 历史地段更新中公共空间的使用后评价研究[D]. 天津: 天津大学, 2017.
|
| [12] |
申薇. 线下门店竞争对线上口碑的影响[D]. 北京: 北京外国语大学, 2019.
|
| [13] |
|
| [14] |
|
| [15] |
|
| [16] |
李文倩. 轨道交通建设对北京市商业空间布局的影响[J]. 都市快轨交通, 2008, 21(6):19-22.
|
| [17] |
蔡国田, 陈忠暖. 轨道交通对广州零售商业空间布局的影响[J]. 现代城市研究, 2004(4):65-67.
|
| [18] |
刘斯乔. 轨道交通对零售商业空间布局影响分析[J]. 商业经济研究, 2020(6):30-32.
|
| [19] |
郑文含. 不同类型轨道交通站点地区开发强度探讨[J]. 城市发展研究, 2008(S1):93-95.
|
| [20] |
|
| [21] |
马归民, 严建伟, 杨希. 基于轨道交通站点协同开发的地下商业空间活力研究:天津市津汇广场地下商业空间分析[J]. 现代城市研究, 2016(8):100-105.
|
| [22] |
方向阳, 陈忠暖. 城市地铁站口零售商业集聚类型划分的探讨:以广州为例[J]. 经济地理, 2005, 25(4):525-527,537.
|
| [23] |
黄晓冰, 陈忠暖. 基于信息熵的地铁站点商圈零售业种结构的研究:以广州15个地铁站点商圈为例[J]. 经济地理, 2014, 34(3):38-44.
|
| [24] |
盛强, 刘星. 虚拟网络与真实交通系统中的超链接机制:以重庆地铁站点周边餐饮功能的空间句法分析为例[J]. 西部人居环境学刊, 2017, 32(1):1-8.
|
| [25] |
王宇渠, 陈忠暖, 覃水娇. 地铁站点可达性、客流与站点商圈零售商业结构关系研究:以广州市为例[J]. 人文地理, 2015, 30(4):66-71.
|
| [26] |
姚龙华. 构筑通向未来的城市交通大格局[N/OL]. 深圳特区报,2019-12-11(A02).
|
| [27] |
林雄斌, 徐媛, 董美璇, 等. 大都市公交导向开发的规划与政策:深圳与西雅图的对比[J]. 国际城市规划, 2020, 35(2):122-128.
|
| [28] |
周群, 马林兵, 陈凯, 等. 一种改进的基于空间句法的地铁可达性演变研究:以广佛地铁为例[J]. 经济地理, 2015, 35(3):100-107.
|
| [29] |
张愚, 王建国. 再论“空间句法”[J]. 建筑师, 2004(6):33-44.
|
| [30] |
|
| [31] |
深圳市人民政府. 深圳城市总体规划(2010-2020)[R]. 2008.
|
| [32] |
国家发展改革委. 关于调整深圳市城市轨道交通第四期建设规划方案的批复(发改基础[2020]484号)[R]. 2020.
|
/
| 〈 |
|
〉 |

