
Trade Embodied Carbon Emissions and Its Effects of China:Take the Yangtze River Economic Belt as an Example
Received date: 2020-04-08
Revised date: 2020-12-21
Online published: 2025-04-30
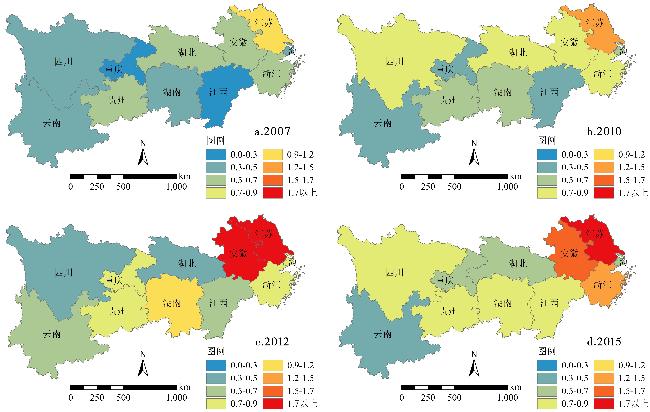
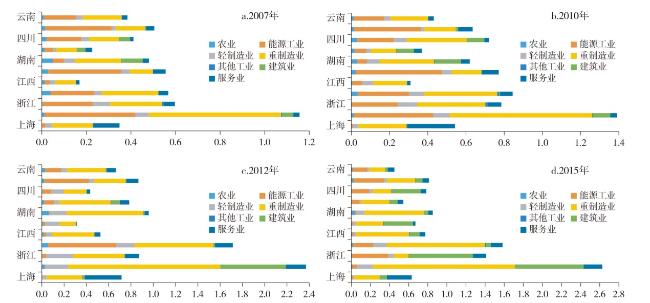
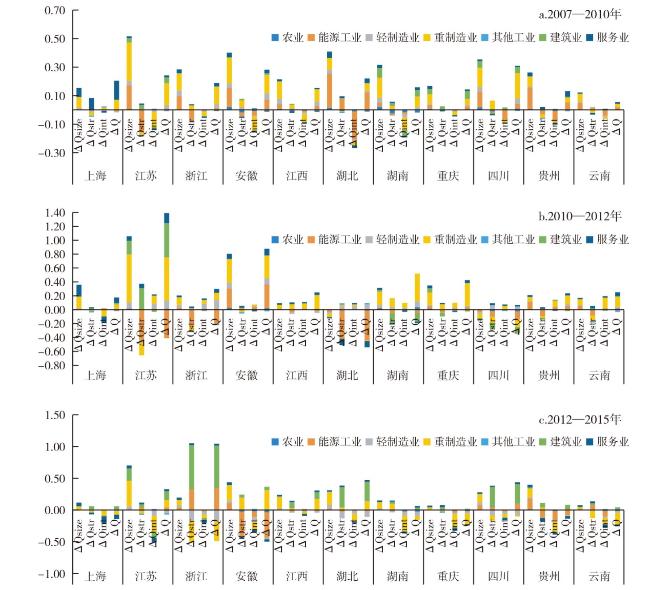
Clarifying the embodied carbon emissions of regional trade in the Yangtze River Economic Belt is of great significance for the formulation of fair and effective carbon emission reduction programs, it can measure embodied carbon emissions more accurately by the gross trade accounting system. Based on the above, this article applies the multi-region input-output model to calculate the embodied carbon emissions of the 11 provinces and cities in the Yangtze River Economic Belt in 2007,2010,2012 and 2015,and analyzes the influencing factors by the means of the logarithmic mean divisia index (LMDI). The results showed that: 1) Overall,the embodied carbon emissions was rising obviously in the Yangtze River Economic Belt; at the provicial and prefectural level,the embodied carbon emissions showed a increasing trend from the west to the east. It showed the upward trend in most provinces and cities from 2007 to 2012 and the downward trend in 2012-2015,or the growth rate began to slow down significantly in 2012-2015. 2) Based on the sub-sector,it showed that the proportion of embodied carbon emissions relatively transferred from the heavy manufacturing and energy industry sectors,and most sectors' embodied carbon emission showed an upward trend. Since 2012,many sectors have begun to reduce their embodied carbon emissions,especially in the industrial sectors. 3) Among the factors affecting the embodied carbon emission in the Yangtze River Economic Belt,the scale effect has always been the main factor leading to the increase in the amount of embodied carbon emissions; the structural effect experienced two changes: from positive effects to negative effects,from negative effects to positive effects; the intensity effect transformed from negative effects to positive effects and then to negative effects,sub-sector results are roughly the same as overall results.
HUANG Heping , YI Mengting , CAO Junwen , ZOU Yanfeng , HUANG Xianming . Trade Embodied Carbon Emissions and Its Effects of China:Take the Yangtze River Economic Belt as an Example[J]. Economic geography, 2021 , 41(3) : 49 -57 . DOI: 10.15957/j.cnki.jjdl.2021.03.005
表1 总调出分解部分的具体含义Tab.1 The meaning of the decomposition part |
| 分解内容(增加值向量) | 组成部分 | 具体含义 | ||
|---|---|---|---|---|
| DVA | DVA_FIN | T1 | 被外地吸收的本地增加值 | 最终品出口的本地增加值 |
| DVA_INT | T2 | 被进口地区直接吸收的中间品出口 | ||
| DVA_INTREX | T3+T4+T5 | 被进口地区直接生产向第三方地区所吸收的中间品出口 | ||
| RDV | T6+T7+T8 | 返回并被本地吸收的本地增加值 | ||
| FVA | MVA | T11+T12 | 外地增加值 | 出口隐含的进口地区增加值 |
| OVA | T14+T15 | 出口隐含的其他地区增加值 | ||
| PDC | DDC | T9+T10 | 纯重复计算部分 | 来自本地账户的纯重复计算 |
| FDC | T13+T16 | 来自外地的纯重复计算 | ||
表2 部门归并结果Tab.2 Departmental merger |
| 7个部门 | 对应投入产出表中30个部门 |
|---|---|
| 农业 | 农林牧渔业 |
| 能源工业 | 煤炭开采和洗选业,石油和天然气开采业,金属矿采选业,非金属矿及其他矿采选业,石油加工、炼焦及核燃料加工业,电力、热力的生产和供应业,燃气及水的生产与供应业 |
| 轻制造业 | 食品制造及烟草加工业,纺织业,纺织服装鞋帽皮革羽绒及其制品业,木材加工及家具制造业,造纸印刷及文教体育用品制造业 |
| 重制造业 | 化学工业,非金属矿物制品业,金属冶炼及压延加工业,金属制品业,通用、专用设备制造业,交通运输设备制造业,电气机械及器材制造业,通信设备、计算机及其他电子设备制造业,仪器仪表及文化办公用机械制造业 |
| 其他工业 | 其他制造业 |
| 建筑业 | 建筑业 |
| 服务业 | 交通运输及仓储业,批发零售业,住宿餐饮业,租赁和商业服务业,研究与试验发展业,其他服务业 |
表3 长江经济带各省市调出隐含碳排放量Tab.3 Embodied carbon emissions in the Yangtze River Economic Belt |
| 2007 | 2010 | 2012 | 2015 | ||||||||
|---|---|---|---|---|---|---|---|---|---|---|---|
| 碳排放(×108t) | 比例(%) | 碳排放(×108t) | 比例(%) | 碳排放(×108t) | 比例(%) | 碳排放(×108t) | 比例(%) | ||||
| 上海 | 0.35 | 6.46 | 0.54 | 7.32 | 0.72 | 7.00 | 0.63 | 5.67 | |||
| 江苏 | 1.16 | 21.41 | 1.39 | 18.74 | 2.37 | 23.20 | 2.63 | 23.58 | |||
| 浙江 | 0.60 | 11.06 | 0.78 | 10.58 | 0.87 | 8.55 | 1.41 | 12.67 | |||
| 安徽 | 0.57 | 10.51 | 0.84 | 11.38 | 1.71 | 16.78 | 1.58 | 14.21 | |||
| 江西 | 0.17 | 3.13 | 0.31 | 4.17 | 0.53 | 5.15 | 0.77 | 6.95 | |||
| 湖北 | 0.56 | 10.29 | 0.77 | 10.40 | 0.31 | 3.02 | 0.67 | 6.02 | |||
| 湖南 | 0.48 | 8.90 | 0.62 | 8.36 | 0.96 | 9.39 | 0.85 | 7.65 | |||
| 重庆 | 0.23 | 4.18 | 0.37 | 4.97 | 0.78 | 7.67 | 0.54 | 4.88 | |||
| 四川 | 0.41 | 7.61 | 0.72 | 9.71 | 0.43 | 4.24 | 0.78 | 7.04 | |||
| 贵州 | 0.50 | 9.35 | 0.63 | 8.56 | 0.87 | 8.48 | 0.81 | 7.29 | |||
| 云南 | 0.38 | 7.12 | 0.43 | 5.82 | 0.67 | 6.51 | 0.45 | 4.05 | |||
| 总计 | 5.40 | 100.00 | 7.42 | 100.00 | 10.22 | 100.00 | 11.14 | 100.00 | |||
表4 长江经济带各省市调出隐含碳排放变化影响效应分解 (单位:108 t)Tab.4 Decomposition of embodied carbon emissions in the Yangtze River Economic Belt (Unit:108 t) |
| 2007—2010 | 2010—2012 | 2012—2015 | ||||||||||||
|---|---|---|---|---|---|---|---|---|---|---|---|---|---|---|
| ΔQsize | ΔQstr | ΔQint | ΔQ | ΔQsize | ΔQstr | ΔQint | ΔQ | ΔQsize | ΔQstr | ΔQint | ΔQ | |||
| 上海 | 0.15 | 0.04 | -0.00 | 0.19 | 0.36 | -0.00 | -0.18 | 0.17 | 0.12 | 0.01 | -0.21 | -0.08 | ||
| 江苏 | 0.52 | -0.14 | -0.14 | 0.23 | 1.06 | -0.28 | 0.20 | 0.98 | 0.70 | 0.06 | -0.50 | 0.26 | ||
| 浙江 | 0.28 | -0.04 | -0.06 | 0.19 | 0.20 | -0.26 | 0.15 | 0.09 | 0.20 | 0.55 | -0.21 | 0.54 | ||
| 安徽 | 0.40 | 0.02 | -0.15 | 0.28 | 0.80 | 0.02 | 0.05 | 0.87 | 0.44 | -0.22 | -0.35 | -0.13 | ||
| 江西 | 0.21 | 0.02 | -0.10 | 0.14 | 0.08 | 0.04 | 0.09 | 0.22 | 0.24 | 0.09 | -0.08 | 0.25 | ||
| 湖北 | 0.41 | 0.07 | -0.27 | 0.22 | -0.11 | -0.43 | 0.08 | -0.46 | 0.29 | 0.25 | -0.18 | 0.36 | ||
| 湖南 | 0.32 | 0.02 | -0.19 | 0.14 | 0.30 | -0.04 | 0.08 | 0.34 | 0.13 | 0.11 | -0.35 | -0.11 | ||
| 重庆 | 0.17 | 0.02 | -0.05 | 0.14 | 0.35 | -0.02 | 0.08 | 0.42 | 0.05 | 0.04 | -0.33 | -0.24 | ||
| 四川 | 0.35 | 0.03 | -0.08 | 0.31 | -0.14 | -0.21 | 0.06 | -0.29 | 0.28 | 0.21 | -0.14 | 0.35 | ||
| 贵州 | 0.26 | -0.04 | -0.10 | 0.13 | 0.21 | -0.09 | 0.11 | 0.23 | 0.40 | -0.06 | -0.39 | -0.05 | ||
| 云南 | 0.12 | -0.01 | -0.06 | 0.05 | 0.17 | -0.11 | 0.18 | 0.23 | 0.06 | 0.01 | -0.28 | -0.21 | ||
| [1] |
王安静, 孟渤, 冯宗宪, 等. 增加值贸易视角下的中国区域间碳排放转移研究[J]. 西安交通大学学报:社会科学版, 2020, 40(2):85-94.
|
| [2] |
黄蕊, 王铮, 钟章奇, 等. 区域贸易隐含碳排放和SO2排放的投入产出分析——以江苏为例[J]. 自然资源学报, 2017, 32(5):854-863.
|
| [3] |
黄国华, 刘传江, 赵晓梦. 长江经济带碳排放现状及未来碳减排[J]. 长江流域资源与环境, 2016, 25(4):638-644.
|
| [4] |
李建豹, 黄贤金. 基于空间面板模型的碳排放影响因素分析——以长江经济带为例[J]. 长江流域资源与环境, 2015, 24(10):1665-1671.
|
| [5] |
李毅, 胡宗义, 刘亦文, 等. 碳强度约束政策对中国城市空气质量的影响[J]. 经济地理, 2019, 39(8):21-28.
|
| [6] |
关伟, 金一. 中国能源利用、经济增长演进对生态环境的脉冲响应[J]. 经济地理, 2020, 40(2):31-40.
|
| [7] |
黄和平, 乔学忠, 张瑾, 等. 绿色发展背景下区域旅游业碳排放时空分异与影响因素研究——以长江经济带为例[J]. 经济地理, 2019, 39(11):214-224.
|
| [8] |
刘强, 庄幸, 姜克隽, 等. 中国出口贸易中的载能量及碳排放量分析[J]. 中国工业经济, 2008(8):46-55.
|
| [9] |
|
| [10] |
袁欢. 我国制造业贸易隐含碳测算及其影响因素分析[D]. 重庆: 重庆工商大学, 2019.
|
| [11] |
齐晔, 李惠民, 徐明. 中国进出口贸易中的隐含碳估算[J]. 中国人口·资源与环境, 2008(3):8-13.
|
| [12] |
|
| [13] |
鲁倩倩. 多区域贸易隐含碳的时序分析及碳排放责任分担比较——基于MRIO模型视角[J]. 价值工程, 2017, 36(18):7-12.
|
| [14] |
|
| [15] |
李艳梅, 牛苗苗, 张红丽. 京津冀区域内增加值贸易的经济收益和隐含碳排放比较[J]. 资源科学, 2019, 41(9):1619-1629.
|
| [16] |
|
| [17] |
|
| [18] |
潘安, 吴肖丽. 全球价值链分工下的中日贸易隐含碳排放研究[J]. 现代日本经济, 2018, 37(2):40-52.
|
| [19] |
潘安. 全球价值链视角下的中美贸易隐含碳研究[J]. 统计研究, 2018, 35(1):53-64.
|
| [20] |
杨果, 叶家柏. 中国真的承担了更少的碳减排任务吗?[J]. 管理世界, 2018, 34(11):176-177.
|
| [21] |
钱志权, 杨来科. 东亚垂直分工对中国对外贸易隐含碳的影响研究——基于MRIO-SDA方法跨期比较[J]. 资源科学, 2016, 38(9):1801-1809.
|
| [22] |
江洪. 金砖国家对外贸易隐含碳的测算与比较——基于投入产出模型和结构分解的实证分析[J]. 资源科学, 2016, 38(12):2326-2337.
|
| [23] |
|
| [24] |
|
| [25] |
|
| [26] |
郭朝先. 中国碳排放因素分解:基于LMDI分解技术[J]. 中国人口·资源与环境, 2010, 20(12):4-9.
|
| [27] |
张根能, 吕磊磊, 董伟婷. 中国进出口贸易隐含碳影响因素分解——考虑技术异质性的研究[J]. 生态经济, 2017, 33(9):14-20.
|
| [28] |
丁玉梅, 廖程胜, 吴贤荣, 等. 中国农产品贸易隐含碳排放测度与时空分析[J]. 华中农业大学学报:社会科学版, 2017(1):44-54.
|
| [29] |
杜运苏, 孙辉煌. 中国出口贸易隐含碳排放增长因素分析:基于LMDI[J]. 世界经济研究, 2012(11):44-49.
|
| [30] |
赵玉焕, 王淞. 基于技术异质性的中日贸易隐含碳测算及分析[J]. 北京理工大学学报:社会科学版, 2014, 16(1):12-18.
|
/
| 〈 |
|
〉 |