
Relationship Type and Regional Pattern Between Grain Production and Economic Development in Northeast China
Received date: 2020-08-16
Revised date: 2020-12-12
Online published: 2025-04-30
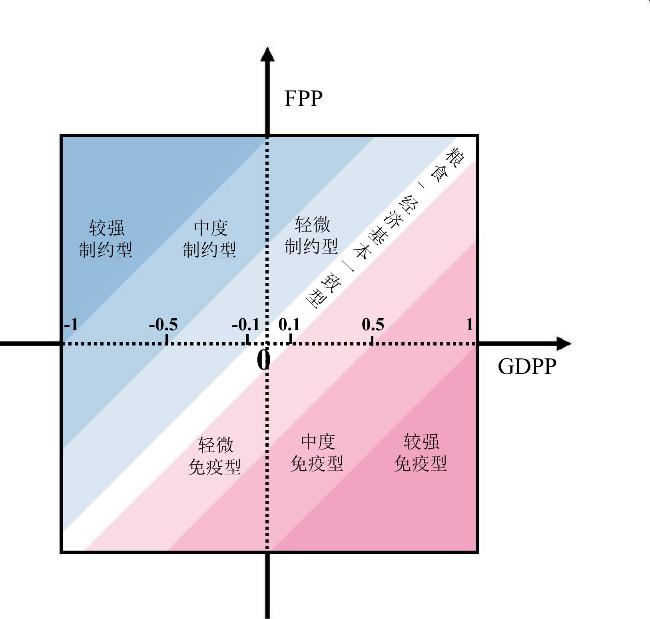
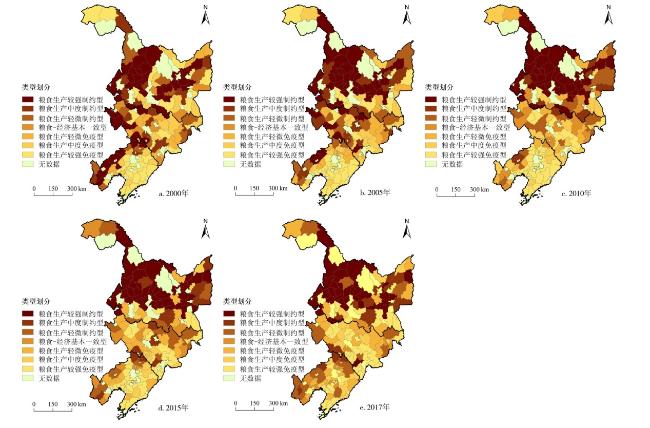
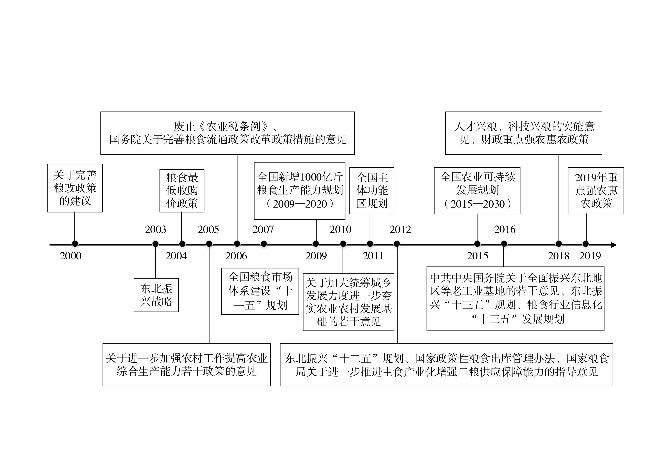
Northeast China is an important grain production base. Exploring the relationship type and regional pattern of grain production and economic development in Northeast China is of great significance for ensuring national grain security and realizing regional sustainable development. Based on the county-level panel data from 2000 to 2017,this paper explores the relationship between grain production and economic development in Northeast China, and analyzes their relationship types,regional pattern characteristics and influencing factors by the means of location quotient,panel regression model and improved quadrant chart method. Results are shown as follows: 1) The comparative advantage of grain production coexists with the backwardness of economic development in Northeast China,and grain production obviously restricts regional economic development on the whole. 2) The Northeast China is divided into 7 types,the main types are the stronger restricts area of grain production and the stronger immune area of grain production,which reflects obviously inharmony between grain production and economic development. 3) It presents significant inter-provincial difference on the spatio-temporal development characteristics of relationship between grain production and economic development,and economic development of Heilongjiang Province is more vulnerable to be restricted by grain production,followed by Jilin Province and Liaoning Province. In particularly,the restricted area of gain production gradually shifts to the cluster layout dominated by Heilongjiang Province and shows the trend of northward movement. 4) At the macro level,the relationship between grain production and economic development is influenced by national policies and market environment. At the micro level,grain production indirectly inhibits economic development by weakening material capital input,industrial structure and social consumption. It is necessary to strengthen the policy tilt of grain production in Northeast China and fully arouse the enthusiasm of farmers in grain growing. It puts forwards strengthening inter-provincial grain policy linkage and giving full play to the allocation of grain production and sales by the market. The Northeast region should put grain security in a prominent position and consolidate the basic position of agriculture. Focusing on the integrated development of primary,secondary and tertiary industries around grain production,and comprehensively promoting the quality and efficiency of the grain industry are both the effective measures.
LIU Jie , YANG Qingshan , JIANG Xiaojun , LIU Jian . Relationship Type and Regional Pattern Between Grain Production and Economic Development in Northeast China[J]. Economic geography, 2021 , 41(3) : 39 -48 . DOI: 10.15957/j.cnki.jjdl.2021.03.004
表1 粮食生产与经济发展关系检验模型变量描述说明Tab.1 Description of variables in the test model of the relationship between grain production and economic development |
| 变量符号 | 变量名称 | 指标内涵说明 | 指标预期属性 |
|---|---|---|---|
| FP | 粮食生产水平 | 粮食产值占GDP的比重 | - |
| Inv | 物质资本投入 | 固定资产投资占GDP比重 | + |
| Ind | 产业结构 | 第二产业产值占GDP比重 | + |
| Cons | 社会消费水平 | 社会消费品零售额占GDP比重 | + |
| Edu | 人力资本投入 | 普通中学在校生数占总人口比重 | + |
表2 粮食生产与经济发展关系面板数据回归结果 (2000—2017年)Tab.2 Regression results of panel data on the relationship between grain production and economic development (2000-2017) |
| 变量 | FP | Inv | Ind | Cons | Edu | 常数项 | 调整R2 | F检验 | Prob |
|---|---|---|---|---|---|---|---|---|---|
| 系数 | -0.116*** | 0.020** | 0.101*** | 0.131*** | 0.023** | 3.503*** | 0.904 | 145.366 | (0.00)*** |
注:“*”“**”“***”分别表示10%、5%、1%的显著性水平。 |
表3 东北地区粮食生产与经济发展关系类型划分 (2000—2017年)Tab.3 Types of relationship between grain production and economic development in Northeast China (2000-2017) |
| 年份 | 类型 | Ⅰ | Ⅱ | Ⅲ | Ⅳ | Ⅴ | Ⅵ | Ⅶ |
|---|---|---|---|---|---|---|---|---|
| 2000 | 县(市)数量(个) | 45 | 17 | 12 | 7 | 13 | 15 | 39 |
| 县(市)总量占比(%) | 30.41 | 11.49 | 8.11 | 4.73 | 8.78 | 10.14 | 26.35 | |
| 粮食生产水平均值 | 0.37 | 0.25 | 0.20 | 0.24 | 0.20 | 0.19 | 0.10 | |
| 人均GDP均值(元) | 3 315 | 4 119 | 4 033 | 5 824 | 5 844 | 6 662 | 9 160 | |
| 2005 | 县(市)数量(个) | 42 | 18 | 17 | 1 | 14 | 20 | 36 |
| 县(市)总量占比(%) | 28.38 | 12.16 | 11.49 | 0.68 | 9.46 | 13.51 | 24.32 | |
| 粮食生产水平均值 | 0.44 | 0.29 | 0.25 | 0.17 | 0.17 | 0.14 | 0.09 | |
| 人均GDP均值(元) | 5 379 | 7 143 | 8 204 | 6 598 | 8 677 | 9 736 | 1 6844 | |
| 2010 | 县(市)数量(个) | 38 | 8 | 16 | 16 | 13 | 19 | 38 |
| 县(市)总量占比(%) | 25.68 | 5.41 | 10.81 | 10.81 | 8.78 | 12.84 | 25.68 | |
| 粮食生产水平均值 | 0.48 | 0.26 | 0.21 | 0.16 | 0.11 | 0.11 | 0.06 | |
| 人均GDP均值(元) | 12 964 | 18 169 | 20 754 | 22 026 | 20 945 | 28 848 | 46 565 | |
| 2015 | 县(市)数量(个) | 38 | 13 | 15 | 9 | 21 | 12 | 40 |
| 县(市)总量占比(%) | 25.68 | 8.78 | 10.14 | 6.08 | 14.19 | 8.11 | 27.03 | |
| 粮食生产水平均值 | 0.48 | 0.26 | 0.19 | 0.16 | 0.16 | 0.12 | 0.08 | |
| 人均GDP均值(元) | 23 037 | 29 295 | 29 452 | 32 014 | 38 134 | 44 134 | 66 696 | |
| 2017 | 县(市)数量(个) | 33 | 17 | 19 | 8 | 23 | 13 | 35 |
| 县(市)总量占比(%) | 22.30 | 11.49 | 12.84 | 5.41 | 15.54 | 8.78 | 23.65 | |
| 粮食生产水平均值 | 0.44 | 0.27 | 0.15 | 0.14 | 0.15 | 0.11 | 0.07 | |
| 人均GDP均值(元) | 2 2551 | 28 220 | 21 384 | 25 690 | 34 524 | 41 542 | 61 625 |
表4 东北地区粮食生产与经济发展关系类型分省状况(2000—2017年)Tab.4 Relationship type between grain production and economic development in Northeast China at the provincial level(2000-2017) |
| 年份 | 省份 | Ⅰ型县(市) 数量(个) | Ⅱ型县(市) 数量(个) | Ⅲ型县(市) 数量(个) | 粮食生产制约型 县(市)总量(个) | 粮食生产制约型 县(市)占比(%) | 全省县(市) 总量占比(%) |
|---|---|---|---|---|---|---|---|
| 2000 | 黑龙江省 | 30 | 7 | 4 | 41 | 55.41 | 64.06 |
| 吉林省 | 6 | 8 | 4 | 18 | 24.32 | 45.00 | |
| 辽宁省 | 9 | 2 | 4 | 15 | 20.27 | 34.09 | |
| 2005 | 黑龙江省 | 34 | 8 | 6 | 48 | 62.34 | 75.00 |
| 吉林省 | 6 | 8 | 6 | 20 | 25.97 | 50.00 | |
| 辽宁省 | 2 | 2 | 5 | 9 | 11.69 | 20.45 | |
| 2010 | 黑龙江省 | 38 | 6 | 5 | 49 | 79.03 | 76.56 |
| 吉林省 | 0 | 1 | 8 | 9 | 14.52 | 22.50 | |
| 辽宁省 | 0 | 1 | 3 | 4 | 6.45 | 9.09 | |
| 2015 | 黑龙江省 | 38 | 6 | 4 | 48 | 72.73 | 75.00 |
| 吉林省 | 0 | 4 | 6 | 10 | 15.15 | 25.00 | |
| 辽宁省 | 0 | 3 | 5 | 8 | 12.12 | 18.18 | |
| 2017 | 黑龙江省 | 32 | 11 | 3 | 46 | 66.67 | 71.88 |
| 吉林省 | 1 | 2 | 5 | 8 | 11.59 | 20.00 | |
| 辽宁省 | 0 | 4 | 11 | 15 | 21.74 | 34.09 |
表5 东北地区粮食生产大县粮食生产与经济发展关系状况(2000—2017年)Tab.5 Relationship between grain production and economic development in major grain-production counties in Northeast China(2000-2017) |
| 类型 | 2000 | 2005 | 2010 | 2015 | 2017 | ||||||||||||||
|---|---|---|---|---|---|---|---|---|---|---|---|---|---|---|---|---|---|---|---|
| 县(市)数量(个) | 同类型占比(%) | 产粮大县占比(%) | 县(市)数量(个) | 同类型占比(%) | 产粮大县占比(%) | 县(市)数量(个) | 同类型占比(%) | 产粮大县占比(%) | 县(市)数量(个) | 同类型占比(%) | 产粮大县占比(%) | 县(市)数量(个) | 同类型占比(%) | 产粮大县占比(%) | |||||
| 制约型 | 46 | 62.16 | 54.12 | 49 | 63.64 | 57.65 | 37 | 59.68 | 43.53 | 37 | 56.06 | 43.53 | 39 | 56.52 | 45.88 | ||||
| 基本一致型 | 6 | 85.71 | 7.06 | 0 | 0 | 0 | 10 | 62.50 | 11.76 | 7 | 77.78 | 8.24 | 5 | 62.50 | 5.88 | ||||
| 免疫型 | 33 | 49.25 | 38.82 | 36 | 51.43 | 42.35 | 38 | 54.29 | 44.71 | 41 | 56.16 | 48.24 | 41 | 57.75 | 48.24 | ||||
表6 东北地区粮食生产与经济发展关系因素分析结果(2000—2017年)Tab.6 Results of factor analysis of the relationship between grain production and economic development in Northeast China (2000-2017) |
| 变量 | FPD | 常数项 | 调整R2 | F检验 |
|---|---|---|---|---|
| Inv | -0.017* | 3.029*** | 0.784 | 61.565 |
| Ind | -0.195*** | 3.664*** | 0.799 | 67.443 |
| Cons | -0.033*** | 2.208*** | 0.790 | 64.041 |
| Edu | 0.040** | 2.858*** | 0.784 | 61.678 |
| [1] |
姜长云, 王一杰. 新中国成立70年来我国推进粮食安全的成就、经验与思考[J]. 农业经济问题, 2019(10):10-23.
|
| [2] |
孙晶晶, 赵凯, 牛影影. 三大粮食功能区社会经济发展水平评价及其差异分析——基于粮食主产区利益补偿视角[J]. 农业现代化研究, 2017, 38(4):581-588.
|
| [3] |
刘影, 肖池伟, 李鹏, 等. 1978—2013年中国粮食主产区“粮—经”关系分析[J]. 资源科学, 2015, 37(10):1891-1901.
|
| [4] |
杨博, 唐彬, 杨柏欢. 区域经济发展与粮食生产耦合分析——以榆林市为例[J]. 中国农业资源与区划, 2016, 37(11):99-104.
|
| [5] |
高军波, 谢文全, 韩勇, 等. 1990—2013年河南省县域人口、经济和粮食生产重心的迁移轨迹与耦合特征——兼议与社会剥夺的关系[J]. 地理科学, 2018, 38(6):919-926.
|
| [6] |
邵留长, 乔家君. 河南省经济发展与粮食生产耦合协调分析[J]. 农业现代化研究, 2016, 37(2):230-237.
|
| [7] |
杨慧, 渠丽萍, 杨保战, 等. 粮食与经济重心迁移路径及空间耦合关系分析——以湖北省粮食主产县为例[J]. 中国农业资源与区划, 2018, 39(12):40-47.
|
| [8] |
杨朝丹, 姜会明, 王寒冰. 吉林省粮食大县经济发展差异及成因分析[J]. 地理科学, 2014, 34(7):825-830.
|
| [9] |
顾莉丽, 郭庆海. 中国粮食主产区的演变与发展研究[J]. 农业经济问题, 2011, 18(8):4-9.
|
| [10] |
鲁莎莎, 刘彦随, 关兴良. 粮食主产区农村经济发展态势及其政策影响分析[J]. 经济地理, 2011, 31(3):483-488.
|
| [11] |
陈璐, 胡月, 韩学平, 等. 国家粮食安全中主产区粮食生产及其贡献的量化对比分析[J]. 中国土地科学, 2017(9):36-44.
|
| [12] |
王莉, 楚尔鸣. 基于粮食安全的区域强制分工与区际利益补偿[J]. 经济地理, 2018, 38(4):164-170.
|
| [13] |
马彪, 陈璐. 粮食主产区粮食生产与经济发展的“剪刀差”现象分析[J]. 农村经济, 2019(5):51-59.
|
| [14] |
鲍超, 方创琳. 长江流域耕地—粮食—人口复合系统的动态分析及调控途径[J]. 中国人口·资源与环境, 2007(2):115-120.
|
| [15] |
马彩虹, 赵先贵. 人口—耕地—粮食互动关系与区域可持续发展——以陕西省为例[J]. 干旱区资源与环境, 2006(2):50-54.
|
| [16] |
闫宇航, 岑云峰, 张鹏岩, 等. 基于SFA模型的河南省粮食产量时空变化及投入要素影响[J]. 中国农业资源与区划, 2020, 41(5):76-86.
|
| [17] |
姚成胜, 李政通, 易行. 中国粮食产量变化的驱动效应及其空间分异研究[J]. 中国人口·资源与环境, 2016, 26(9):72-81.
|
| [18] |
陈璐, 胡月, 韩学平, 等. 国家粮食安全中主产区粮食生产及其贡献的量化对比分析[J]. 中国土地科学, 2017, 31(9):34-42.
|
| [19] |
李祥云, 禹文颂, 陈珊. 公共教育支出与居民收入分配差距[J]. 财经问题研究, 2018(8):82-88.
|
| [20] |
干春晖, 郑若谷, 余典范. 中国产业结构变迁对经济增长和波动的影响[J]. 经济研究, 2011(5):4-16
|
| [21] |
蒋云飞, 罗守贵. 改革开放以来中国城镇居民消费结构变动及区域差异[J]. 经济地理, 2008, 28(3):415-418.
|
| [22] |
陈明星, 陆大道, 刘慧. 中国城市化与经济发展水平关系的省级格局[J]. 地理学报, 2010, 65(12):1443-1453.
|
| [23] |
余萍. 资源诅咒与传统农区企业家的形成——基于长垣县案例所构造的模型[J]. 经济经纬, 2015, 32(3):1-6.
|
| [24] |
丁声俊. 粮食大省“资源诅咒之忧”[J]. 黑龙江粮食, 2014(9):4-8.
|
| [25] |
倪洪兴. 开放条件下农产品价格形成机制与价格政策选择[J]. 中国粮食经济, 2017(6):18-26.
|
| [26] |
管卫华, 周静, 陆玉麒. 改革开放以来中国社会消费水平的区域格局变化[J]. 地理研究, 2012, 31(2):234-244.
|
/
| 〈 |
|
〉 |
