
Opening of HSR, Geographical Location and the Governance Effect of PE
Received date: 2020-03-19
Revised date: 2020-12-24
Online published: 2025-04-30
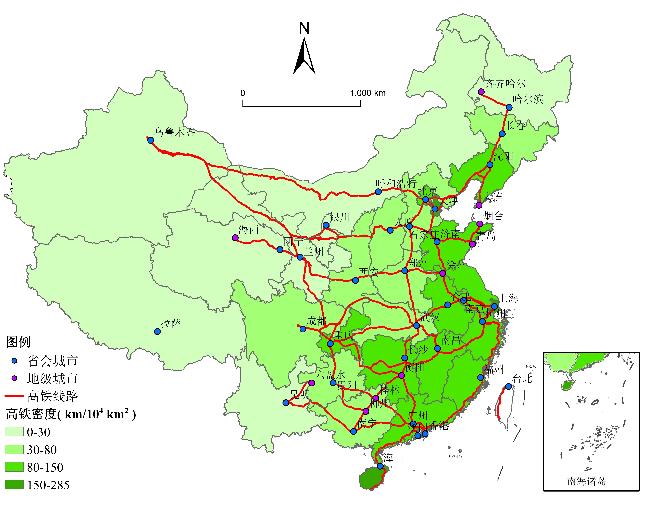
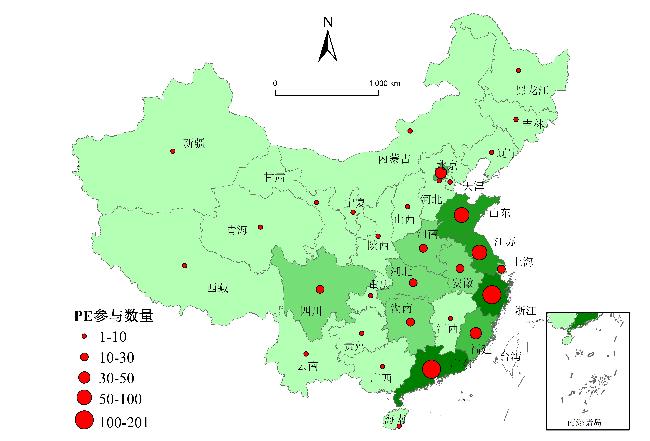
The existence of geographical segmentation makes it difficult for private equity investment to participate in the operation and management of the invested enterprises,and restrains the governance effect of private equity on the underpricing of initial public offering(IPO). The opening of high speed rail(HSR) can reduce the space-time distance,which is helpful to alleviate the inhibition of geographical location on private equity investment. This paper takes the small and medium-sized board listed companies in 2008-2018 as the research samples,collects and collates the data of private equity investment and high speed rail opening,and verifies the positive governance effect of private equity(PE) investment on the underpricing of IPO from the perspective of new economic geography. Firstly,this paper explores the impact of geographical location on the governance effect of private equity investment,and finds that private equity investment can only improve the underpricing of IPO in the eastern region,but can not play a governance role in the central and western regions. Secondly,based on the quasi natural experiment of the opening of high speed rail in the city where the enterprise is located,it's found that the opening of high speed rail in the central and western regions significantly improves the governance effect of private equity investment on the underpricing of IPO.
WANG Yuanyuan , PAN Pan , TANG Chunling . Opening of HSR, Geographical Location and the Governance Effect of PE[J]. Economic geography, 2021 , 41(3) : 144 -151 . DOI: 10.15957/j.cnki.jjdl.2021.03.015
表1 高铁开通与私募股权投资参与企业IPO的趋势变化Tab.1 Trend change of HSR and PE investment in IPO |
| 年份 | 东部地区 | 中部地区 | 西部地区 | ||||||
|---|---|---|---|---|---|---|---|---|---|
| IPO数量(家) | PE参与比率(%) | IPO数量(家) | PE参与比率(%) | IPO数量(家) | PE参与比率(%) | ||||
| 高铁发展初期 | 2004 | 29 | 78.571 | 4 | 75.000 | 5 | 60.000 | ||
| 2005 | 9 | 77.778 | 2 | 50.000 | 1 | 100.000 | |||
| 2006 | 42 | 86.487 | 5 | 40.000 | 4 | 75.000 | |||
| 2007 | 76 | 75.343 | 15 | 80.000 | 9 | 66.667 | |||
| 高铁快速发展期 | 2008 | 52 | 74.576 | 8 | 87.500 | 11 | 72.727 | ||
| 2009 | 69 | 74.627 | 11 | 90.909 | 10 | 70.000 | |||
| 2010 | 257 | 81.716 | 39 | 76.923 | 24 | 79.167 | |||
| 2011 | 191 | 79.630 | 39 | 87.180 | 12 | 83.333 | |||
| 2012 | 109 | 83.051 | 13 | 100.000 | 7 | 100.000 | |||
| 2014 | 67 | 81.333 | 8 | 100.000 | 6 | 100.000 | |||
| 2015 | 93 | 71.186 | 20 | 95.000 | 18 | 83.333 | |||
| 2016 | 96 | 78.378 | 12 | 83.333 | 16 | 87.500 | |||
| 2017 | 186 | 83.251 | 26 | 96.154 | 10 | 90.000 | |||
| 2018 | 33 | 66.667 | 6 | 100.000 | 9 | 100.000 | |||
表2 变量定义Tab.2 Definitions of variables |
| 变量名称 | 变量符号 | 变量定义 |
|---|---|---|
| IPO抑价 | Underpricing | 根据公式 |
| 私募股权投资 | PE | 当企业有私募股权投资者进入时取值为1,否则取值为0 |
| 高铁开通 | HSR | 企业所在城市开通高铁后的年份取值为1,否则取值为0 |
| 发行价格 | Offerprice | 企业IPO时的发行价格 |
| IPO周转率 | Turnover | 企业IPO首日周转率 |
| 发行规模 | Offerproceeds | 企业IPO发行规模并取自然对数 |
| 资产负债率 | Lev | 债务账面价值/资产账面价值 |
| 股权集中度 | Shrcr | 企业前三大股东持股比例之和 |
| 企业规模 | Size | 企业资产总额的自然对数 |
| 账面市值比 | B/M | 企业账面资产/企业市场价值 |
| 货币资金 | Cash | 企业货币资金/资产总额 |
| 托宾Q值 | TobinQ | (股权市值+净债务市值)/资产总额 |
| 竞争程度 | Hhi | 使用企业所在行业的赫芬达尔指数衡量 |
| 年份 | Year | 虚拟变量,属于该年时取值为1,否则为0 |
| 行业 | Industry | 虚拟变量,属于该行业时取值为1,否则为0 |
表3 描述性统计结果Tab.3 The results of descriptive statistics |
| 变量 | 观测值 | 均值 | 标准差 | MIN | P25 | P50 | P75 | MAX |
|---|---|---|---|---|---|---|---|---|
| Underpricing | 916 | 0.693 | 0.807 | -0.263 | 0.277 | 0.440 | 0.819 | 6.267 |
| PE | 916 | 0.826 | 0.379 | 0 | 1 | 1 | 1 | 1 |
| HSR | 916 | 0.427 | 0.495 | 0 | 0 | 0 | 1 | 1 |
| Offerprice | 916 | 18.570 | 12.190 | 2.290 | 10.100 | 15.840 | 24 | 148 |
| Turnover | 916 | 53.710 | 33.270 | 0.020 | 23.220 | 68.700 | 80.200 | 95.270 |
| Offerproceeds | 916 | 19.870 | 0.706 | 17.470 | 19.360 | 19.850 | 20.320 | 22.670 |
| Lev | 916 | 0.285 | 0.170 | 0.013 | 0.148 | 0.260 | 0.387 | 0.965 |
| Shrcr | 916 | 0.593 | 0.131 | 0.120 | 0.511 | 0.609 | 0.687 | 0.945 |
| Size | 916 | 20.980 | 0.829 | 19.31 | 20.440 | 20.860 | 21.360 | 26.870 |
| B/M | 916 | 0.671 | 0.150 | 0.244 | 0.568 | 0.677 | 0.792 | 1.002 |
| Cash | 916 | 0.383 | 0.188 | 0 | 0.240 | 0.372 | 0.517 | 0.954 |
| TobinQ | 916 | 1.584 | 0.452 | 0.998 | 1.262 | 1.477 | 1.762 | 4.095 |
| Hhi | 916 | 0.172 | 0.121 | 0.002 | 0.081 | 0.146 | 0.236 | 0.748 |
表4 地理位置与私募股权投资治理效果Tab.4 Geographical location and the governance effect of PE investment |
| 变量 | (1) 全样本 | (2) 东部地区 | (3) 中部地区 | (4) 西部地区 |
|---|---|---|---|---|
| Constant | 6.789*** (5.34) | 8.166*** (6.31) | -1.407 (-0.43) | 6.616* (1.97) |
| PE | -0.057* (-1.79) | -0.074* (-1.76) | -0.101 (-0.73) | -0.216 (-0.82) |
| Offerprice | -0.005 (-1.61) | -0.003 (-1.00) | -0.018*** (-2.69) | -0.011 (-1.21) |
| Turnover | 0.010*** (13.48) | 0.009*** (11.78) | 0.011*** (6.03) | 0.014*** (4.76) |
| Offerproceeds | -0.729*** (-3.71) | -0.875*** (-3.94) | 0.309 (0.98) | -0.531 (-1.59) |
| Lev | 0.363 (1.00) | 0.111 (0.27) | 2.251*** (3.68) | 0.611 (0.72) |
| Shrcr | 0.443* (1.87) | 0.631*** (2.62) | 0.388 (0.51) | 0.568 (0.66) |
| Size | 0.465*** (2.96) | 0.553*** (3.10) | -0.444* (-1.66) | 0.422* (1.79) |
| B/M | -2.853*** (-5.05) | -3.114*** (-5.96) | 1.894 (1.51) | -4.975*** (-3.66) |
| Cash | -0.091 (-0.69) | 0.067 (0.45) | -0.438 (-1.46) | -1.271* (-1.83) |
| TobinQ | -0.122 (-0.56) | -0.282 (-1.49) | 1.986*** (3.78) | -0.648** (-2.36) |
| Hhi | -0.018 (-0.08) | 0.129 (0.54) | -0.627 (-1.06) | -1.114 (-1.18) |
| Year fixed effect | 控制 | 控制 | 控制 | 控制 |
| Industry fixed effect | 控制 | 控制 | 控制 | 控制 |
| N | 916 | 716 | 114 | 86 |
| Adj. R2 | 0.445 | 0.455 | 0.591 | 0.412 |
注:1.括号内为t值;2.*、**和***分别表示10%、5%和1%的显著性水平;3.标准误经异方差(heteroskedasticity)调整。表5同。 |
表5 高铁开通对私募股权投资治理效果的影响Tab.5 The effect of HSR on the governance effect of PE investment |
| 变量 | (1) 东部地区 | (2) 中部地区 | (3) 西部地区 |
|---|---|---|---|
| Constant | 7.917***(6.08) | -1.697(-0.51) | 6.908*(1.98) |
| PE | -0.142(-1.55) | -0.084(-0.46) | -0.263(-0.96) |
| HSR | -0.317***(-3.13) | -0.236(-0.84) | -1.346***(-2.72) |
| PE×HSR | -0.155(-0.49) | -0.206*(-1.82) | -1.134**(-2.13) |
| Offerprice | -0.003(-1.10) | -0.018***(-2.67) | -0.008(-0.95) |
| Turnover | 0.008***(10.46) | 0.010***(5.81) | 0.013***(4.07) |
| Offerproceeds | -0.866***(-3.91) | 0.280(0.88) | -0.612*(-1.87) |
| Lev | 0.002(0.00) | 2.117***(3.39) | 0.326(0.37) |
| Shrcr | 0.552**(2.32) | 0.336(0.42) | 0.887(0.97) |
| Size | 0.568***(3.21) | -0.401(-1.45) | 0.513**(2.21) |
| B/M | -3.110***(-6.04) | 2.006(1.64) | -5.242***(-3.82) |
| Cash | 0.070(0.48) | -0.384(-1.20) | -1.549**(-2.13) |
| TobinQ | -0.282(-1.52) | 2.006***(3.86) | -0.773***(-2.72) |
| Hhi | 0.156(0.67) | -0.618(-1.00) | -1.522(-1.52) |
| Year fixed effect | 控制 | 控制 | 控制 |
| Industry fixed effect | 控制 | 控制 | 控制 |
| N | 716 | 114 | 86 |
| Adj.R2 | 0.461 | 0.586 | 0.422 |
| [1] |
王媛. 市场可达性、空间集聚经济与高铁站区经济发展[J]. 财贸经济, 2020, 41(3):131-145.
|
| [2] |
|
| [3] |
|
| [4] |
|
| [5] |
|
| [6] |
易志高, 潘子成, 李心丹, 等. 高管政治关联助推公司媒体报道了吗?——来自民营企业 IPO 期间的证据[J]. 财经研究, 2018, 44(6):126-139.
|
| [7] |
伍文中, 高琪. 逐名效应,认证监督与中国创业板IPO抑价[J]. 金融经济学研究, 2018(6):96-105.
|
| [8] |
潘攀, 许志勇, 粟立钟. 私募股权投资对创业板上市公司现金股利政策研究[J]. 中国软科学, 2019(6):168-175.
|
| [9] |
|
| [10] |
|
| [11] |
黄张凯, 刘津宇, 马光荣. 地理位置、高铁与信息:来自中国IPO市场的证据[J]. 世界经济, 2016(10):127-149.
|
| [12] |
龙玉, 赵海龙, 张新德, 等. 时空压缩下的风险投资——高铁通车与风险投资区域变化[J]. 经济研究, 2017, 52(4):195-208.
|
| [13] |
|
| [14] |
|
| [15] |
|
| [16] |
|
| [17] |
张永明, 潘攀, 邓超. 私募股权投资进入对上市公司 IPO 当年业绩的影响研究[J]. 管理科学, 2018, 31(1):149-160.
|
| [18] |
马学广, 唐承辉. 中国城市网络化空间联系与格局——基于高铁客运流的大数据分析[J]. 经济地理, 2018, 38(4):55-64.
|
| [19] |
湛泳, 田知敏慧. 高速铁路对居民消费的空间溢出效应研究[J]. 消费经济, 2020, 36(2):427-50.
|
| [20] |
吉赟, 杨青. 高铁开通能否促进企业创新:基于准自然实验的研究[J]. 世界经济, 2020, 43(2):147-166.
|
| [21] |
诸竹君, 黄先海, 王煌. 交通基础设施改善促进了企业创新吗?——基于高铁开通的准自然实验[J]. 金融研究, 2019(11):153-169.
|
| [22] |
戴学珍, 吕春阳, 郑伊硕, 等. 交通方式对京津冀空间相互作用贡献率分析[J]. 经济地理, 2019, 39 (8):36-43.
|
| [23] |
|
| [24] |
张学勇, 廖理, 罗远航. 券商背景风险投资与公司 IPO 抑价——基于信息不对称的视角[J]. 中国工业经济, 2014 (11):90-101.
|
| [25] |
|
/
| 〈 |
|
〉 |