
Spatial Characteristics and Mechanism of the Coordinated Development of Three Industries at County Level in the Yangtze River Delta
Received date: 2020-03-16
Revised date: 2020-11-09
Online published: 2025-04-30
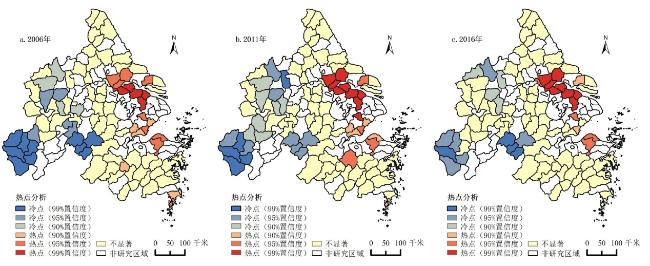
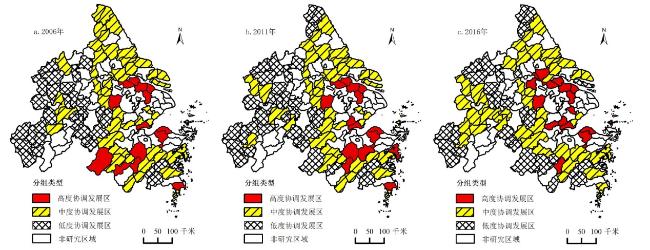
The research reconstructs the evaluation index system of the coordinated development of the three industries,uses the coupling coordination degree model to measure its level,and applies the Spatial Durbin Panel Model to explore the mechanism of the coordinated development of the three industries. It shows that: 1) According to the coordinated development level of the three industries,it can be divided into a high-level coordinated development zone,a moderate-level coordinated development zone and a low-level coordinated development zone in the counties of the Yangtze River Delta. 2) It presents noticeable space agglomeration at the whole and regional level in Yangtze River Delta,and spatial heterogeneity is gradually weakened. 3) Five mechanisms (technological innovation,fiscal support,financial services,infrastructure investment and Internet+) have different influences on the three zones of the Yangtze River Delta. Lastly,the article puts forward some suggestions that implement measures should be formulated in accordance with the principle of regional differentiation guidance.
LI Zhengxin , XU Weixiang , LIU Chengjun . Spatial Characteristics and Mechanism of the Coordinated Development of Three Industries at County Level in the Yangtze River Delta[J]. Economic geography, 2021 , 41(3) : 136 -143 . DOI: 10.15957/j.cnki.jjdl.2021.03.014
表1 三次产业协调发展指标评价体系Tab.1 The comprehensive evaluation index system of the three industrial integrated development |
| 产业 | 具体指标 | 单位 | 权重 | ||
|---|---|---|---|---|---|
| 农业 | 1/3 | 产业结构 | 农业增加值比重 | % | 0.2152 |
| 农业从业人员比例 | % | 0.1393 | |||
| 产业效益 | 农业劳动生产率 | 万元/人 | 0.2072 | ||
| 人均粮食产量 | t/万人 | 0.1280 | |||
| 产业潜力 | 农业就业增长率 | % | 0.1171 | ||
| 农业机械化水平增长率 | % | 0.1932 | |||
| 工业 | 1/3 | 产业结构 | 工业化增加值比重 | % | 0.2071 |
| 工业从业人员比例 | % | 0.1747 | |||
| 产业效益 | 工业劳动生产率 | 万元/人 | 0.1870 | ||
| 工业产值利润率 | % | 0.1323 | |||
| 产业潜力 | 工业就业增长率 | % | 0.1441 | ||
| 工业增加值增长率 | % | 0.1548 | |||
| 服务业 | 1/3 | 产业结构 | 服务业增加值比重 | % | 0.2065 |
| 服务业从业人员比例 | % | 0.1879 | |||
| 产业效益 | 服务业劳动生产率 | 万元/人 | 0.1536 | ||
| 人均社会消费品零售额 | 万元/人 | 0.1367 | |||
| 产业潜力 | 服务业就业增长率 | % | 0.1454 | ||
| 服务业增加值增长率 | % | 0.1699 |
表3 分区空间自相关情况Tab.3 The partition situation of the three industrial convergence development’s Global Moran’s I |
| 地区 | 长三角整体 | 高度协调发展区 | 中度协调发展区 | 低度协调发展区 | |||||||||||
|---|---|---|---|---|---|---|---|---|---|---|---|---|---|---|---|
| 县域数量 | 95 | 18 | 45 | 32 | |||||||||||
| 指标 | I | Z | P | I | Z | P | I | Z | P | I | Z | P | |||
| 2006 | 0.679 | 8.290 | 0.000 | 0.320 | 1.989 | 0.047 | 0.608 | 4.183 | 0.000 | 0.599 | 4.631 | 0.000 | |||
| 2011 | 0.662 | 8.092 | 0.000 | 0.267 | 1.894 | 0.067 | 0.602 | 4.132 | 0.000 | 0.518 | 3.966 | 0.000 | |||
| 2016 | 0.547 | 6.746 | 0.000 | 0.172 | 1.601 | 0.095 | 0.577 | 4.087 | 0.000 | 0.355 | 2.837 | 0.005 | |||
表4 计量模型的被解释变量、解释变量和控制变量Tab.4 The dependent,independent and controlled variables of the econometric model |
| 变量性质 | 变量名称 | 符号 | 变量含义解释 |
|---|---|---|---|
| 被解释变量 | 三次产业协调发展水平 | coor_dep | 根据耦合协调度模型计算得出 |
| 解释变量 | 技术创新 | tech | 人均专利申请授权量 |
| 财政支出 | fiscal | 人均财政支出额度 | |
| 金融服务 | finance | 人均金融贷款余额 | |
| 基础投资 | infras | 人均固定资产投资额 | |
| 互联网+ | internet | 互联网用户数占比 |
表5 空间面板模型的检验表Tab.5 The test table of Spatial Durbin Panel Data Model |
| 检验 | 长三角整体 | 高度协调发展区 | 中度协调发展区 | 低度协调发展区 | |
|---|---|---|---|---|---|
| 空间滞后项 | LR检验 | 13.035** | 10.837* | 22.444*** | 17.298** |
| Wald检验 | 13.113** | 10.231* | 22.964*** | 16.576** | |
| 空间误差项 | LR检验 | 12.980** | 9.860* | 22.046*** | 17.146** |
| Wald检验 | 13.039** | 10.116* | 22.356*** | 16.238** | |
| Hausman检验 | 127.551*** | 59.296*** | 34.357*** | 33.823*** | |
表6 空间杜宾模型的估计结果Tab.6 The evaluation results of Spatial Durbin Panel Model |
| 长三角 整体 | 高度协调 发展区 | 中度协调 发展区 | 低度协调 发展区 | |
|---|---|---|---|---|
| ln tech | 0.1672*** | 0.5744*** | 0.8707 *** | 0.0833 |
| ln fiscal | 0.2417*** | 0.4701*** | 0.2702*** | 0.1240** |
| ln finance | 1.2669*** | 1.8603*** | 0.8309** | 1.5706** |
| ln infras | 0.1327 | 0.2924* | 0.0346 | 0.1341 |
| ln internet | 1.1752** | 2.6490*** | 0.0447 | 0.5356 |
| W·ln tech | 0.5733*** | 0.2649 | 0.9284*** | 0.8355 |
| W·ln fiscal | -0.0162* | -0.0149 | -0.1405 | -0.1583* |
| W·ln finance | 0.5868 | 0.4754 | 0.6674 | 0.5810 |
| W·ln infras | 0.7510*** | 0.6612 | 0.3799 | 0.8527* |
| W·ln internet | 0.8421*** | 2.1549*** | 0.1448 | 0.7896 |
| W·coor_dep | 1.2332*** | 5.6797*** | 3.1104*** | 1.2042** |
| R2 | 0.8934 | 0.9273 | 0.8130 | 0.7838 |
| 样本数量 | 1 045 | 198 | 495 | 352 |
表7 直接效应和间接效应的估计结果Tab.7 The evaluation results of direct effects and indirect effects |
| 长三角 整体 | 高度协调 发展区 | 中度协调 发展区 | 低度协调 发展区 | ||
|---|---|---|---|---|---|
| 直接效应 | ln tech | 0.1726** | 0.5573 ** | 0.8740*** | 0.0772 |
| ln fiscal | 0.2425*** | 0.4792*** | 0.2732*** | 0.1195** | |
| ln finance | 1.1632*** | 1.9500** | 0.8223** | 1.5360** | |
| ln infras | 0.1650 | 0.2391 | 0.0342 | 0.1424 | |
| ln internet | 0.1511*** | 2.8852*** | 0.0425 | 0.5499 | |
| 间接效应 | ln tech | 0.5884*** | 0.1373 | 0.9295*** | 0.8343 |
| ln fiscal | -0.0191* | -0.0789 | -0.1511 | -0.1588* | |
| ln finance | 0.0706 | 0.8478 | 0.6656 | 0.6215 | |
| ln infras | 0.0573** | 0.5412 | 0.3821 | 0.8745* | |
| ln internet | 0.8167** | 2.4815** | 0.1331 | 0.8312 |
| [1] |
杨晓军, 宁国良. 县域经济:乡村振兴战略的重要支撑[J]. 中共中央党校学报, 2018, 22(6):119-124.
|
| [2] |
徐华. 三次产业协同发展机制及其产业政策[J]. 中国经济问题, 2010(6):34-41.
|
| [3] |
田敏, 刘宁, 杨明. 三次产业协同带动促进我国经济发展方式转变研究[J]. 经济体制改革, 2011(2):31-33.
|
| [4] |
巫强, 林勇, 任若琰. 长三角三次产业协调发展程度测算及其影响机理研究[J]. 上海经济研究, 2018(11):77-89.
|
| [5] |
唐晓华, 张欣珏, 李阳. 中国制造业与生产性服务业动态协调发展实证研究[J]. 经济研究, 2018, 53(3):79-93.
|
| [6] |
杜传忠, 王鑫, 刘忠京. 制造业与生产性服务业耦合协同能提高经济圈竞争力吗?——基于京津冀与长三角两大经济圈的比较[J]. 产业经济研究, 2013(6):19-28.
|
| [7] |
张虎, 韩爱华. 制造业与生产性服务业耦合能否促进空间协调——基于285个城市数据的检验[J]. 统计研究, 2019, 36(1):39-50.
|
| [8] |
刘胜, 陈秀英. 金融服务业与制造业空间协同分布驱动制造业转型升级了吗[J]. 金融经济学研究, 2019, 34(1):111-120.
|
| [9] |
张虎, 周楠. 制造业与服务业协调发展及影响因素分析[J]. 统计与决策, 2019, 35(11):86-90.
|
| [10] |
綦良群, 张庆楠. 我国装备制造业与生产性服务业网式融合影响因素研究[J]. 科技进步与对策, 2018, 35(13):64-71.
|
| [11] |
王成东, 綦良群, 蔡渊渊. 装备制造业与生产性服务业融合影响因素研究[J]. 工业技术经济, 2015, 34(2):134-142.
|
| [12] |
郭晓刚. 东北老工业基地三次产业协调发展研究——以吉林市为例[J]. 人民论坛, 2013(20):230-231.
|
| [13] |
侯国林, 黄震方. 旅游地社区参与度熵权层次分析评价模型与应用[J]. 地理研究, 2010, 29(10):1802-1813.
|
| [14] |
|
| [15] |
刘承良, 熊剑平, 龚晓琴, 等. 武汉城市圈经济—社会—资源—环境协调发展性评价[J]. 经济地理, 2009, 29(10):1650-1654,1695.
|
| [16] |
|
| [17] |
|
| [18] |
武鹏, 李同昇, 李卫民. 县域农村贫困化空间分异及其影响因素——以陕西山阳县为例[J]. 地理研究, 2018, 37(3):593-606.
|
| [19] |
赵勇, 白永秀. 中国城市群功能分工测度与分析[J]. 中国工业经济, 2012(11):18-30.
|
| [20] |
赵勇, 魏后凯. 政府干预、城市群空间功能分工与地区差距——兼论中国区域政策的有效性[J]. 管理世界, 2015(8):14-29,187.
|
| [21] |
陈学云, 程长明. 乡村振兴战略的三产融合路径:逻辑必然与实证判定[J]. 农业经济问题, 2018(11):91-100.
|
| [22] |
赵明亮. 新常态下中国产业协调发展路径——基于产业关联视角的研究[J]. 东岳论丛, 2015, 36(2):123-129.
|
| [23] |
|
| [24] |
梁丰, 程均丽. 地方政府行为、金融发展与产业结构升级——基于省际动态面板数据的实证分析[J]. 华东经济管理, 2018, 32(11):68-75.
|
| [25] |
刘程军, 周建平, 蒋建华, 等. 区域创新与区域金融耦合协调的格局及其驱动力——基于长江经济带的实证[J]. 经济地理, 2019, 39(10):94-103.
|
| [26] |
鞠晴江. 道路基础设施、经济增长和减贫——基于四川的实证分析[J]. 软科学, 2006(6):52-55.
|
| [27] |
刘程军, 周建平, 蒋建华, 等. 电子商务背景下县域物流的空间联系及其网络结构研究——以浙江省为例[J]. 地理科学, 2019, 39(11):1719-1728.
|
| [28] |
刘姿均, 陈文俊. 中国互联网发展水平与经济增长关系实证研究[J]. 经济地理, 2017, 37(8):108-113,154.
|
| [29] |
|
/
| 〈 |
|
〉 |