
Spatial and Temporal Evolution Characteristics and Influencing Factors of Restaurants in Guangzhou
Received date: 2018-05-16
Revised date: 2018-12-15
Online published: 2025-04-29
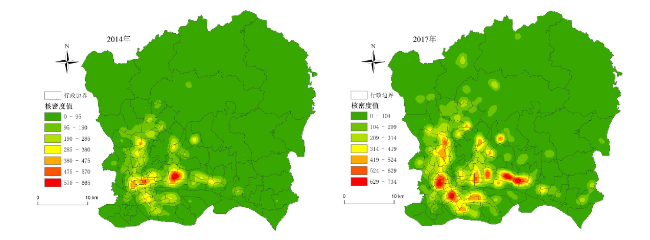
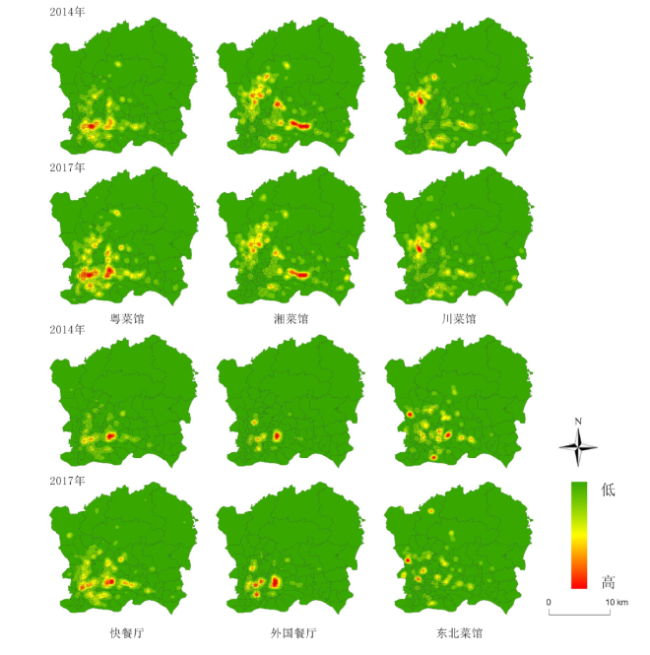
Knowing the spatial and temporal variation and distribution characteristics of the catering industry is of great significance to urban economic development, business management and decision-making. Based on the POI data of Guangzhou restaurants in 2014 and 2017, the spatial and temporal evolution and agglomeration characteristics of urban restaurant are analyzed with GIS spatial analysis method, and the influencing factors of its distribution are discussed. The results showed that: 1) In 2014-2017, spatial distribution pattern of the restaurants in Guangzhou varied from "dual core" to "multi core", which had significant spatial concentration characteristics. 2) There are spatial differences in different types of restaurants in 2014-2017. Cantonese cuisine restaurants occupy the dominant position, high density agglomeration areas are increasing, Sichuan and Hunan cuisine restaurants have little change, the agglomeration range of fast- food restaurants and foreign restaurants is expanding, and the agglomeration areas of northeastern restaurants are reduced. 3) The influence degree of the traffic station, residential area, the commercial center, the industrial park and the land price on the distribution of the restaurant is different. The restaurant has a higher correlation with the traffic station, residential area and the commercial center and there are more agglomeration in the areas of middle and high grade land price. Therefore, in the process of urban development, location selection and development planning of catering industry should integrate geographical and human factors. The research results can provide reference for the development planning and optimization management of urban catering industry.
ZENG Xuan , CUI Haishan , LIU Zhigen . Spatial and Temporal Evolution Characteristics and Influencing Factors of Restaurants in Guangzhou[J]. Economic geography, 2019 , 39(3) : 143 -151 . DOI: 10.15957/j.cnki.jjdl.2019.03.017
表1 2014、2017年餐饮店空间自相关分析结果Tab.1 Results of the space autocorrelation analysis of restaurant in 2014 and 2017 |
| 年份 | Moran’s I指数 | Z得分 | P值 |
|---|---|---|---|
| 2014 | 0.1234 | 9.35 | 0.00 |
| 2017 | 0.1960 | 14.68 | 0.00 |
图1 2014、2017年餐饮点标准差椭圆分析结果Fig.1 Standard deviation ellipse of restaurant in 2014 and 2017 |
表2 2014、2017年餐饮店标准差椭圆分析结果Tab.2 Results of standard deviation ellipse of restaurant in 2014 and 2017 |
| 2014 | 2017 | |
|---|---|---|
| 椭圆面积(km2) | 246.557 | 386.077 |
| 椭圆x轴方向轴长(m) | 9 866.92 | 11 666.87 |
| 椭圆y轴方向轴长(m) | 8 535.13 | 10 533.97 |
| 椭圆x轴的旋转角度(°) | 115 | 112 |
表3 2014、2017年餐饮店平均最近邻分析结果Tab.3 Average nearest neighbor analysis of restaurants in 2014 and 2017 |
| 各类餐饮店 | 2014年 | 2017年 | |||||||||
|---|---|---|---|---|---|---|---|---|---|---|---|
| R值 | P值 | 平均最近邻距离(m) | Z值 | 分布特征 | R值 | P值 | 平均最近邻距离(m) | Z值 | 分布特征 | ||
| 粤菜馆 | 0.5194 | 0.00 | 238.83 | -33.33 | 一般集聚 | 0.5292 | 0.00 | 281.08 | -32.91 | 一般集聚 | |
| 湘菜馆 | 0.3500 | 0.00 | 114.23 | -62.91 | 一般集聚 | 0.3319 | 0.00 | 120.76 | -69.99 | 一般集聚 | |
| 川菜馆 | 0.3843 | 0.00 | 146.46 | -50.74 | 一般集聚 | 0.3471 | 0.00 | 146.31 | -58.76 | 一般集聚 | |
| 快餐厅 | 0.3267 | 0.00 | 65.01 | -107.46 | 比较集聚 | 0.3216 | 0.00 | 66.51 | -127.19 | 比较集聚 | |
| 外国餐厅 | 0.2677 | 0.00 | 97.67 | -58.17 | 强烈集聚 | 0.2675 | 0.00 | 85.76 | -85.79 | 强烈集聚 | |
| 东北菜馆 | 0.5839 | 0.00 | 529.04 | -11.48 | 一般集聚 | 0.6149 | 0.00 | 788.83 | -10.18 | 一般集聚 | |
表4 餐饮店在不同地价等级分布情况Tab.4 Distribution of restaurants in different land prices |
| 地价等级 | 级别价(元/m2建筑面积) | 粤菜馆 | 川菜馆 | 湘菜馆 | 快餐厅 | 外国餐厅 | 东北菜馆 |
|---|---|---|---|---|---|---|---|
| 一级 | 33 186 | 175 | 119 | 106 | 1 197 | 915 | 14 |
| 二级 | 26 599 | 330 | 316 | 421 | 2 392 | 1 410 | 48 |
| 三级 | 19 286 | 367 | 697 | 915 | 2 757 | 806 | 52 |
| 四级 | 15 101 | 208 | 421 | 588 | 1 392 | 290 | 34 |
| 五级 | 10 253 | 138 | 365 | 531 | 927 | 180 | 18 |
| 六级 | 7 029 | 36 | 127 | 166 | 212 | 21 | 8 |
| 七级 | 4 424 | 53 | 92 | 166 | 452 | 87 | 13 |
| 八级 | 3 144 | 10 | 27 | 42 | 25 | 30 | 1 |
注:地价数据来源广州市国土资源和规划委员会(http://www.gz.gov.cn/gzupojg/tzgg/201801/5dd6eebbe4af47da97383047261a96e3.shtml)。 |
表5 广州市餐饮店多元线性回归分析模型估计结果Tab.5 Estimation results of multiple linear regression analysis model of restaurants in Guangzhou |
| 变量 | 粤菜馆 | 湘菜馆 | 川菜馆 | 快餐厅 | 外国餐厅 | 东北菜馆 |
|---|---|---|---|---|---|---|
| 公交站 | 0.138 | 0.590 | 0.556 | 1.315 | 0.343 | 0.592 |
| 居民区 | 0.240 | 0.169 | 0.069 | -0.513 | 0.190 | -0.103 |
| 写字楼 | 0.102 | 0.357 | 0.152 | 0.939 | 0.780 | 0.213 |
| 工业园 | 0.074 | 1.533 | 1.388 | 0.368 | -0.646 | -0.615 |
| 常数项 | -0.013 | -0.032 | -0.101 | -0.042 | 0.013 | -0.010 |
| 网点数 | 1336 | 2999 | 2214 | 9696 | 3748 | 192 |
| Adj.R2 | 0.906 | 0.914 | 0.898 | 0.894 | 0.886 | 0.853 |
| F检验 | 6 390.957 | 1 275.586 | 2 284.872 | 5 921.309 | 3 432.472 | 837.502 |
| P值 | 0.000 | 0.000 | 0.000 | 0.000 | 0.000 | 0.000 |
| [1] |
|
| [2] |
|
| [3] |
|
| [4] |
|
| [5] |
|
| [6] |
|
| [7] |
陈传康. 中国饮食文化的区域分化和发展趋势[J]. 地理学报, 1994, 49(3):226-235.
|
| [8] |
蓝勇. 中国饮食辛辣口味的地理分布及其成因研究[J]. 地理研究, 2001, 20(2):229-237.
|
| [9] |
蔡晓梅, 甘巧林, 张朝枝. 广州饮食文化景观的空间特征及其形成机理分析[J]. 社会科学家, 2004(2):95-98.
|
| [10] |
胡志毅, 张兆干. 城市饭店的空间布局分析——以南京市为例[J]. 经济地理, 2002, 22(1):106-110.
|
| [11] |
袁小红, 毛端谦, 刘婕. 城市星级饭店空间分布模式分析——以南昌市为例[J]. 江西师范大学学报:自然科学版, 2010, 34(3):325-330.
|
| [12] |
程易易. 成都市中心区餐饮业空间结构及影响因素研究[D]. 成都: 西南交通大学, 2017.
|
| [13] |
赖怡琳. 广州市城市餐饮产业集群规划设计研究[D]. 广州: 华南理工大学, 2012.
|
| [14] |
邬伦, 刘亮, 田原, 等. 基于网络K函数法的地理对象分布模式分析——以香港岛餐饮业空间格局为例[J]. 地理与地理信息科学, 2013, 29(5):7-11.
|
| [15] |
方嘉雯. 北京五道口地区韩国餐饮业空间布局特征与集聚机理分析[J]. 经济地理, 2014, 34(12):106-113.
|
| [16] |
杨帆, 徐建刚, 周亮. 基于DBSCAN空间聚类的广州市区餐饮集群识别及空间特征分析[J]. 经济地理, 2016, 36(10):110-116.
|
| [17] |
秦萧, 甄峰, 朱寿佳, 等. 基于网络口碑度的南京城区餐饮业空间分布格局研究——以大众点评网为例[J]. 地理科学, 2014, 34(7):810-817.
|
| [18] |
|
| [19] |
陈刚强, 李郇, 许学强. 中国城市人口的空间集聚特征与规律分析[J]. 地理学报, 2008, 63(10):1045-1 054.
|
| [20] |
车冰清, 简晓彬, 陆玉麒. 江苏省商业网点的空间分布特征及其区域差异因素[J]. 地球信息科学学报, 2017, 19(8):1060-1 068.
|
| [21] |
王茂军, 张学霞, 吴骏毅, 等. 社区尺度认知地图扭曲的空间分析——基于首师大和北林大的个案研究[J]. 人文地理, 2009, 24(3):54-60.
|
| [22] |
张珣, 钟耳顺, 张小虎, 等. 2004—2008年北京城区商业网点空间分布与集聚特征[J]. 地理科学进展, 2013, 32(8):1207-1 215.
|
| [23] |
王洋, 杨忍, 李强, 等. 广州市银行业的空间布局特征与模式[J]. 地理科学, 2016, 36(5):742-750.
|
| [24] |
李阳, 陈晓红. 哈尔滨市商业中心时空演变与空间集聚特征研究[J]. 地理研究, 2017, 36(7):1377-1 385.
|
| [25] |
|
/
| 〈 |
|
〉 |


