
Empirical Study:Impact of Tax Competition on Environmental Pollution in China
Received date: 2018-10-23
Revised date: 2019-03-31
Online published: 2025-04-27
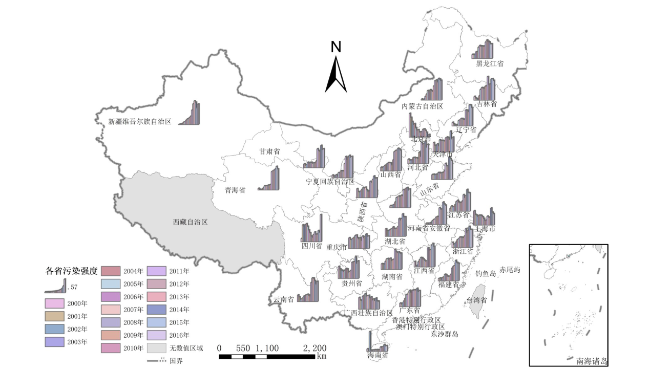
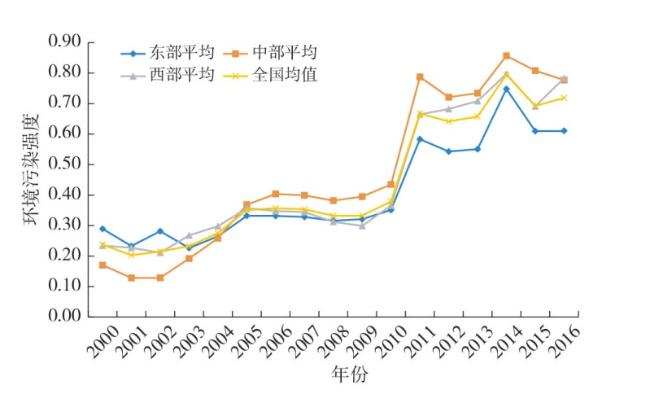
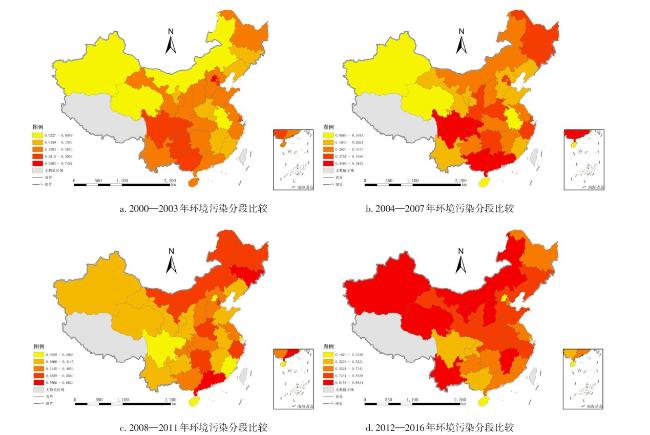
Based on the industrial pollution data of 30 provinces, autonomous regions and municipalities of China, this article establishes three-dimensional data table and measures China's environmental pollution emission intensity applying the extreme value entropy method, it sets up a panel regression model from the dual perspective of tax amount and structure and uses differential generalized moment estimation method to empirically test the impact of tax competition on environmental pollution. The main conclusions include: 1) The environmental pollution shows an upward trend in China from 2000 to 2016.The intensity of pollution emission was higher in the eastern region than that in the central and western regions before 2003, then, the environmental pollution has improved significantly in the eastern region; the pressure of environmental pollution has increased in the central region after 2005; the intensity of pollution emission showed an alternating upward and downward trend in the western region before 2012, the pressure of environmental pollution was higher in the western region recent years than that in the eastern and central regions. 2) From the perspective of total tax revenue, the intergovernmental tax competition has significantly restrained pollution emissions, which is a kind of "preferential competition". 3) From the perspective of tax structure, the value added tax competition has aggravated the deterioration of pollution, and enterprise income tax competition has effectively restrained pollution emissions. 4) In term of region, tax competition is low in the eastern region, and its impact on pollution emissions is not significant; tax competition has a significant impact on pollution emissions in the central and western regions. 5) From the point of view of government environmental control, tax competition between governments and interaction of government environmental protection policies significantly inhibit environmental pollution. This paper argues that it is imperative to reform the evaluation system of official promotion, improve the tax decentralization system and implement the differential tax policy.
TIAN Shizhong , ZHANG Haotian , LI Yuqing . Empirical Study:Impact of Tax Competition on Environmental Pollution in China[J]. Economic geography, 2019 , 39(7) : 194 -204 . DOI: 10.15957/j.cnki.jjdl.2019.07.022
表1 税收竞争对环境污染的影响回归估计结果(1)Tab.1 Regression estimation of the impact of tax competition on environmental pollution(1) |
| 解释变量 | 总税收竞争 模型式(9) | 增值税竞争 模型式(10) | 企业所得税 竞争模型式(11) |
|---|---|---|---|
| T-COMit | -0.4103*** (0.064) | ||
| Z-COMit | 0.0858*** (0.0253) | ||
| Q-COMit | -0.0383*** (0.0034) | ||
| ZFBHit | -21.3498*** (1.8126) | -14.1933*** (0.8665) | -18.79*** (1.5372) |
| PGDPit | 0.0473*** (0.0004) | 0.0779*** (0.0056) | 0.0624*** (0.0093) |
| INDit | 0.2202 (0.1482) | 0.0284 (0.1225) | 0.0918 (0.1469) |
| R&Dit | -38.3342*** (6.9428) | -40.3698*** (4.8511) | -40.1503*** (7.6184) |
| ENV(-1)it | 0.3465*** (0.0085) | 0.3558*** (0.0074) | 0.3652*** (0.0063) |
| AR(1) | 0.0001 | 0.0001 | 0.0001 |
| AR(2) | 0.1745 | 0.2342 | 0.2187 |
| SARGAN | 0.3596 | 0.2637 | 0.2656 |
表2 税收竞争对环境污染的影响回归估计结果(2)Tab.2 Regression estimation of the impact of tax competition on environmental pollution(2) |
| 解释变量 | 总税收竞争 模型式(12) | 增值税竞争 模型式(13) | 企业所得税竞争模型式(14) |
|---|---|---|---|
| T-COMit | -0.4100*** (0.0671) | ||
| Z-COMit | 0.0876*** (0.0278) | ||
| Q-COMit | -0.0396*** (0.0035) | ||
| ZFBHit | -20.7434*** (0.0187) | -14.8310*** (1.3242) | -18.7153*** (1.5704) |
| C&Zit | -35.7885** (5.6243) | -18.7880 (9.9518) | -14.3968*** (4.7441) |
| PGDPit | 0.0483*** (0.0115) | 0.0830*** (0.0078) | 0.0618*** (0.0073) |
| INDit | 0.1602 (0.1408) | 0.0490 (0.1629) | -0.1271 (0.1273) |
| R&Dit | -37.5050*** (8.7306) | -42.2494*** (5.5441) | -41.6627*** (7.2003) |
| ENV(-1)it | 0.3881*** (0.0086) | 0.3578*** (0.0083) | 0.3661*** (0.0073) |
| AR(1) | 0.0001 | 0.0001 | 0.0001 |
| AR(2) | 0.1581 | 0.3093 | 0.2564 |
| SARGAN | 0.3248 | 0.2725 | 0.2262 |
表3 分地区税收竞争对环境污染影响的实证结果Tab.3 Empirical results of the impact of tax competition on environmental pollution in regions |
| 解释变量 | 总税收竞争模型式(9) | 增值税竞争模型式(10) | 企业所得税竞争模型式(11) | ||||||||
|---|---|---|---|---|---|---|---|---|---|---|---|
| 东部 | 中部 | 西部 | 东部 | 中部 | 西部 | 东部 | 中部 | 西部 | |||
| T-COMit | -0.0074 (0.0198) | -0.3501*** (0.0841) | -0.0974*** (0.0076) | ||||||||
| Z-COMit | 0.3313** (0.1125) | 0.2349*** (0.0887) | 0.0975** (0.0193) | ||||||||
| Q-COMit | -0.5083 (0.1140) | 0.0129*(0.0154) | -0.0148*** (0.0050) | ||||||||
| ZFBHit | -2.770 (2.3509) | -30.0908 (9.4338) | -0.6021*** (0.1725) | -9.0464 (10.9353) | -0.2349*** (0.0887) | -4.3045 (0.8825) | -20.1501*** (11.1768) | -32.6390** (13.1796) | -1.3359*** (4.0247) | ||
| PGDPit | 0.0274*** (0.0026) | 0.0579** (0.0188) | 0.0005*** (0.0001) | 0.0792*** (0.1000) | 0.0662*** (0.0184) | 0.0646*** (0.0046) | 0.0264** (0.0122) | 0.0815*** (0.0253) | 0.7180*** (0.0065) | ||
| INDit | -0.5867*** (0.0914) | 1.21617*** (0.4235) | 0.0230 (0.0074) | -0.4320*** (0.9832) | 1.7337*** (0.3545) | 0.0446(0.00408) | 0.2607 (0.5013) | 1.3961*** (0.4214) | -0.3965*** (0.3168) | ||
| R&Dit | -13.9912*** (2.5832) | -3.5402 (24.3895) | -0.3825*** (0.1370) | -55.6815 (76.9687) | -9.7987 (20.2132) | -47.03*** (9.4561) | -13.4300 (14.6516) | -2.7094 (12.9208) | -34.3672*** (1.2860) | ||
| ENV(-1)it | 0.4445*** (0.2112) | 0.2478* (0.1088) | 0.2478*** (0.0076) | 0.2545 (0.3378) | 0.2327* (0.1218) | 0.6736*** (0.0092) | 0.2647* (0.1149) | 0.2647* (0.1149) | -0.6461*** (0.0086) | ||
| AR(1) | 0.0001 | 0.0066 | 0.0014 | 0.0027 | 0.0005 | 0.0004 | 0.0027 | 0.0001 | 0.0044 | ||
| AR(2) | 0.1682 | 0.35247 | 0.9760 | 0.7503 | 0.9761 | 0.6614 | 0.7503 | 0.3457 | 0.7668 | ||
| SARGAN | 0.3664 | 0.0912 | 0.5658 | 0.3603 | 0.1890 | 0.5194 | 0.3415 | 0.1210 | 0.5816 | ||
表4 基于税负替代税收竞争变量的稳健性检验结果Tab.4 Robustness test results based on tax burden (replacing tax competition)variables |
| 解释变量 | 总税收竞争 模型式(9) | 增值税竞争 模型式(10) | 企业所得税竞争模型式(11) |
|---|---|---|---|
| T-COMit | -3.8692*** (0.4964) | ||
| Z-COMit | 0.6342*** (0.2199) | ||
| Q-COMit | -5.0429*** (0.0041) | ||
| ZFBHit | -22.3064*** (0.9875) | -18.1518*** (1.0083) | -16.3563*** (0.7924) |
| PGDPit | 0.1191*** (0.0183) | 0.0722*** (0.0092) | 0.0732*** (0.0077) |
| INDit | 1.0740*** (0.1624) | 0.2096 (0.134) | 0.2725* (0.1391) |
| R&Dit | -43.8276*** (7.7862) | -41.2141*** (6.4959) | -29.8614*** (4.7651) |
| ENV(-1)it | 0.3465*** (0.0085) | 0.3646*** (0.0046) | 0.3603*** (0.0042) |
| AR(1) | 0.0001 | 0.0008 | 0.0001 |
| AR(2) | 0.2616 | 0.1644 | 0.2187 |
| SARGAN | 0.2008 | 0.2901 | 0.2656 |
| [1] |
郑洁, 付才辉, 张彩虹. 财政分权与环境污染:基于新结构经济学视角[J]. 财政研究, 2018(3):57-70.
|
| [2] |
|
| [3] |
Cumberland. Efficiency and Equity in Interregional Environ-mental Management[J]. Review of Regional Studies, 1981(2):1-9.
|
| [4] |
|
| [5] |
|
| [6] |
|
| [7] |
|
| [8] |
Wilson,
|
| [9] |
李永友, 沈坤荣. 我国污染控制政策的减排效果:基于省际工业污染数据的实证分析[J]. 管理世界, 2008(7):7-17.
|
| [10] |
崔亚飞, 刘小川. 中国省级税收竞争与环境污染:基于1998—2006年面板数据的分析[J]. 财经研究, 2010, 36(4):46-55.
|
| [11] |
张宏翔, 张宁川, 匡素帛. 政府竞争与分权通道的交互作用对环境质量的影响研究[J]. 统计研究, 2015(6):74-80.
|
| [12] |
李香菊, 贺娜. 税收对环境污染的影响分析:基于财政分权视角[J]. 中国地质大学学报:社科版, 2017, 17(6):54-66.
|
| [13] |
朱小会, 陆远权. 环境财税政策的治污效应研究:基于区域和门槛效应视角[J]. 中国人口·资源与环境, 2017, 27(1):83-90.
|
| [14] |
黎斌, 贺灿飞, 周沂. 相关多样化、地方政府竞争与中国重化工业企业动态[J]. 经济地理, 2016, 36(6):91-99.
|
| [15] |
|
| [16] |
卢洪友, 唐飞, 许文立. 税收政策能增强企业的环境责任吗:来自我国上市公司的证据[J]. 财贸研究, 2017, 28(1):85-91.
|
| [17] |
王丽萍, 夏文静. 中国污染产业强度划分与区际转移路径[J]. 经济地理, 2019, 39(3):152-161.
|
| [18] |
张克中, 王娟, 崔小勇. 财政分权与环境污染:碳排放的视角[J]. 中国工业经济, 2011(10):65-75.
|
| [19] |
谭志雄, 张阳阳. 财政分权与环境污染关系实证研究[J]. 中国人口·资源与环境, 2015, 25(4):110-117.
|
| [20] |
|
| [21] |
姚公安. 横向税收竞争的环境效应研究[J]. 技术经济与管理研究, 2014(12):79-83.
|
| [22] |
|
| [23] |
|
| [24] |
沈坤荣, 付文林. 税收竞争、地区博弈及其增长绩效[J]. 经济研究, 2006(6):16-26.
|
/
| 〈 |
|
〉 |