
Threshold Effect of Shadow Economic Impact on Green Innovation Efficiency
Received date: 2018-11-28
Revised date: 2019-04-17
Online published: 2025-04-27
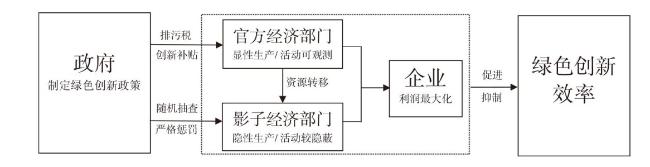
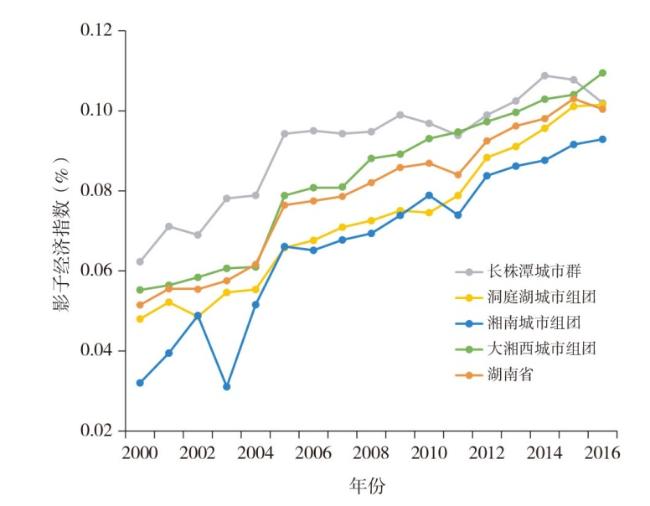
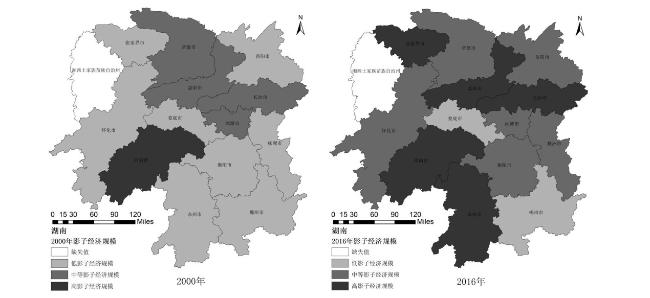
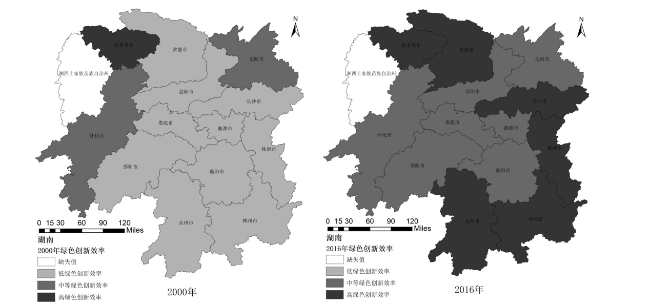
Firstly, this article constructs a microcosmic model to explore the influence mechanism of shadow economy on green innovation efficiency. The study finds that there is a nonlinear relationship between shadow economy and green innovation efficiency. Secondly, based on the panel data of Hunan prefecture-level cities in the demonstration areas of "independent innovation" and "two-oriented society", it applies Multiple Indicators and Multiple Causes(MIMIC) to measure the shadow economy and DEA-SBM model to measure green innovation efficiency. The results show that the shadow economy and green innovation efficiency in Hunan province show an increasing trend from 2000 to 2016. Based on this, this article establishes the panel threshold regression model and empirically tests the non-linear relationship between shadow economy and green innovation efficiency. The empirical results show that there is a double threshold relationship between shadow economy and green innovation efficiency, and it presents an inverted "N" feature in the relationship between shadow economy and green innovation efficiency. In addition, government regulation, traffic conditions, education degree, foreign direct investment level, industrial structure and urbanization level also influence green innovation efficiency to varying degrees.
KUANG Chang'e , WEN Zezhou , PENG Wenbin . Threshold Effect of Shadow Economic Impact on Green Innovation Efficiency[J]. Economic geography, 2019 , 39(7) : 184 -193 . DOI: 10.15957/j.cnki.jjdl.2019.07.021
表1 影子经济和绿色创新效率评价指标体系Tab.1 Evaluation index system of shadow economy and green innovation efficiency |
| 目标层 | 类别层 | 指标层 | 指标度量、数据来源 |
|---|---|---|---|
| 影子经济 | 原因变量 | 税收负担(%)C1 | 税收总额/实际GDP |
| 政府管制程度(%)C2 | 政府消费/实际GDP | ||
| 居民收入份额(%)C3 | (城镇居民人均可支配收入 非农业人口数+农村居民人均可支配收入 农业人口数)/实际GDP | ||
| 失业率(%)C4 | 统计年鉴 | ||
| 自我就业率(%)C5 | (城乡私营人数+个体就业人数)/就业总人数 | ||
| 观察变量 | GDP增长率(%)C6 | 当年实际GDP/上年实际GDP-1 | |
| 劳动参与率(%)C7 | 就业总人数/经济活动人口数(15~64岁的人口数) | ||
| 绿色创新效率 | 绿色创新投入 | R&D经费(亿元)C8 | 统计年鉴 |
| R&D人员全时当量(人年)C9 | 统计年鉴 | ||
| 期望产出 | 专利申请数(件)C10 | 统计年鉴 | |
| 新产品产值(万元)C11 | 统计年鉴 | ||
| 非期望产出 | 工业SO2排放量(万t)C12 | 统计年鉴 | |
| 工业烟(粉)尘排放量(万t)C13 | 统计年鉴 |
注:以上指标数据来源于中国经济与社会发展统计数据库和湖南省统计局等,由于湘西土家族苗族自治州指标数据缺失较多,故未纳入上述评价指标体系。 |
表2 变量描述性统计Tab.2 Variable descriptive statistics |
| 变量 | 样本量 | 均值 | 方差 | 最小值 | 最大值 |
|---|---|---|---|---|---|
| SE | 221 | 0.079 | 0.035 | 0.020 | 0.200 |
| IN | 221 | 0.314 | 0.265 | 0.020 | 1.000 |
| TRA | 221 | 0.857 | 0.422 | 0.211 | 1.844 |
| EDU | 221 | 8.811 | 1.229 | 5.696 | 11.926 |
| FDI | 221 | 0.027 | 0.021 | 0.003 | 0.126 |
| IND | 221 | 0.419 | 0.100 | 0.211 | 0.605 |
| UR | 221 | 0.404 | 0.111 | 0.196 | 0.760 |
| GOV | 221 | 3.864 | 1.184 | 1.432 | 6.289 |
表3 门槛效应检验Tab.3 Threshold effect test |
| 门槛变量 | 门槛类型 | F值 | P值 | Bootsrop次数 | 不同显著水平临界值 | ||
|---|---|---|---|---|---|---|---|
| 10% | 5% | 1% | |||||
| SE | 单一门槛 | 19.78** | 0.0190 | 1000 | 12.9317 | 15.6910 | 20.9170 |
| 双重门槛 | 25.47** | 0.0330 | 1000 | 16.2697 | 21.7704 | 36.6245 | |
| 三重门槛 | 10.07 | 0.4220 | 1000 | 27.3238 | 35.2717 | 54.1828 | |
注:P值和临界值为采用Bootstrap“自抽样”法反复抽样1 000次得到的结果。***、**、*分别表示在1%、5%、10%水平上显著,下表同。 |
表4 门槛值估计结果Tab.4 Estimation result of threshold value |
| 门槛变量 | 检验 | 门槛估计值 | 95%置信区间 |
|---|---|---|---|
| SE | 第一个门槛值 | 0.1400 | [0.1300,0.1500] |
| 第二个门槛值 | 0.1700 | [0.1550,0.1850] |
表5 影子经济门槛模型估计结果Tab.5 Estimation results of shadow economic based on threshold model |
| 变量 | 被解释变量:绿色创新(IN) | ||
|---|---|---|---|
| 低SE (SE≤0.1400) | 中等SE (0.1400<SE≤0.1700) | 高SE (SE>0.1700) | |
| SE | -1.5052*** (0.3947 ) | 2.5841*** (0.3685) | -0.6287 (0.4169) |
| TRA | 0.0268 (0.0420) | 0.0247 (0.0387) | 0.0588 (0.0428) |
| EDU | 0.0625** (0.0273) | 0.0210 (0.0253) | 0.0400 (0.0281) |
| FDI | 1.3912 (0.8706) | 1.8934** (0.8120) | 0.8861 (0.8886) |
| IND | 0.7272** (0.3250) | 0.9323*** (0.3028) | 0.7776** (0.3353) |
| UR | 2.0342*** (0.3022) | 2.1873*** (0.2795) | 2.2935*** (0.3274) |
| GOV | -0.0427* (0.0230) | -0.0562*** (0.0208) | -0.0718*** (0.0238) |
| _cons | -1.1512*** (0.1494) | -1.0104*** (0.1387) | -1.0838*** (0.1536) |
| R-square | 0.6667 | 0.7129 | 0.6466 |
注:括号内为标准误差,下表同。 |
表6 影子经济稳健性检验结果Tab.6 Stability test results of shadow economic |
| 变量 | RE | ||
|---|---|---|---|
| 低RE (RE≤0.1400) | 中等RE (0.1400<RE≤0.1700) | 高RE (RE>0.1700) | |
| _cons | -0.6374*** (0.1717) | -0.5294*** (0.1629) | -0.5712*** (0.1740) |
| L.RE | -1.0368** (0.5110) | 2.6283*** (0.4929) | -0.2724 (0.5184) |
| Xi | 控制 | 控制 | 控制 |
| Wald | 207.3500 | 261.8900 | 195.6100 |
| R-square | 0.6193 | 0.6586 | 0.6107 |
| 样本容量 | 221 | 221 | 221 |
| [1] |
黄寿峰. 环境规制、影子经济与雾霾污染——动态半参数分析[J]. 经济学动态, 2016(11):33-44.
|
| [2] |
吴超, 杨树旺, 唐鹏程, 等. 中国重污染行业绿色创新效率提升模式构建[J]. 中国人口·资源与环境, 2018, 28(5):40-48.
|
| [3] |
刘佳, 宋秋月. 中国旅游产业绿色创新效率的空间网络结构与形成机制[J]. 中国人口·资源与环境, 2018, 28(8):127-137.
|
| [4] |
|
| [5] |
|
| [6] |
华振. 中国绿色创新绩效研究——与东北三省的比较分析[J]. 技术经济, 2011, 30(7):30-34,41.
|
| [7] |
付帼, 卢小丽, 武春友. 中国省域绿色创新空间格局演化研究[J]. 中国软科学, 2016(7):89-99.
|
| [8] |
朱承亮, 刘瑞明, 王宏伟. 专利密集型产业绿色创新绩效评估及提升路径[J]. 数量经济技术经济研究, 2018, 35(4):61-79.
|
| [9] |
钱丽, 王文平, 肖仁桥. 共享投入关联视角下中国区域工业企业绿色创新效率差异研究[J]. 中国人口·资源与环境, 2018, 28(5):27-39.
|
| [10] |
杨朝均, 杨文珂, 赵梓霖. 中国区域绿色创新影响因素研究[J]. 华东经济管理, 2018, 32(9):95-102.
|
| [11] |
|
| [12] |
|
| [13] |
|
| [14] |
李永海, 孙群力. 税收负担、政府管制对地区隐性经济的影响研究[J]. 广东财经大学学报, 2016, 31(2):88-100.
|
| [15] |
张曾莲, 盖亚洁. 财政透明度、税收负担与隐性经济规模——基于2006—2014年省级面板数据的实证分析[J]. 山西财经大学学报, 2018, 40(7):16-31.
|
| [16] |
|
| [17] |
余长林, 高宏建. 环境管制对中国环境污染的影响——基于隐性经济的视角[J]. 中国工业经济, 2015(7):21-35.
|
| [18] |
|
| [19] |
戚磊. 隐性经济产业关联的生产率效应[J]. 中国工业经济, 2013(11):70-82.
|
| [20] |
杨灿明, 孙群力. 中国各地区隐性经济的规模、原因和影响[J]. 经济研究, 2010, 45(4):93-106.
|
| [21] |
彭文斌, 文泽宙, 邝嫦娥. 中国城市绿色创新空间格局及其影响因素[J]. 广东财经大学学报, 2019, 34(1):25-37.
|
| [22] |
李金昌, 徐蔼婷. 未被观测经济估算方法新探[J]. 统计研究, 2005(11):21-26.
|
| [23] |
|
| [24] |
周锐波, 刘叶子, 杨卓文. 中国城市创新能力的时空演化及溢出效应[J]. 经济地理, 2019, 39(4):85-92.
|
| [25] |
彭星, 李斌. 不同类型环境规制下中国工业绿色转型问题研究[J]. 财经研究, 2016, 42(7):134-144.
|
/
| 〈 |
|
〉 |