
The Relationship between Geographical Concentration of Researchers and Regional Innovation in China
Received date: 2018-10-06
Revised date: 2019-04-12
Online published: 2025-04-27
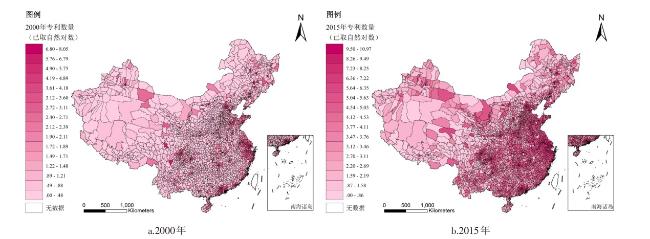
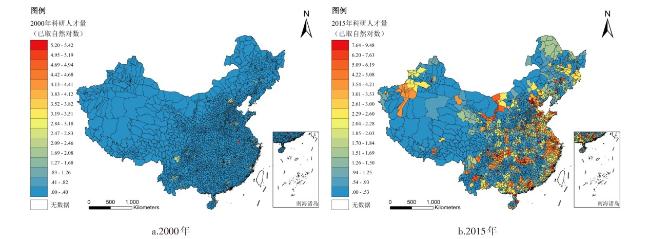
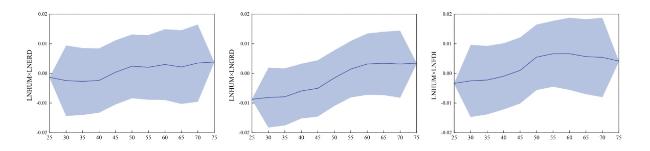
Regional innovation depends on not only the amount of technological investment but also the absorptive capacity of regional human capital. Based on county-level patent statistics and through the theoretical lens of absorptive capacity, this article analyzes the relationship between geographical concentration of researchers and regional innovation outputs in China with the aid a panel quantile regression approach. Results show that the spatial patterns of regional innovation outputs and scientific researchers are both in tremendous inequality in China. Besides, the influencing factors of regional innovation also vary with urban innovation levels. Additionally, the agglomeration of researchers exerts positive moderating effects on other influencing factors in high-output regions. To be specific, the absorptive capacity of scientific researchers raises the effects of corporate R&D expenditure, government R&D expenditure and FDI only in high-output cities. This suggests that in China the geographical concentration of researchers surprisingly serves as an enhancer only for high-output cities and thus it reinforces the spatial inequality of innovation.
LIU Ye , ZENG Jingyuan , WANG Ruoyu , ZHAN Peiyu , PAN Zhuolin . The Relationship between Geographical Concentration of Researchers and Regional Innovation in China[J]. Economic geography, 2019 , 39(7) : 139 -147 . DOI: 10.15957/j.cnki.jjdl.2019.07.016
表1 知识吸收能力的测度综述Tab.1 Measurement of knowledge absorptive capacity |
| 作者 | 研究对象 | 测度 |
|---|---|---|
| 企业层面知识吸收能力研究综述 | ||
| Cohen等(1990) | 来自318个企业的1 719个部门或组织 | 企业R&D投资强度 |
| Veugelers(1997) | 290个佛兰德科技公司 | R&D部门的全职员工数 |
| Lane等(1998) | 69个科技联盟和22个生物科技企业 | 使用企业量表测度 |
| Liu等(1997) | 来自29个制造业产业细类中业的145个企业 | R&D研发人员的投入量 |
| 区域层面知识吸收能力研究综述 | ||
| Keller(1996) | 宏观经济推演 | 科学家和工程师数量;高等教育人口中工程学学生的数量;总人口中科学家和工程师占比 |
| Borensztein等(1998) | 1970—1989年经济合作与发展组织(OECD)国家 | 受教育水平 |
| Roper等(2006) | 215个欧洲地区(NUTS2) | 高素质劳动力数量 |
| Saito等(2011) | 1998—2003年智利342个县级地理单元 | 高技能工人数量 |
| Yang等(2012) | 1997—2007年中国31个省份 | 平均受教育水平 |
| Qian(2017) | 美国大都市区(MSAs) | 人力资本知识存量 |
| Jung(2017) | 1999—2008年215个欧洲地区 | 高学历人才占比 |
注:本研究主要关注区域层面的知识吸收能力作用,故因此主要总结区域知识吸收能力测度。 |
表2 变量基本统计信息Tab.2 Statistics of the variables |
| 类别 | 变量名称 | 单位 | 变量标签 | 样本数 | 均值 | 标准差 |
|---|---|---|---|---|---|---|
| 因变量 | 专利数量(对数) | 个 | lnPAT | 1 722 | 2 228.51 | 8 192.76 |
| 关键变量 | 企业R&D投入(对数) | 万元 | lnERD | 1 722 | 838 969.50 | 3 215 711.00 |
| 政府R&D投入(对数) | 万元 | lnGRD | 1 722 | 23 780.29 | 113 021.90 | |
| 外商投资(对数) | 万美元 | lnFDI | 1 722 | 46 805.48 | 112 176.90 | |
| 科研人才量(对数) | 人 | lnHUM | 1 722 | 630.14 | 2 802.04 | |
| 控制变量 | 专业化集聚度(对数) | 人/km2 | lnMAD | 1 722 | 9.40 | 21.02 |
| 多元化集聚度(对数) | 人/km2 | lnJAD | 1 722 | 33.99 | 75.37 | |
| 总人口数(对数) | 万人 | lnPOP | 1 722 | 428.27 | 315.21 |
表3 面板分位数回归结果Tab.3 The results of panel quantile regression estimation |
| 模型(1): 关键变量 | 模型(2):关键变量+控制变量 | 模型(3):关键变量+控制变量+调节效应Ⅰ | 模型(4):关键变量+控制变量+调节效应Ⅱ | 模型(5):关键变量+控制变量+调节效应Ⅲ | ||||||||||||
|---|---|---|---|---|---|---|---|---|---|---|---|---|---|---|---|---|
| 25% | 50% | 75% | 25% | 50% | 75% | 25% | 50% | 75% | 25% | 50% | 75% | 25% | 50% | 75% | ||
| lnERD | 0.068*** | 0.069*** | 0.080** | 0.066*** | 0.070*** | 0.078*** | 0.070*** | 0.056** | 0.065*** | 0.070*** | 0.072*** | 0.075*** | 0.069*** | 0.070*** | 0.072*** | |
| (0.01) | (0.01) | (0.04) | (0.02) | (0.01) | (0.03) | (0.00) | (0.03) | (0.00) | (0.00) | (0.02) | (0.00) | (0.00) | (0.02) | (0.00) | ||
| lnFDI | 0.051*** | 0.070*** | 0.078*** | 0.053*** | 0.061*** | 0.077*** | 0.051*** | 0.058*** | 0.074*** | 0.052*** | 0.057*** | 0.078*** | 0.067*** | 0.039* | 0.062*** | |
| (0.00) | (0.01) | (0.01) | (0.01) | (0.01) | (0.02) | (0.00) | (0.02) | (0.00) | (0.00) | (0.02) | (0.00) | (0.00) | (0.02) | (0.00) | ||
| lnGRD | 0.164*** | 0.149*** | 0.126*** | 0.164*** | 0.153*** | 0.120*** | 0.163*** | 0.149*** | 0.122*** | 0.210*** | 0.161*** | 0.107*** | 0.163*** | 0.145*** | 0.119*** | |
| (0.02) | (0.01) | (0.04) | (0.02) | (0.01) | (0.03) | (0.00) | (0.02) | (0.00) | (0.00) | (0.03) | (0.00) | (0.00) | (0.02) | (0.00) | ||
| lnHUM | 0.743*** | 0.728*** | 0.725*** | 0.739*** | 0.719*** | 0.720*** | 0.759*** | 0.696*** | 0.664*** | 0.804*** | 0.730*** | 0.685*** | 0.773*** | 0.672*** | 0.681*** | |
| (0.06) | (0.02) | (0.05) | (0.03) | (0.02) | (0.02) | (0.00) | (0.07) | (0.00) | (0.00) | (0.05) | (0.00) | (0.00) | (0.06) | (0.00) | ||
| lnMAD | 0.0280 | 0.027 | 0.077 | 0.026*** | 0.0300 | 0.071*** | 0.023*** | 0.039 | 0.071*** | 0.030*** | 0.027 | 0.081*** | ||||
| (0.06) | (0.02) | (0.11) | (0.00) | (0.04) | (0.00) | (0.00) | (0.05) | (0.00) | (0.00) | (0.05) | (0.00) | |||||
| lnJAD | 0.169 | 0.170** | 0.293 | 0.179*** | 0.171 | 0.282*** | 0.170*** | 0.198 | 0.281*** | 0.176*** | 0.172 | 0.292*** | ||||
| (0.24) | (0.08) | (0.45) | (0.00) | (0.12) | (0.00) | (0.00) | (0.12) | (0.00) | (0.00) | (0.12) | (0.00) | |||||
| lnPOP | 0.0430 | 0.092 | 0.124 | 0.044*** | 0.098 | 0.130*** | 0.025*** | 0.088 | 0.131*** | 0.039*** | 0.105 | 0.132*** | ||||
| (0.06) | (0.08) | (0.23) | (0.00) | (0.08) | (0.00) | (0.00) | (0.08) | (0.00) | (0.00) | (0.08) | (0.00) | |||||
| lnHUM×lnERD | -0.001*** | 0.002 | 0.004*** | |||||||||||||
| (0.00) | (0.01) | (0.00) | ||||||||||||||
| lnHUM×lnGRD | -0.009*** | -0.002 | 0.003*** | |||||||||||||
| (0.00) | (0.00) | (0.00) | ||||||||||||||
| lnHUM×lnFDI | -0.003*** | 0.005 | 0.004*** | |||||||||||||
| (0.00) | (0.01) | (0.00) | ||||||||||||||
| 城市固定效应 | Yes | Yes | Yes | Yes | Yes | Yes | Yes | Yes | Yes | Yes | Yes | Yes | Yes | Yes | Yes | |
| 样本量 | 1 722 | 1 722 | 1 722 | 1 722 | 1 722 | 1 722 | 1 722 | 1 722 | 1 722 | 1 722 | 1 722 | 1 722 | 1 722 | 1 722 | 1 722 | |
| Pseudo R2 | 0.821 | 0.811 | 0.829 | 0.821 | 0.811 | 0.830 | 0.821 | 0.811 | 0.830 | 0.821 | 0.811 | 0.830 | 0.821 | 0.811 | 0.830 | |
注:*p<0.1,**p<0.05,***p<0.01;“25%”代表25%分位数模型,“50%”代表50%分位数模型,“75%”代表75%分位数模型;括号内为标准误。 |
| [1] |
|
| [2] |
|
| [3] |
A Lund Vinding. Absorptive capacity and innovative perfor-mance:A human capital approach[J]. Economics of Innovation and New Technology, 2006, 15(4-5):507-517.
|
| [4] |
|
| [5] |
|
| [6] |
|
| [7] |
|
| [8] |
|
| [9] |
|
| [10] |
|
| [11] |
|
| [12] |
|
| [13] |
|
| [14] |
|
| [15] |
|
| [16] |
|
| [17] |
|
| [18] |
|
| [19] |
|
| [20] |
|
| [21] |
柳卸林, 胡志坚. 中国区域创新能力的分布与成因[J]. 科学学研究, 2002, 20(5):550-556.
|
| [22] |
范斐, 杜德斌, 李恒, 等. 中国地级以上城市科技资源配置效率的时空格局[J]. 地理学报, 2013, 68(10):1 331-1 343.
|
| [23] |
方创琳, 马海涛, 王振波, 等. 中国创新型城市建设的综合评估与空间格局分异[J]. 地理学报, 2014, 69(4):459-473.
|
| [24] |
李国平, 王春杨. 我国省域创新产出的空间特征和时空演化——基于探索性空间数据分析的实证[J]. 地理研究, 2012, 31(1):95-106.
|
| [25] |
王秋玉, 曾刚, 吕国庆. 中国装备制造业产学研合作创新网络初探[J]. 地理学报, 2016, 71(2):251-264.
|
| [26] |
李丹丹, 汪涛, 魏也华, 等. 中国城市尺度科学知识网络与技术知识网络结构的时空复杂性[J]. 地理研究, 2015, 34(3):525-540.
|
| [27] |
吕国庆, 曾刚, 郭金龙. 长三角装备制造业产学研创新网络体系的演化分析[J]. 地理科学, 2014, 34(9):1 051-1 059.
|
| [28] |
周灿, 曾刚, 曹贤忠. 中国城市创新网络结构与创新能力研究[J]. 地理研究, 2017, 36(7):1 297-1 308.
|
| [29] |
曹广喜. FDI对中国区域创新能力溢出效应的实证研究——基于动态面板数据模型[J]. 经济地理, 2009, 40(6):894-899.
|
| [30] |
程叶青, 王哲野, 马靖. 中国区域创新的时空动态分析[J]. 地理学报, 2014, 69(12):1 779-1 789.
|
| [31] |
谭俊涛, 张平宇, 李静. 中国区域创新绩效时空演变特征及其影响因素研究[J]. 地理科学, 2016, 36(1):39-46.
|
| [32] |
王俊松, 颜燕, 胡曙虹. 中国城市技术创新能力的空间特征及影响因素——基于空间面板数据模型的研究[J]. 地理科学, 2017, 37(1):11-18.
|
| [33] |
方远平, 谢蔓. 创新要素的空间分布及其对区域创新产出的影响——基于中国省域的ESDA-GWR分析[J]. 经济地理, 2012, 32(9):8-14.
|
| [34] |
刘炜, 李郇, 欧俏珊. 产业集群的非正式联系及其对技术创新的影响——以顺德家电产业集群为例[J]. 地理研究, 2013, 32(3):518-530.
|
| [35] |
王丰龙, 曾刚, 周灿, 等. 中国地方政府科技财政支出对企业创新产出的影响研究——来自工业企业数据库的证据[J]. 地理科学, 2017, 37(11):1 632-1 639.
|
| [36] |
朱勇, 张宗益. 技术创新对经济增长影响的地区差异研究[J]. 中国软科学, 2005,(11):92-98.
|
| [37] |
|
| [38] |
赖明勇, 包群, 彭水军, 等. 外商直接投资与技术外溢:基于吸收能力的研究[J]. 经济研究, 2005(8):95-105.
|
| [39] |
|
| [40] |
|
| [41] |
|
| [42] |
|
| [43] |
|
| [44] |
|
| [45] |
何舜辉, 杜德斌, 焦美琪, 等. 中国地级以上城市创新能力的时空格局演变及影响因素分析[J]. 地理科学, 2017, 37(7):1 014-1 022.
|
| [46] |
|
| [47] |
魏守华, 吴贵生, 吕新雷. 区域创新能力的影响因素——兼评我国创新能力的地区差距[J]. 中国软科学, 2010, 2010(9):76-85.
|
| [48] |
|
| [49] |
吕拉昌, 李勇. 基于城市创新职能的中国创新城市空间体系[J]. 地理学报, 2010, 65(2):177-190.
|
/
| 〈 |
|
〉 |