
Spatial-Temporal Characteristics of Average Education Expenditure in Local Ordinary Higher Education in China
Received date: 2018-06-27
Revised date: 2018-09-29
Online published: 2025-04-27
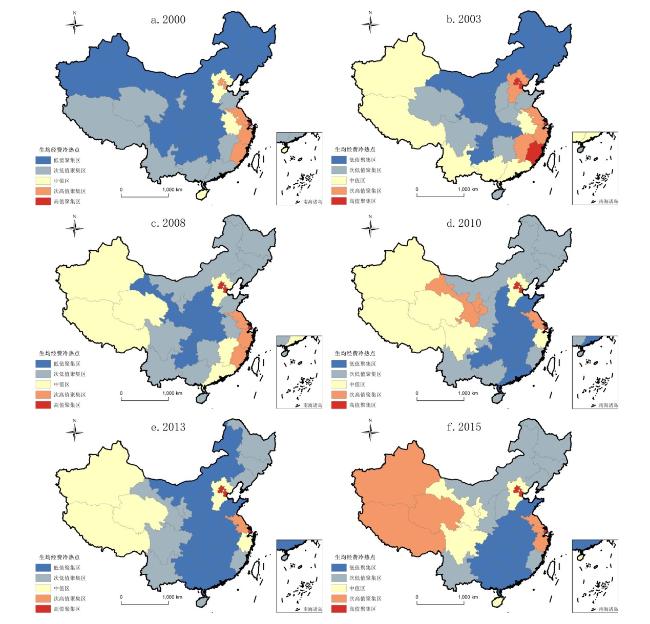
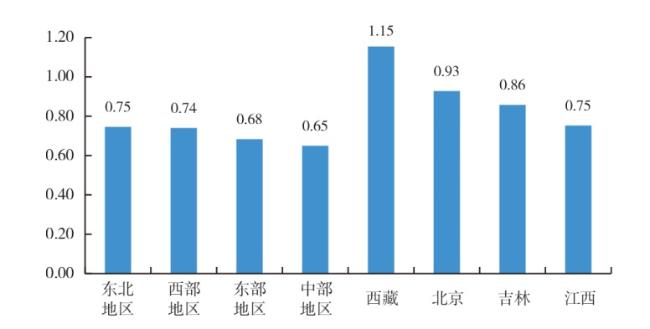
As an important component of education resources, the average education expenditure of local ordinary higher education is an important indicator to reflect the fairness of education. Based on provincial panel data from 1998 to 2015, this paper explores features of the average education expenditure of China local ordinary higher education from two aspects of nominal growth and actual growth rate analysis and analyzes its trajectory of gravity center and distribution applying the spatial gravity center model and spatial autocorrelation method. Research shows that: 1) In time series, the average education expenditure of local ordinary higher education in China has maintained a growth momentum, and is lower in central China than the eastern and western. At the same time, the growth rate of per capita expenditure is fluctuating greatly every year, and the nominal growth rate is mostly greater than the actual growth rate. 2) In terms of space, the shift of the gravity center of the average education expenditure in China's local ordinary higher education shows an unbalanced feature, most of them shift level by level. Over time, the provinces with low per capita expenditure level have increased, and the vast majority of provinces in the central region are in low-level and sub-low-level areas, and it shows the characteristics of “ sinking central region” in average education expenditure;3) The hot spots of the average education expenditure of the local ordinary higher education in China are mainly distributed in the eastern region, and the cold spots are mainly distributed in the northeast and central regions. On the basis of the above, we should establish a long-term investment mechanism for local ordinary higher education in the central and western regions, encourage social funds to enter the local general higher education sector, and improve central financial transfer payments system.
LI Qiong , LI Xiaoqiu , ZHANG Lanlan , WU Xiongzhou . Spatial-Temporal Characteristics of Average Education Expenditure in Local Ordinary Higher Education in China[J]. Economic geography, 2019 , 39(2) : 48 -57 . DOI: 10.15957/j.cnki.jjdl.2019.02.006
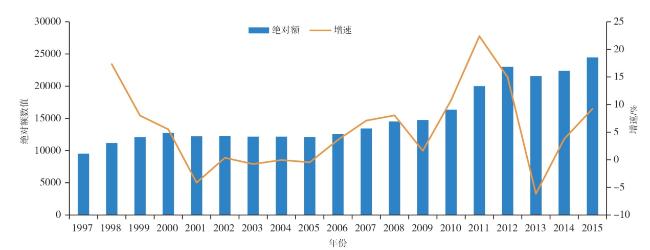
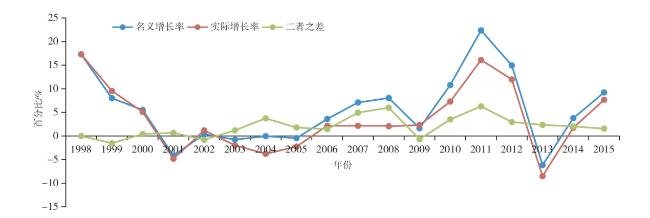
表1 1998—2015年地方普通高等生均教育经费及其增长率Tab.1 Local general higher education expenditure and its growth rate from 1998 to 2015 |
| 年份 | 可变价格 /元 | 增长率 /% | CPI(以上 年为基期) | GPI(以1998年为基期) | 不变价格 /元 | 增长率 /% |
|---|---|---|---|---|---|---|
| 1998 | 11 182 | 17.32 | 99.2 | 100.0 | 11 182 | 17.32 |
| 1999 | 12 078 | 8.01 | 98.6 | 98.6 | 12 249 | 9.54 |
| 2000 | 12 743 | 5.51 | 100.4 | 99.0 | 12 872 | 5.09 |
| 2001 | 12 216 | -4.14 | 100.7 | 99.7 | 12 253 | -4.81 |
| 2002 | 12 262 | 0.37 | 99.2 | 98.9 | 12 398 | 1.18 |
| 2003 | 12 167 | -0.77 | 101.2 | 100.1 | 12 154 | -1.97 |
| 2004 | 12 163 | -0.04 | 103.9 | 104.0 | 11 695 | -3.78 |
| 2005 | 12 107 | -0.46 | 101.8 | 105.9 | 11 432 | -2.25 |
| 2006 | 12 544 | 3.61 | 101.5 | 107.4 | 11 680 | 2.17 |
| 2007 | 13 436 | 7.10 | 104.8 | 112.6 | 11 933 | 2.16 |
| 2008 | 14 517 | 8.05 | 105.9 | 119.2 | 12 178 | 2.05 |
| 2009 | 14 754 | 1.64 | 99.3 | 118.4 | 12 461 | 2.32 |
| 2010 | 16 349 | 10.81 | 103.3 | 122.3 | 13 368 | 7.29 |
| 2011 | 20 009 | 22.38 | 105.4 | 128.9 | 15 522 | 16.11 |
| 2012 | 23 000 | 14.95 | 102.6 | 132.3 | 17 384 | 11.99 |
| 2013 | 21 584 | -6.16 | 102.6 | 135.7 | 15 905 | -8.51 |
| 2014 | 22 399 | 3.78 | 102.0 | 138.4 | 16 184 | 1.75 |
| 2015 | 22 465 | 9.23 | 101.4 | 140.4 | 17 425 | 7.67 |
表2 1998—2015 地方普通高等教育生均经费全局Moran's I分析结果Tab.2 Moran's I nalysis of the average per capita expenditure for local general higher education in 1998-2015 |
| 年份 | Moran’s I指数 | Z得分 | P值 | 空间格局 |
|---|---|---|---|---|
| 1998 | 0.1551 | 1.6390 | 0.0900 | |
| 1999 | 0.1118 | 1.2751 | 0.2022 | |
| 2000 | 0.1851 | 0.1880 | 0.0600 | 聚集 |
| 2001 | 0.1315 | 1.4224 | 0.1548 | |
| 2002 | 0.0866 | 1.0808 | 0.2797 | |
| 2003 | 0.1696 | 1.7617 | 0.0781 | 聚集 |
| 2004 | 0.1483 | 1.6186 | 0.1055 | 聚集 |
| 2005 | 0.0870 | 1.1099 | 0.2670 | |
| 2006 | 0.1128 | 1.2959 | 0.1949 | |
| 2007 | 0.1079 | 1.2456 | 0.2128 | |
| 2008 | 0.1657 | 1.7706 | 0.0766 | 聚集 |
| 2009 | 0.1295 | 1.5676 | 0.1169 | |
| 2010 | 0.2177 | 2.4411 | 0.1460 | 聚集 |
| 2011 | 0.1254 | 2.4509 | 0.0177 | 聚集 |
| 2012 | 0.2174 | 2.5150 | 0.0119 | 聚集 |
| 2013 | 0.2046 | 2.2832 | 0.0224 | 聚集 |
| 2014 | 0.2126 | 2.3821 | 0.0172 | 聚集 |
| 2015 | 0.1536 | 1.7460 | 0.0808 | 聚集 |
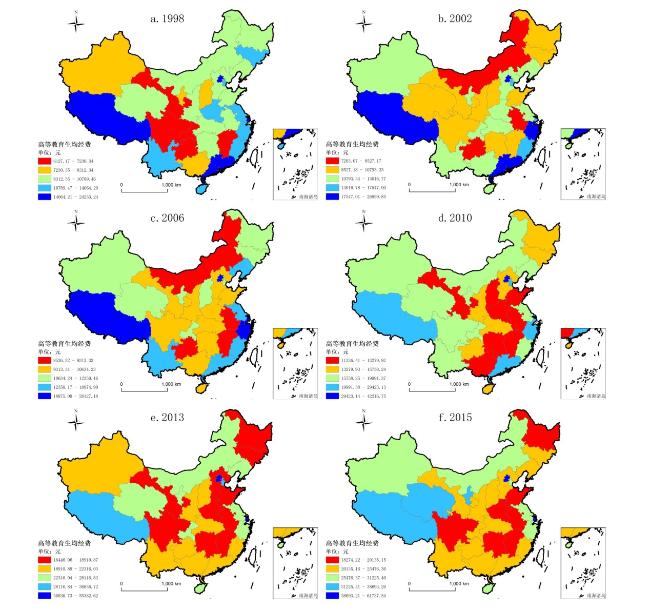
表3 中国地方普通高等教育生均经费空间演变情况Tab.3 Type of average education expenditure for local general higher education in China |
| 类型 | 1998 | 2002 | 2006 | 2010 | 2013 | 2015 |
|---|---|---|---|---|---|---|
| 高水平 | 北京、上海、广东、西藏(4) | 北京、浙江、广东、西藏(4) | 北京、浙江、上海、西藏(4) | 北京(1) | 北京、上海(2) | 北京、上海(2) |
| 次高水平 | 吉林、天津、江苏、浙江、河南、福建、云南、南(8) | 福建、上海、天津(3) | 辽宁、江苏、福建、广东、云南(5) | 天津、上海、广东、浙江、西藏(5) | 天津、西藏(2) | 西藏、青海、宁夏(3) |
| 中等水平 | 黑龙江、内蒙古、辽宁、河北、山东、陕西、安徽、湖北、湖南、青海(10) | 辽宁、河北、河南、江苏、重庆、云南、新疆、广西、宁夏、海南、湖北(11) | 黑龙江、吉林、天津、山西、重庆、宁夏、新疆、青海(8) | 内蒙古、辽宁、新疆、青海、宁夏、四川、重庆、云南、江苏、福建(10) | 内蒙古、辽宁、江苏、浙江、宁夏、重庆、青海、海南(8) | 贵州、天津、山西江苏、浙江、新疆、广东、海南(8) |
| 次低水平 | 新疆、宁夏、广西、山西(4) | 黑龙江、吉林、山西、山东、陕西、甘肃、青海、江西、四川、湖南、(10) | 河北、山东、陕西、河南、湖南、湖北、甘肃、四川、广西、海南(10) | 黑龙江、吉林、河北、湖北、陕西、贵州、海南(7) | 新疆、山西、陕西、湖北、贵州、广西、福建、广东、云南(9) | 内蒙古、吉林、辽宁、河北、陕西、甘肃、湖北、重庆、云南、广西、福建(11) |
| 低水平区 | 甘肃、重庆、四川、贵州、江西(5) | 贵州、内蒙古、安徽(3) | 贵州、内蒙古、安徽、江西(4) | 山西、山东、河南、安徽、湖南、江西、甘肃、广西(8) | 黑龙江、吉林、河北、山东、河南、安徽、甘肃、江西、湖南、四川(10) | 黑龙江、山东、安徽、河南、江西、湖南、四川(7) |
| [1] |
游小, 赵光龙, 杜德斌, 等. 中国高等教育经费投入空间格局及形成机理研究[J]. 地理科学, 2016, 36(2):180-187.
|
| [2] |
岳昌君. 1998—2011年间高校生均经费的地区差异分析[J]. 中国高教研究, 2013(7):42-47.
|
| [3] |
夏焰, 崔玉平. 中国省际高等教育资源的优化配置——基于生均经费支出差异及收敛的实证分析[J]. 教育发展研究, 2014(5):13-18,84.
|
| [4] |
孙凯, 张劲英. 高等教育生均经费支出差异研究——基于1999—2008年省际面板数据分析[J]. 现代教育管理, 2014(5):25-29.
|
| [5] |
王奔, 晏艳阳. 我国生均教育经费支出的省际差异及其影响因素[J]. 经济地理, 2017, 37(2):39-45.
|
| [6] |
于伟, 张鹏. 我国高校生均经费支出省际差异的再分析——基于shapley值分解的方法[J]. 北京大学教育评论, 2015, 13(2):97-107+190.
|
| [7] |
方芳, 刘泽云. 普通高校经费收入结构对生均经费的影响[J]. 高等教育研究, 2017, 38(3):56-64.
|
| [8] |
严全治, 余沛, 田虎伟. 省域地方普通高校生均教育经费支出的时空演变特征和影响因素[J]. 高等教育研究, 2016, 37(7):27-32.
|
| [9] |
刘华军, 张权, 杨骞. 中国高等教育资源空间分布的非均衡与极化研究[J]. 教育发展研究, 2013(9):1-7.
|
| [10] |
肖智, 黄贤金, 孟浩, 等. 2009—2014年中国茶叶生产空间演变格局及变化特征[J]. 地理研究, 2017, 36(1):109-120.
|
| [11] |
李美芳, 欧金沛, 黎夏. 基于地理信息系统的2009—2013年甲型H1N1流感的时空分析[J]. 地理研究, 2016, 35(11):2 139-2 152.
|
| [12] |
韩增林, 李彬, 张坤领. 中国城乡基本公共服务均等化及其空间格局分析[J]. 地理研究, 2015, 34(11):2 035-2 048.
|
| [13] |
张松林, 张昆. 局部空间自相关指标对比研究[J]. 统计研究, 2007, 24(7):65-67.
|
/
| 〈 |
|
〉 |
