
The Calculation Method and Spatial Pattern of International Container Production in Chinese Provinces
Received date: 2018-01-09
Revised date: 2018-10-12
Online published: 2025-04-27
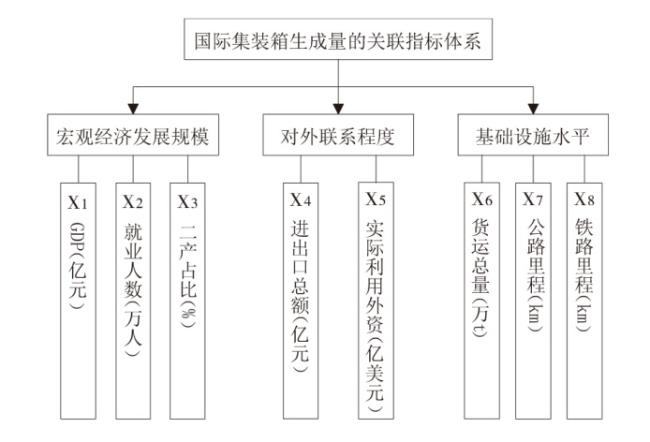
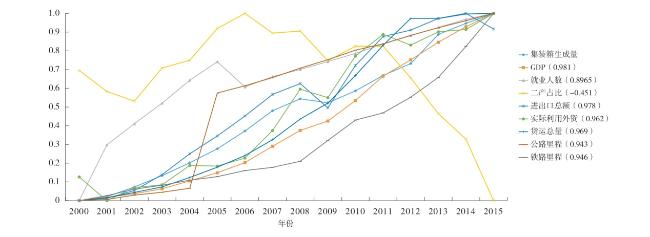
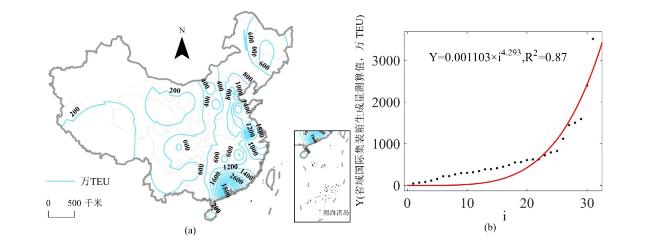
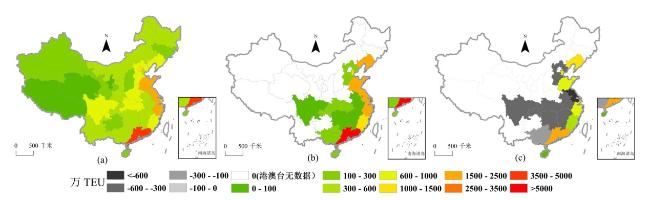
This paper establishes an index system with different categories, and selects GDP and the total volume of import and export as the independent variables to establish the binary linear equation to fit the international container production of China according to the statistical nature and research needs. On that basis, data of 2015 GDP and total imports and exports of the provinces are plugged into the equation of bivariate linear regression to measure the international container production of different provinces. The following conclusions are mainly drawn. 1)The spatial distribution of the measured value of the international container production in the province shows a characteristics of serious polarization. The high-value areas are mainly located in Shandong, Jiangsu, Shanghai, Zhejiang and Guangdong, and the low-value areas are mainly located in Tibet, Xinjiang and Qinghai. 2)The actual capacity of containers in most part of ports cannot meet the international container production generated by its foreign trade, and goods still need to be packed off in ports of the eastern coast. 3)The distribution of container center station in planning and construction is generally in line with the spatial pattern of the measured value of international container production, but capacity is still limited, infrastructure construction should be strengthened to improve transport efficiency and reduce transport costs.
LU Mengqiu , LI Enkang , LU Yuqi , CHEN Yu . The Calculation Method and Spatial Pattern of International Container Production in Chinese Provinces[J]. Economic geography, 2019 , 39(2) : 118 -123 . DOI: 10.15957/j.cnki.jjdl.2019.02.014
表1 三个方程各自变量的回归系数与p值Tab.1 The regression coefficient and p value of each variable in three equations |
| 变量 | 方程1的回归系数(p值) | 方程2的回归系数(p值) | 方程3的回归系数(p值) |
|---|---|---|---|
| GDP(X1) | 0.0456(0.02281) | 0.0360(0.00003) | 0.0162(0.00115) |
| 进出口总额(X4) | 0.0331(0.02147) | 0.0534(0.00002) | 0.0363(0.00271) |
| 实际利用外资(X5) | -0.8713(0.77552) | - | - |
| 货运总量(X6) | -0.0051(0.01135) | -0.0049(0.00166) | - |
| 公路里程(X7) | 0.0010(0.05127) | - | - |
| 铁路里程(X8) | -0.0609(0.53835) | - | - |
| R2 | 0.9951 | 0.9921 | 0.9815 |
| [1] |
王成金, César Ducruet. 现代集装箱港口体系演进理论与实证[J]. 地理研究, 2011, 30(3):397-410.
|
| [2] |
曹有挥, 曹卫东, 金世胜, 等. 中国沿海集装箱港口体系的形成演化机理[J]. 地理学报, 2003(3):424-432.
|
| [3] |
刘志敏. 港口群腹地出口集装箱生成量影响因素及模型研究[D]. 广州: 华南理工大学, 2012.
|
| [4] |
路成章, 李亚茹. 天津港1990—2000年国际集装箱吞吐量预测[J]. 公路交通科技, 1985(2):57-62.
|
| [5] |
王普勇, 李德芳. 基于灰色系统的新亚欧大陆桥国际集装箱运量预测[J]. 上海铁道大学学报, 1997(1):75-82.
|
| [6] |
许继琴, 楼朝明. 长江经济带国际集装箱生成量预测[J]. 宁波大学学报:人文科学版, 1997(2):58-62.
|
| [7] |
张华勤. 我国港口集装箱运输发展预测研究[D]. 武汉: 武汉理工大学, 2002.
|
| [8] |
杜桂玲. 长江沿线外贸集装箱生成量影响因素分析及生成量预测[D]. 上海: 上海海事大学, 2005.
|
| [9] |
叶剑. 基于聚类分析的港口集装箱吞吐量预测方法的研究[D]. 大连: 大连理工大学, 2005.
|
| [10] |
万征. 深圳港集装箱货源及运输系统状况分析和趋势预测[J]. 交通运输系统工程与信息, 2006(4):130-135.
|
| [11] |
刘慧琴. 对全国港口和上海港集装箱吞吐量的预测[J]. 集装箱化, 1995(11):24-28.
|
| [12] |
王超. 组合预测模型在集装箱生成量预测中的应用研究[D]. 合肥: 合肥工业大学, 2009.
|
| [13] |
李明伟. 混沌云粒子群混合优化算法及其在港口管理中的应用研究[D]. 大连: 大连理工大学, 2013.
|
| [14] |
马锡超, 王璇, 李海锋. 基于组合模型的港口集装箱吞吐量预测[J]. 交通标准化, 2009(Z1):74-77.
|
| [15] |
朱昌锋. 铁路集装箱运量组合预测方法研究[J]. 兰州交通大学学报, 2010, 29(6):141-144.
|
| [16] |
曾小彬. 广东省港口集装箱吞吐量及增长速度预测[J]. 广东商学院学报, 2005(1):59-62.
|
| [17] |
安筱鹏, 韩增林. 东北集装箱运输内陆中转站的发展设想[J]. 经济地理, 2001, 21(4):442-446.
|
| [18] |
陈涛焘, 高琴. 港口集装箱吞吐量影响因素研究[J]. 武汉理工大学学报:信息与管理工程版, 2008, 30(6):991-994,1 003.
|
| [19] |
郑文儒, 周田瑞, 王鸿鹏. 厦门集装箱吞吐量与经济影响因素的计量经济分析[J]. 商业经济, 2016(9):50-52.
|
| [20] |
韩增林, 安筱鹏, 王利, 等. 中国国际集装箱运输网络的布局与优化[J]. 地理学报, 2002, 57(4):479-488.
|
| [21] |
|
| [22] |
马瑜, 栾维新, 片峰, 等. 中国外贸集装箱生成量的空间分布特征[J]. 经济地理, 2018, 38(1):120-126.
|
| [23] |
翟希东. 港口集装箱吞吐量预测模型研究[D]. 大连: 大连理工大学, 2006.
|
| [24] |
|
| [25] |
谢刚. “一带一路”促进我国集装箱吞吐量提升[N]. 经济参考报,2015-06-19(008).
|
| [26] |
江少文. 集装箱运输管理与实务[M]. 北京: 中国铁道出版社, 2007.
|
/
| 〈 |
|
〉 |