
Characteristics and Influencing Factors of Spatial Distribution of Headquarters of Listed Firms in Beijing
Received date: 2019-01-26
Revised date: 2019-10-27
Online published: 2025-04-25
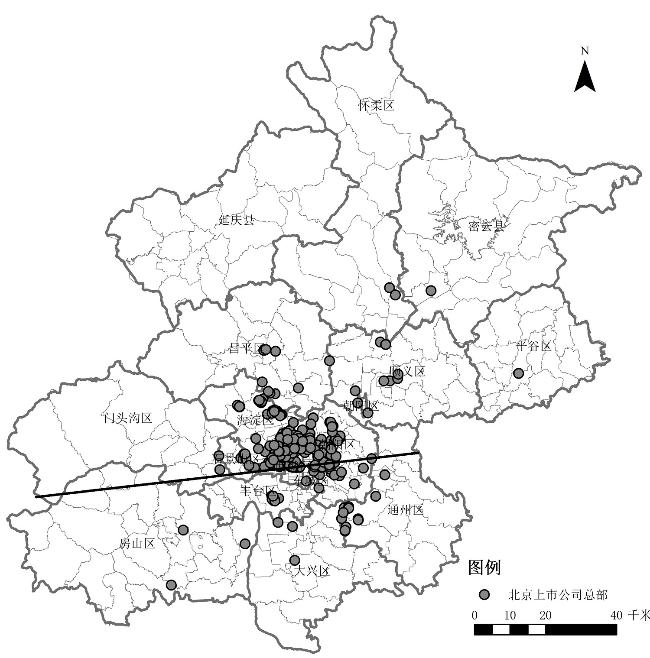
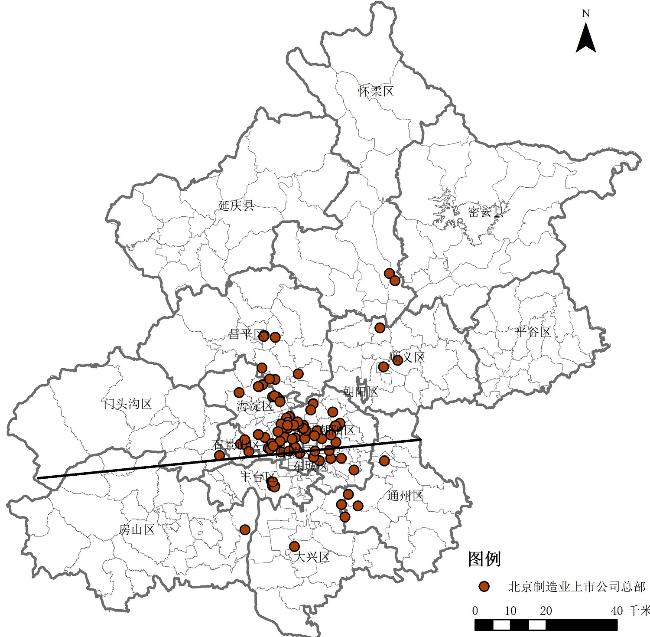
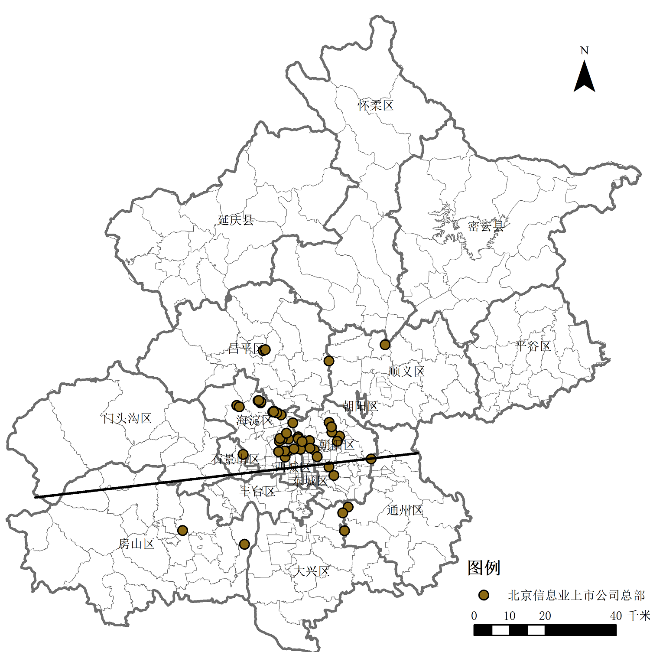
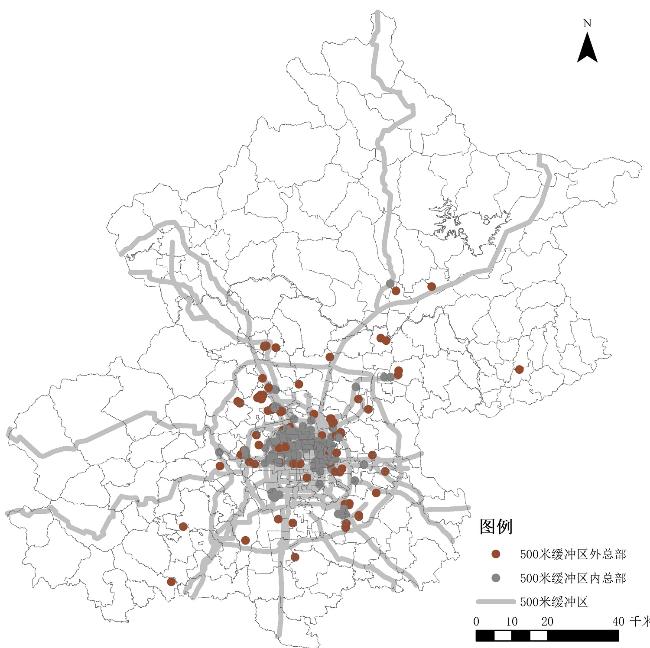
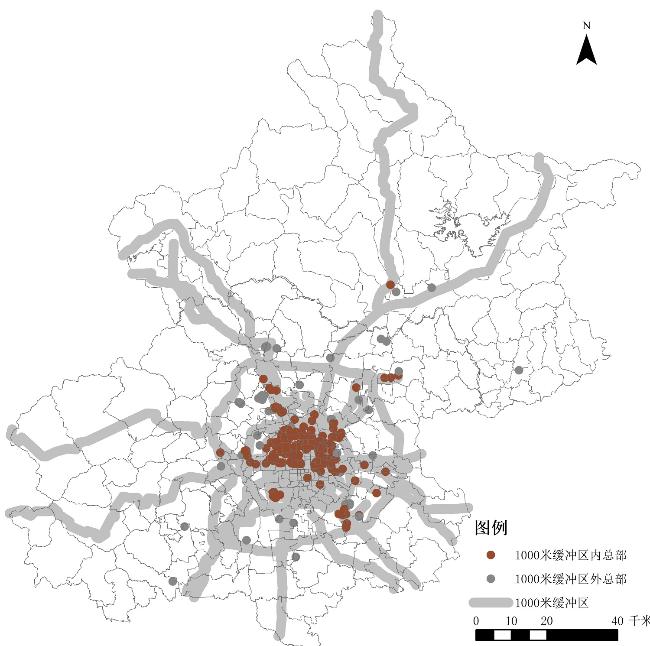
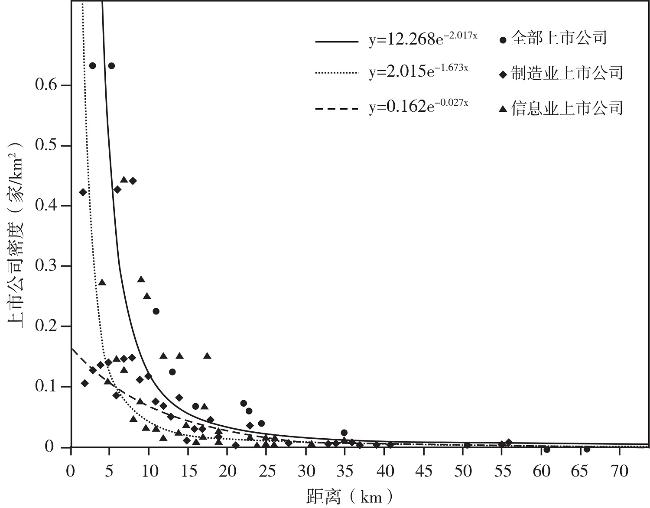
This paper used the spatial buffer analysis and Tobit model to explore the characteristics and influencing factors of spatial distribution of headquarters of listed firms in Beijing in 2015. Research indicated that: 1) The spatial distribution of headquarters of listed firms in Beijing was relatively concentrated. It was more even in the East-West direction,while in the North-South direction, the number of headquarters of listed firms in north of Chang'an Street was obviously more than that in south of Chang'an Street. The headquarters of listed firms within the fifth ring road distributed along the ring roads roughly, and showed distance decay characteristics. While headquarters of listed firms outside the fifth ring road extended along the radial highways to the suburbs. 2) Headquarters of listed firms of the same industry in Beijing tended to agglomerate. The distribution of headquarters of manufacturing listed firms was similar to that of the whole headquarters of listed firms. The distance decay characteristics of headquarters of manufacturing listed firms was more obvious. In addition,the spatial distribution of headquarters of listed firms of information transmission,software and information technology service industry (hereinafter referred to information industry) was highly concentrated. 3)It was found that the spatial distribution of headquarters of listed firms in Beijing was mainly affected by the factors such as location (within the second ring road,or between the second ring road and the fourth ring road),agglomeration, the number of employees in productive service industry and the distance to the nearest"985" institutions. 4) Comparing to different industries,we could find that the spatial distribution of headquarters of manufacturing listed firms was more influenced by factors about agglomeration and the policy factor. The distribution of headquarters of information listed firms was more influenced by factors about the distance to Tian'anmen and the nearest "985" institutions.
ZHAO Jingping , LU Minghua , LIU Hanchu . Characteristics and Influencing Factors of Spatial Distribution of Headquarters of Listed Firms in Beijing[J]. Economic geography, 2020 , 40(1) : 12 -20 . DOI: 10.15957/j.cnki.jjdl.2020.01.002
表1 北京上市公司与全国上市公司基本情况比较(2015年)Tab.1 A comparison of the basic situation between Beijing listed firms and National listed firms |
| 上市公司数量(家) | 上市公司市值(亿元) | ||||||
|---|---|---|---|---|---|---|---|
| 北京 | 全国 | 北京占全国的比重(%) | 北京 | 全国 | 北京占全国的比重(%) | ||
| A股主板 | 139 | 1 540 | 9.03 | 145 515.16 | 422 331.19 | 34.46 | |
| A股中小板 | 46 | 777 | 5.92 | 8 892.23 | 104 740.23 | 8.49 | |
| A股创业板 | 80 | 492 | 16.26 | 12 893.71 | 55 892.03 | 23.07 | |
| 全部A股 | 265 | 2 809 | 9.43 | 16 7301.10 | 582 963.45 | 28.70 | |
表2 北京不同行业上市公司数量Tab.2 The number of listed firms in different industries in Beijing |
| 行业 | 数量(家) |
|---|---|
| 制造业 | 98 |
| 信息业 | 54 |
| 建筑业 | 18 |
| 房地产业 | 16 |
| 批发和零售业 | 14 |
| 金融业 | 13 |
| 采矿业 | 12 |
| 电力、热力、燃气及水生产和供应业 | 9 |
| 租赁和商业服务业 | 6 |
| 文化、体育和娱乐业 | 5 |
| 农、林、牧、渔业 | 4 |
| 科学研究和技术服务业 | 4 |
| 交通运输、仓储和邮政业 | 3 |
| 住宿和餐饮业 | 3 |
| 水利、环境和公共设施管理业 | 3 |
| 综合 | 2 |
| 教育 | 1 |
| 总计 | 265 |
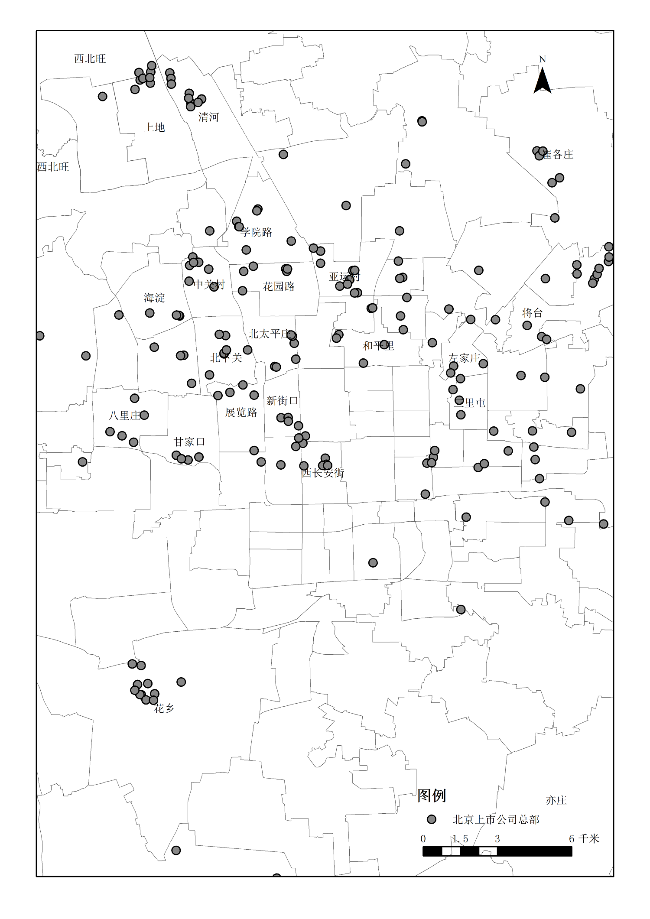
图2 北京上市公司总部街道分布详图Fig.2 The details chart of distribution of headquarters of listed firms in main substricts in Beijing |
表3 北京上市公司总部主要街道分布统计Tab.3 Distribution statistics of headquarters of listed firms in main subdistricts in Beijing |
| 街道 | 数量(家) | 街道 | 数量(家) | |
|---|---|---|---|---|
| 花乡 | 11 | 台湖 | 5 | |
| 亚运村 | 11 | 展览路 | 5 | |
| 将台 | 11 | 八里庄 | 5 | |
| 清河 | 9 | 苹果园 | 5 | |
| 西北旺 | 9 | 亦庄 | 4 | |
| 北下关 | 7 | 三里屯 | 4 | |
| 学院路 | 7 | 左家庄 | 4 | |
| 中关村 | 7 | 和平里 | 4 | |
| 西长安街 | 6 | 甘家口 | 4 | |
| 上地 | 6 | 南邵 | 4 | |
| 北太平庄 | 6 | 苏家坨 | 4 | |
| 花园路 | 6 | 海淀 | 4 | |
| 崔各庄 | 6 | 新街口 | 3 |
图3 北京制造业上市公司总部空间分布点状图Fig.3 The spatial distribution plot chart of headquarters of manufacturing listed firms in Beijing |
表4 北京制造业上市公司总部主要街道分布统计Tab.4 Distribution statistics of headquarters of manufacturing listed firms in main subdistricts in Beijing |
| 街道 | 数量(家) | 街道 | 数量(家) | |
|---|---|---|---|---|
| 花乡 | 6 | 学院路 | 3 | |
| 亚运村 | 5 | 北太平庄 | 2 | |
| 将台 | 5 | 北下关 | 2 | |
| 清河 | 5 | 回龙观 | 2 | |
| 西北旺 | 5 | 四季青 | 2 | |
| 花园路 | 5 | 新街口 | 2 | |
| 八里庄 | 4 | 台湖 | 2 | |
| 中关村 | 3 | 南邵 | 2 | |
| 苹果园 | 3 | 双井 | 2 | |
| 来广营 | 3 |
图4 北京信息业上市公司总部空间分布点状图Fig.4 The spatial distribution plot chart of headquarters of information listed firms in Beijing |
表5 北京信息业上市公司总部主要街道分布统计Tab.5 Distribution statistics of headquarters of information listed firms in main subdistricts in Beijing |
| 街道 | 数量(家) | 街道 | 数量(家) | |
|---|---|---|---|---|
| 亚运村 | 4 | 清河 | 2 | |
| 西北旺 | 4 | 苏家坨 | 2 | |
| 中关村 | 3 | 北下关 | 2 | |
| 上地 | 3 | 和平里 | 2 | |
| 将台 | 3 | 北太平庄 | 2 | |
| 崔各庄 | 3 |
表6 解释变量定义Tab.6 Definition of explanatory variables |
| 因素类型 | 变量符号 | 指标解释 |
|---|---|---|
| 区位条件 | Airport | 到首都国际机场的距离 |
| Railway station | 到最近火车站点的距离 | |
| Center | 到天安门城楼的距离 | |
| Financial street | 到金融街的距离 | |
| Ring1 | 二环以内区位为1,否则为0 | |
| Ring2 | 二环到四环之间区位为1,否则为0 | |
| Ring3 | 四环到六环之间区位为1,否则为0 | |
| Ring4 | 六环以外区位为1,否则为0 | |
| 智力条件 | College985 | 到最近的“985”院校的距离 |
| 集聚经济 | Agg | 2 km缓冲区总部数量 |
| Npi | 街道内部本行业从业人员数量 | |
| Empl | 街道内部生产性服务业从业人员数量 | |
| 政策 | Eda | 国家级开发区,有则赋值为1,否则为0 |
表7 北京上市公司总部分布影响因素的Tobit模型逐步回归结果Tab.7 Stepwise regression results of Tobit model of influencing factors of distribution of headquarters of listed firms in Beijing |
| 全部 | 制造业 | 信息业 | |
|---|---|---|---|
| Ring1 | -2.427** | ||
| Empl | 0.0000236*** | ||
| Agg | 0.193*** | 0.137*** | 0.115** |
| College985 | -0.0720*** | -0.0553** | -0.207** |
| Ring2 | -2.120** | -1.524* | |
| Eda | 1.090* | ||
| Airport | -0.104* | ||
| Npi | 0.000023* | 0.000015** | |
| Center | -0.142** | ||
| N | 280 | 280 | 280 |
| Pseudo R2 | 0.1544 | 0.1382 | 0.2052 |
| LRchi2 | 100.77 | 58.71 | 41.74 |
| p | 0.0000 | 0.0000 | 0.0000 |
注:Standard errors in parentheses,p*<0.05,p**<0.01,p***<0.001。 |
| [1] |
黄爱光. 北京总部经济发展研究[J]. 时代经贸, 2018(10):8-15.
|
| [2] |
北京市发展和改革委员会. 北京市国民经济和社会发展第十三个五年规划纲要[M]. 北京: 社会科学文献出版社, 2016.
|
| [3] |
李小建. 公司地理论[M]. 北京: 科学出版社, 2012.
|
| [4] |
|
| [5] |
|
| [6] |
|
| [7] |
|
| [8] |
|
| [9] |
|
| [10] |
|
| [11] |
|
| [12] |
|
| [13] |
|
| [14] |
|
| [15] |
|
| [16] |
|
| [17] |
Ó hUallacháin B,
|
| [18] |
|
| [19] |
刘青, 李贵才, 仝德, 等. 基于ESDA的深圳市高新技术企业空间格局及影响因素[J]. 经济地理, 2011, 31(6):926-933.
|
| [20] |
吴素春. 科技资源密集型城市高新技术企业空间分布研究——以武汉市为例[J]. 湖北社会科学, 2016(3):74-82.
|
| [21] |
韩会然, 杨成凤, 宋金平. 北京批发企业空间格局演化与区位选择因素[J]. 地理学报, 2018, 73(2):219-231.
|
| [22] |
罗蕾, 田玲玲, 罗静. 武汉市中心城区创意产业企业空间分布特征[J]. 经济地理, 2015, 35(2):114-119.
|
| [23] |
贺灿飞, 梁进社, 张华. 北京市外资制造企业的区位分析[J]. 地理学报, 2005, 60(1):122-130.
|
| [24] |
吕卫国, 陈雯. 制造业企业区位选择与南京城市空间重构[J]. 地理学报, 2009, 64(2):142-152.
|
| [25] |
高金龙, 袁丰, 陈雯. 转型期城市制造业空间重构过程与机理——以南京市为例[J]. 地理研究, 2017, 36(6):1014-1 028.
|
| [26] |
李长江, 余军合. 宁波市注塑机企业集群空间集聚特征分析[J]. 科技与管理, 2017, 19(4):53-60.
|
| [27] |
|
| [28] |
李国平, 卢明华. 北京高科技产业价值链区域分工研究[J]. 地理研究, 2002, 21(2):228-238.
|
| [29] |
卢明华, 李丽. 北京电子信息产业及其价值链空间分布特征研究[J]. 地理研究, 2012, 31(10):1861-1 871.
|
| [30] |
林善浪, 王健. 上海市金融服务业区位选择研究[J]. 上海金融, 2010(2):19-22.
|
| [31] |
王承云, 毛睿奕, 张婷婷. 上海跨国公司总部的空间集聚及影响因素[J]. 经济地理, 2010, 30(6):893-898.
|
| [32] |
王俊松, 潘峰华, 田明茂. 跨国公司总部在城市内部的空间分异及影响因素——以上海为例[J]. 地理研究, 2017, 36(9):1667-1 679.
|
| [33] |
王俊松, 潘峰华, 郭洁. 上海市上市企业总部的区位分布与影响机制[J]. 地理研究, 2015, 34(10):1920-1 932.
|
| [34] |
戴德胜, 姚迪, 刘博敏. 公司总部办公选址因子分析——以北京市总部办公分布为例[J]. 城市规划学刊, 2005(3):88-94.
|
| [35] |
许学强, 叶嘉安, 周春山, 等. 中国城市转型·发展·重构与规划教育[M]. 北京: 科学出版社, 2015.
|
| [36] |
|
/
| 〈 |
|
〉 |