
The Contribution Rate of Transportation Styles to the Spatial Interaction of Beijing-Tianjin-Hebei Area
Received date: 2018-12-23
Revised date: 2019-06-09
Online published: 2025-04-24
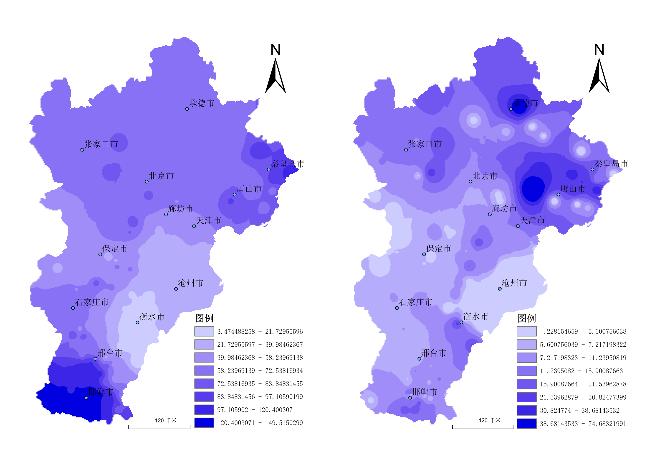
To compare the contribution rate of three transportation styles( highway, normal-speed rail and high-speed rail) to the spatial interaction strength of Beijing-Tianjin-Hebei, this paper, based on two situations considering monetary cost or not, constructs three different road network systems, and applies the modified gravity model and the potential model to do quantitatively analysis. The results show that the highway has the largest contribution rate to the spatial interaction of Beijing-Tianjin-Hebei, and the contribution rates based on the minimum comprehensive cost and the minimum time cost respectively reach 83.5% and 73%, indicating that the economic and cultural exchanges between the cities of Beijing-Tianjin-Hebei are highly dependent on the highway. Besides, high-speed rail can greatly shorten the travel time between cities, but the increase in fare generally counteracts time cost savings. The contribution rate based on minimum time cost is 22.2%, which is much higher than the 4.8% of normal-speed rail. And the increase of the spatial interaction strength brought by high-speed rail has obvious corridor effects along the site cities such as Beijing, Tianjin, Shijiazhuang and Handan.
DAI Xuezhen , LYU Chunyang , ZHENG Yishuo , ZOU Jiao . The Contribution Rate of Transportation Styles to the Spatial Interaction of Beijing-Tianjin-Hebei Area[J]. Economic geography, 2019 , 39(8) : 36 -43 . DOI: 10.15957/j.cnki.jjdl.2019.08.005
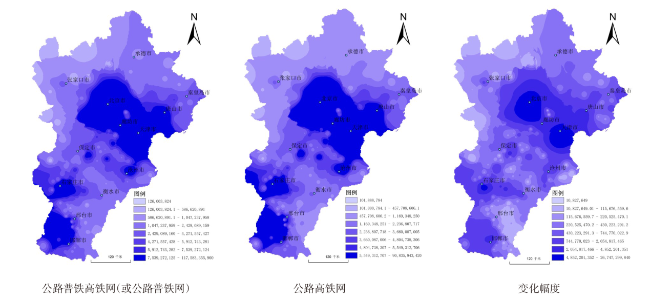
表1 三种网络条件下各城市最小综合成本 / hTab.1 Minimum comprehensive costs of cities based on 3 different transportation networks / h |
| 排名 | 城市 | 公路普铁网 | 城市 | 公路高铁网 | 城市 | 公路普铁高铁网 |
|---|---|---|---|---|---|---|
| 1 | 保定市 | 533.32 | 清苑县 | 596.22 | 保定市 | 533.32 |
| 2 | 霸州市 | 547.81 | 保定市 | 611.51 | 霸州市 | 547.81 |
| 3 | 徐水县 | 548.10 | 高阳县 | 615.73 | 徐水县 | 548.10 |
| 4 | 饶阳县 | 548.49 | 徐水县 | 618.48 | 饶阳县 | 548.49 |
| 5 | 清苑县 | 549.28 | 任丘市 | 618.83 | 清苑县 | 549.28 |
| 76 | 隆尧县 | 703.95 | 孟村回族自治县 | 779.35 | 隆尧县 | 703.95 |
| 77 | 临城县 | 705.82 | 威县 | 781.93 | 临城县 | 705.82 |
| 78 | 巨鹿县 | 708.30 | 内丘县 | 783.07 | 巨鹿县 | 708.30 |
| 79 | 香河县 | 710.13 | 故城县 | 787.29 | 香河县 | 710.13 |
| 80 | 三河市 | 714.97 | 盐山县 | 787.35 | 三河市 | 714.97 |
| 130 | 秦皇岛市 | 1 042.38 | 承德县 | 1 214.26 | 秦皇岛市 | 1 042.38 |
| 131 | 隆化县 | 1 042.49 | 秦皇岛市 | 1 238.80 | 隆化县 | 1 042.49 |
| 132 | 丰宁县 | 1 066.28 | 宽城县 | 1 256.75 | 丰宁县 | 1 066.28 |
| 133 | 宽城县 | 1 101.08 | 青龙县 | 1 266.52 | 宽城县 | 1 101.08 |
| 134 | 青龙县 | 1 110.19 | 隆化县 | 1 294.93 | 青龙县 | 1 110.19 |
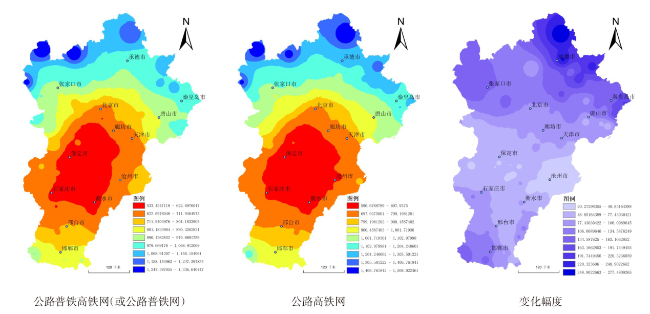
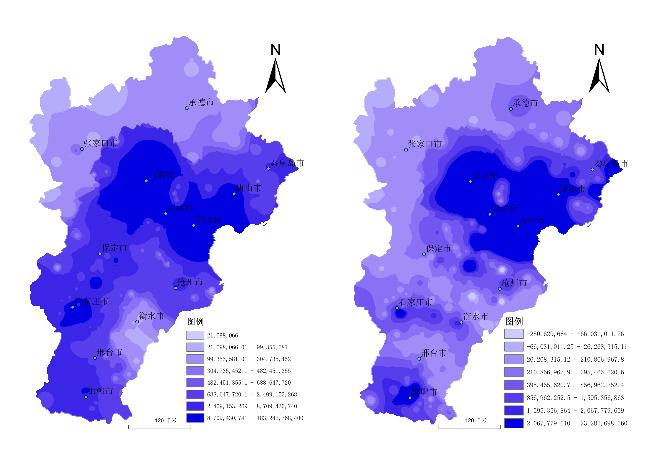
表2 三种路网条件下城市空间相互作用强度Tab.2 Spatial interaction strength of cities based on 3 different transportation networks |
| 排名 | 城市 | 公路普铁网 | 城市 | 公路高铁网 | 城市 | 公路普铁高铁网 |
|---|---|---|---|---|---|---|
| 1 | 北京市 | 117 824 370 298 | 北京市 | 91 022 222 387 | 北京市 | 117 824 370 298 |
| 2 | 天津市 | 82 401 164 560 | 天津市 | 67 637 171 102 | 天津市 | 82 401 164 560 |
| 3 | 石家庄市 | 50 280 354 082 | 邢台市 | 44 927 427 132 | 石家庄市 | 50 280 354 082 |
| 4 | 邢台市 | 46 853 584 844 | 邢台县 | 41 988 134 573 | 邢台市 | 46 853 584 844 |
| 5 | 邢台县 | 42 647 771 540 | 石家庄市 | 40 597 327 782 | 邢台县 | 42 647 771 540 |
| 76 | 蠡县 | 1 962 274 022 | 唐县 | 1 739 874 972 | 蠡县 | 1 962 274 022 |
| 77 | 承德市 | 1 923 711 811 | 景县 | 1 716 448 467 | 承德市 | 1 923 711 811 |
| 78 | 唐县 | 1 873 209 257 | 容城县 | 1 650 739 682 | 唐县 | 1 873 209 257 |
| 79 | 盐山县 | 1 868 033 624 | 安平县 | 1 609 994 458 | 盐山县 | 1 868 033 624 |
| 80 | 大厂县 | 1 858 671 912 | 大名县 | 1 598 756 451 | 大厂县 | 1 858 671 912 |
| 130 | 丰宁县 | 513 513 239 | 隆化县 | 465 371 539.2 | 丰宁县 | 513 513 238.8 |
| 131 | 蔚县 | 508 494 176 | 赤城县 | 405 749 919.7 | 蔚县 | 508 494 175.7 |
| 132 | 赤城县 | 465 502 064 | 怀安县 | 404 256 947.4 | 赤城县 | 465 502 064.2 |
| 133 | 围场县 | 444 918 474 | 阜平县 | 341 307 813.5 | 围场县 | 444 918 473.6 |
| 134 | 阜平县 | 362 081 773 | 围场县 | 281 476 933 | 阜平县 | 362 081 772.7 |
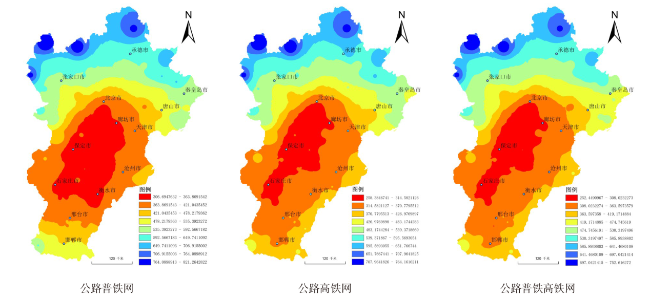
表3 三种路网条件下各城市最小时间成本 / hTab.3 Minimum time costs of cities based on 3 different transportation networks / h |
| 排名 | 城市 | 公路高铁网 | 城市 | 公路普铁网 | 城市 | 公路普铁高铁网 |
|---|---|---|---|---|---|---|
| 1 | 清苑县 | 257.87 | 保定市 | 306.61 | 清苑县 | 251.94 |
| 2 | 石家庄市 | 264.49 | 霸州市 | 310.43 | 石家庄市 | 258.37 |
| 3 | 高碑店市 | 266.55 | 清苑县 | 315.67 | 高碑店市 | 261.33 |
| 4 | 定州市 | 269.97 | 任丘市 | 316.42 | 定州市 | 263.91 |
| 5 | 北京市 | 274.33 | 徐水县 | 323.54 | 北京市 | 267.51 |
| 76 | 平乡县 | 358.49 | 故城县 | 411.14 | 肥乡县 | 350.60 |
| 77 | 三河市 | 358.86 | 玉田县 | 414.88 | 威县 | 350.66 |
| 78 | 威县 | 359.06 | 三河市 | 415.27 | 三河市 | 350.83 |
| 79 | 南皮县 | 359.13 | 邢台县 | 415.90 | 玉田县 | 350.94 |
| 80 | 枣强县 | 359.54 | 黄骅市 | 416.87 | 平乡县 | 351.37 |
| 130 | 平泉县 | 638.45 | 平泉县 | 692.42 | 平泉县 | 622.85 |
| 131 | 尚义县 | 720.81 | 围场县 | 775.06 | 围场县 | 704.89 |
| 132 | 围场县 | 720.93 | 尚义县 | 777.92 | 尚义县 | 709.49 |
| 133 | 沽源县 | 757.04 | 沽源县 | 809.27 | 沽源县 | 737.50 |
| 134 | 康保县 | 764.40 | 康保县 | 821.50 | 康保县 | 753.08 |
表4 三种路网条件下城市空间相互作用强度Tab.4 Spatial interaction strength of cities based on 3 different transportation networks |
| 排名 | 城市 | 公路高铁网 | 城市 | 公路普铁网 | 城市 | 公路普铁高铁网 |
|---|---|---|---|---|---|---|
| 1 | 北京市 | 577 726 247 556.27 | 北京市 | 417 414 209 914.05 | 北京市 | 601 061 282 878.15 |
| 2 | 天津市 | 357 955 007 779.30 | 天津市 | 294 349 569 905.08 | 天津市 | 374 044 625 310.06 |
| 3 | 石家庄 | 207 085 881 331.07 | 石家庄 | 135 058 087 988.74 | 石家庄 | 211 134 236 167.47 |
| 4 | 邢台市 | 136 398 667 957.70 | 邢台市 | 127 991 367 285.11 | 唐山市 | 137 995 946 148.64 |
| 5 | 唐山市 | 134 270 959 269.04 | 邢台县 | 118 940 157 204.09 | 邢台市 | 137 700 798 025.18 |
| 76 | 临漳县 | 6 613 792 640.69 | 蠡县 | 5 238 800 606.83 | 蠡县 | 6 916 848 757.64 |
| 77 | 南和县 | 6 464 984 200.81 | 临漳县 | 5 040 940 626.94 | 唐县 | 6 811 500 983.07 |
| 78 | 抚宁县 | 6 451 814 441.23 | 大厂县 | 5 030 585 468.73 | 容城县 | 6 783 273 026.96 |
| 79 | 肥乡县 | 6 379 747 313.24 | 南和县 | 5 028 430 239.65 | 东光县 | 6 778 596 495.47 |
| 80 | 安新县 | 6 329 914 206.62 | 景县 | 4 988 057 194.66 | 安新县 | 6 457 119 039.73 |
| 130 | 阳原县 | 821 423 035.66 | 阳原县 | 783 707 758.12 | 阳原县 | 827 089 677.16 |
| 131 | 崇礼县 | 626 072 195.52 | 崇礼县 | 595 940 703.17 | 崇礼县 | 634 705 259.83 |
| 132 | 康保县 | 374 814 937.05 | 康保县 | 355 414 689.91 | 康保县 | 380 014 885.12 |
| 133 | 沽源县 | 330 534 473.90 | 沽源县 | 323 252 219.09 | 沽源县 | 346 264 679.11 |
| 134 | 尚义县 | 329 089 597.51 | 尚义县 | 312 098 884.00 | 尚义县 | 333 706 583.59 |
| [1] |
|
| [2] |
|
| [3] |
|
| [4] |
|
| [5] |
|
| [6] |
|
| [7] |
|
| [8] |
|
| [9] |
徐辉, 彭萍. 基于引力模型的江西省经济区划与协调发展研究[J]. 地理科学, 2008(2):169-172.
|
| [10] |
梅志雄, 徐颂军, 欧阳军, 等. 近20年珠三角城市群城市空间相互作用时空演变[J]. 地理科学, 2012, 32(6):694-701.
|
| [11] |
董青. 基于区域经济视角的中国城市群体系空间结构研究[D]. 济南: 山东师范大学, 2010.
|
| [12] |
孙斌栋, 丁嵩. 大城市有利于小城市的经济增长吗?——来自长三角城市群的证据[J]. 地理研究, 2016, 35(9):1615-1625.
|
| [13] |
黄金川. 基于辐射扩散测度的中国城市群发育格局识别[J]. 经济地理, 2016, 36(11):199-206.
|
| [14] |
席强敏, 李国平. 超大城市规模与空间结构效应研究评述与展望[J]. 经济地理, 2018, 38(1):61-68.
|
| [15] |
聂晓英, 石培基, 吕蕊, 等. 河西走廊绿洲型城镇空间相互作用时空演变[J]. 经济地理, 2016, 36(7):76-83.
|
| [16] |
丁金学, 金凤君, 王姣娥, 等. 高铁与民航的竞争博弈及其空间效应[J]. 经济地理, 2013, 33(5):104-110.
|
| [17] |
戴学珍. 论京津空间相互作用[J]. 地理科学, 2002, 22(3):257-262.
|
| [18] |
郑长娟, 郝新蓉, 程少锋, 等. 知识密集型服务业的空间关联性及其影响因素——以浙江省69个县市为例[J]. 经济地理, 2017, 37(3):121-128,173.
|
| [19] |
蒋海兵, 祁毅, 李传武. 中国城市高速铁路客运的空间联系格局[J]. 经济地理, 2018, 38(7):26-33.
|
| [20] |
琚胜利, 陶卓民. 南京市农家乐专业村的网络空间中心性[J]. 经济地理, 2016, 36(3):109-117.
|
| [21] |
贺艳华, 周国华, 唐承丽, 等. 城市群地区城乡一体化空间组织理论初探[J]. 地理研究, 2017, 36(2):241-252.
|
/
| 〈 |
|
〉 |