
Impact of Carbon Intensity Constraint Policy on Urban Air Quality in China
Received date: 2018-11-13
Revised date: 2019-03-28
Online published: 2025-04-24
This paper uses the panel data of China's 30 key cities from 2003 to 2016 and employs the difference-in difference (DID) method to examine the impact of carbon intensity restraint policies on urban air quality. Furthermore, this paper explores the heterogeneity of carbon intensity constraint policy on urban air quality from the perspective of institutional differences. Robustness test confirms the reliability of the conclusion. The results show that: The carbon intensity constraint policy can significantly reduce the air pollution concentration and improve the urban air quality. As time goes by, the effect of the carbon intensity restraint policy rises first and then decreases, which means that its short-term effect is obvious, and the medium-and long-term effects may face uncertainty. The impact of carbon intensity constraint policy on urban air quality is subject to the regional institutional environment. The higher government quality and marketization degree, the lower proportion of state-owned economy are conducive to improving the effect of carbon intensity restraint on urban air quality.
LI Yi , HU Zongyi , LIU Yiwen , TANG Jianyang . Impact of Carbon Intensity Constraint Policy on Urban Air Quality in China[J]. Economic geography, 2019 , 39(8) : 21 -28 . DOI: 10.15957/j.cnki.jjdl.2019.08.003
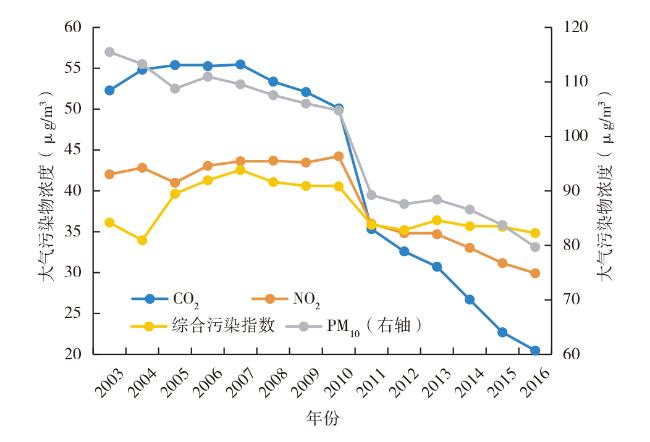
表1 政策实施前后城市空气质量统计特征Tab.1 Statistical characteristics of urban air quality before and after implementation policy |
| 时期 | SO2 | NO2 | PM10 | P | CI |
|---|---|---|---|---|---|
| 政策实施前 | 53.603(1.339) | 42.996(0.844) | 109.554(1.701) | 3.253(0.052) | 2.869(0.183) |
| 政策实施后 | 38.089(1.068) | 36.272(0.724) | 95.872(1.627) | 2.586(0.078) | 1.415(0.134) |
| 政策实施后—政策实施前 | -15.515***(1.764) | -6.723***(1.159) | -13.681***(2.417) | -0.948***(0.090) | 1.454***(0.241) |
注:*、**、***分别表示在10%、5%和1%的水平上显著;括号中的数值为标准误。 |
表2 碳强度约束政策对城市空气质量的平均影响效应Tab.2 The average impact of carbon intensity restraint policy on urban air quality |
| SO2 | NO2 | PM10 | P | |
|---|---|---|---|---|
| 0.071*** (0.026) | 0.015*** (0.007) | 0.038*** (0.013) | 0.029*** (0.006) | |
| -0.281*** (0.044) | -0.091*** (0.025) | -0.018*** (0.004) | -0.129*** (0.024) | |
| 0.173** (0.081) | 0.049** (0.024) | 0.007** (0.003) | 0.159*** (0.052) | |
| 0.129 (0.172) | 0.062 (0.116) | 0.028 (0.057) | 0.075 (0.067) | |
| -1.105 (1.355) | -1.108 (0.727) | 0.247 (0.444) | -0.165 (0.526) | |
| 0.136*** (0.202) | 0.109** (0.055) | 0.010** (0.048) | 0.123*** (0.042) | |
| -0.005** (0.002) | -0.033*** (0.013) | -0.014** (0.007) | -0.022** (0.011) | |
| 0.271*** (0.092) | 0.167*** (0.052) | 0.117*** (0.043) | 0.210*** (0.015) | |
| 0.035** (0.015) | 0.005** (0.002) | 0.033** (0.016) | 0.067** (0.029) | |
| -0.113*** (0.024) | -0.087** (0.039) | -0.091*** (0.003) | -0.078*** (0.017) | |
| Year | Y | Y | Y | Y |
| 0.719 | 0.725 | 0.739 | 0.753 | |
| Hausman | 38.75*** | 19.60** | 15.02*** | 8.09*** |
| 样本数/个 | 420 | 420 | 420 | 420 |
注:*、**、***分别表示在10%、5%和1%的水平上显著;括号中的数值为标准误,Y表示加入时间控制变量。 |
表3 碳强度约束政策对城市空气质量影响的动态变化Tab.3 Dynamic changes of carbon intensity constraint policy on urban air quality |
| SO2 | NO2 | PM10 | P | |
|---|---|---|---|---|
| 0.113 (0.072) | 0.062 (0.052) | 0.115***(0.039) | 0.105**(0.041) | |
| 0.112 (0.081) | 0.058 (0.048) | 0.118** (0.049) | 0.109** (0.047) | |
| 0.115** (0.065) | 0.059*** (0.015) | 0.119*** (0.043) | 0.104* (0.063) | |
| 0.115* (0.053) | 0.063** (0.026) | 0.117*** (0.042) | 0.112*** (0.037) | |
| 0.114* (0.068) | 0.060** (0.031) | 0.123*** (0.046) | 0.108*** (0.039) | |
| 0.116* (0.064) | 0.051 (0.045) | 0.121 (0.104) | 0.105** (0.052) | |
| 0.117*** (0.071) | 0.057 (0.042) | 0.118** (0.049) | 0.113*** (0.041) | |
| 0.229*** (0.082) | 0.091** (0.043) | 0.175*** (0.068) | 0.162*** (0.052) | |
| 0.230*** (0.083) | 0.091** (0.038) | 0.174** (0.072) | 0.159*** (0.054) | |
| 0.231*** (0.079) | 0.093** (0.039) | 0.178** (0.085) | 0.158*** (0.049) | |
| 0.245*** (0.074) | 0.103** (0.045) | 0.186*** (0.047) | 0.175** (0.065) | |
| 0.243*** (0.089) | 0.093** (0.051) | 0.189*** (0.063) | 0.173** (0.071) | |
| 0.231*** (0.082) | 0.086** (0.049) | 0.176*** (0.051) | 0.164** (0.069) | |
| 控制变量 | Y | Y | Y | Y |
| Year | Y | Y | Y | Y |
| Hausman | 82.13*** | 131.34*** | 42.95*** | 110.67*** |
| 0.701 | 0.729 | 0.746 | 0.789 | |
| 样本数 | 420 | 420 | 420 | 420 |
注:*、**、***分别表示在10%、5%和1%的水平上显著;括号中的数值为标准误;Y表示加入控制变量。 |
表4 碳强度约束政策效果的制度异质性Tab.4 Effect heterogeneity of carbon intensity constraint policy for urban air quality |
| 平均数 | 中位数 | 75th百分位数 | ||||||
|---|---|---|---|---|---|---|---|---|
| 高质量政府 | 低质量政府 | 高质量政府 | 低质量政府 | 高质量政府 | 低质量政府 | |||
| 0.097**(0.039) | 0.039(0.025) | 0.116**(0.054) | 0.041**(0.019) | 0.216**(0.098) | 0.038**(0.019) | |||
| 样本数 | 182 | 238 | 210 | 210 | 98 | 322 | ||
| Hausman | 39.08*** | 31.53*** | 19.42*** | 21.53*** | 42.64*** | 35.49*** | ||
| 0.503 | 0.437 | 0.514 | 0.472 | 0.357 | 0.572 | |||
| 经验p值 | 0.042 | 0.014 | 0.002 | |||||
| 高度市场化 | 轻度市场化 | 高度市场化 | 轻度市场化 | 高度市场化 | 轻度市场化 | |||
| 0.108**(0.055) | 0.038**(0.018) | 0.114**(0.052) | 0.045**(0.022) | 0.121***(0.043) | 0.029(0.019) | |||
| 样本数 | 196 | 224 | 210 | 210 | 98 | 322 | ||
| Hausman | 27.17*** | 34.67*** | 36.72*** | 31.85*** | 40.85*** | 55.47*** | ||
| 0.513 | 0.527 | 0.497 | 0.501 | 0.419 | 0.385 | |||
| 经验p值 | 0.034 | 0.027 | 0.005 | |||||
| 高度国有化 | 轻度国有化 | 高度国有化 | 轻度国有化 | 高度国有化 | 轻度国有化 | |||
| 0.008(0.005) | 0.057*(0.031) | 0.011**(0.006) | 0.062**(0.028) | 0.009**(0.004) | 0.064***(0.021) | |||
| 样本数 | 196 | 224 | 210 | 210 | 98 | 322 | ||
| Hausman | 31.09*** | 27.64*** | 26.83*** | 18.45*** | 50.96*** | 37.43*** | ||
| 0.403 | 0.479 | 0.509 | 0.532 | 0.417 | 0.562 | |||
| 经验p值 | 0.044 | 0.031 | 0.019 | |||||
注:*、**、***分别表示在10%、5%和1%的水平上显著;括号中的数值为标准误;“经验p值”用于检验组间调整系数差异的显著性,通过自抽样1 000次得到。 |
| [1] |
|
| [2] |
|
| [3] |
郭庆. 环境规制政策工具相对作用评价——以水污染治理为例[J]. 经济与管理评论, 2014, 30(5):26-30.
|
| [4] |
张同斌. 提高环境规制强度能否“利当前”并“惠长远”[J]. 财贸经济, 2017, 38(3):116-130.
|
| [5] |
颉茂华, 刘向伟, 白牡丹. 环保投资效率实证与政策建议[J]. 中国人口·资源与环境, 2010, 20(4):100-105.
|
| [6] |
贺灿飞, 张腾, 杨晟朗. 环境规制效果与中国城市空气污染[J]. 自然资源学报, 2013, 28(10):1651-1663.
|
| [7] |
|
| [8] |
范庆泉, 张同斌. 中国经济增长路径上的环境规制政策与污染治理机制研究[J]. 世界经济, 2018, 41(8):171-192.
|
| [9] |
|
| [10] |
祁毓, 卢洪友, 张宁川. 环境规制能实现“降污”和“增效”的双赢吗——来自环保重点城市“达标”与“非达标”准实验的证据[J]. 财贸经济, 2016(9):126-143.
|
| [11] |
|
| [12] |
|
| [13] |
樊纲, 王小鲁, 马光荣. 中国市场化进程对经济增长的贡献[J]. 经济研究, 2011, 46(9):4-16.
|
| [14] |
韩晶, 刘远, 张新闻. 市场化、环境规制与中国经济绿色增长[J]. 经济社会体制比较, 2017(5):105-115.
|
| [15] |
|
| [16] |
|
| [17] |
|
| [18] |
|
| [19] |
|
| [20] |
|
| [21] |
世界银行. 中国政府治理、投资环境与和谐社会:中国120个城市竞争力提高[EB/OL]. http://documents.shihang.org/curated/zh/685061468236992287/pdf/377590CHINESE0191020 060120cities1cn.pdf2006-10-08/2019-03-20.
|
/
| 〈 |
|
〉 |