
Trade Network of Global Agricultural Products Weighted by Physical and Value Quantity
Received date: 2018-09-07
Revised date: 2018-11-22
Online published: 2025-04-23
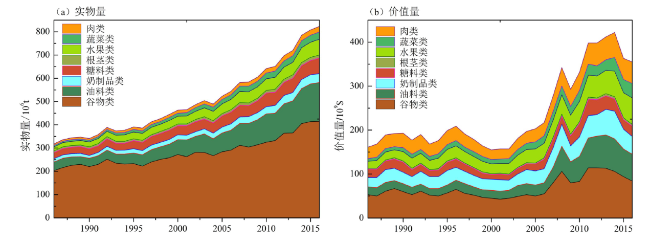
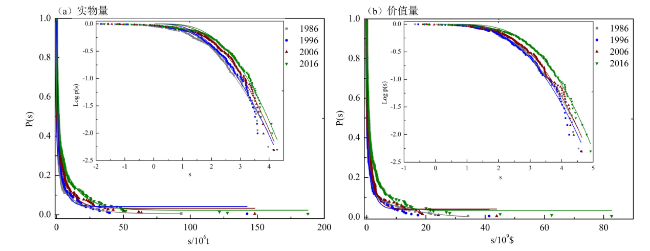
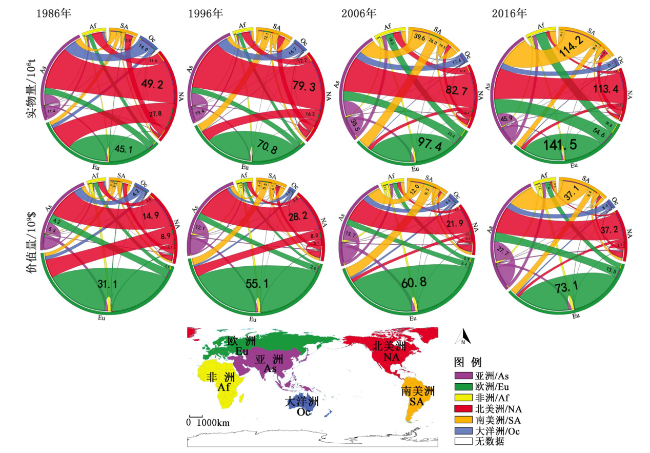
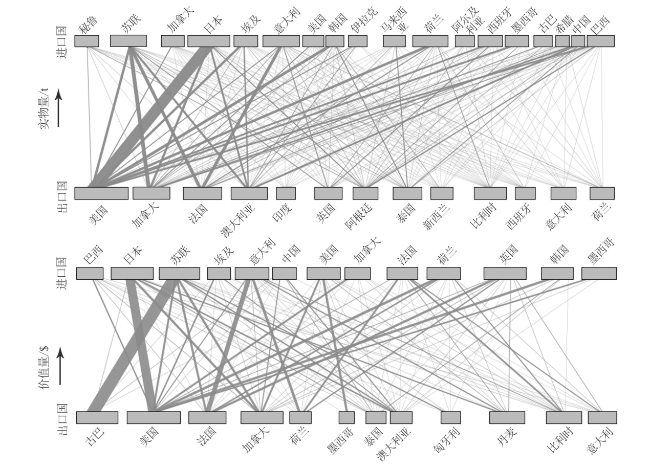
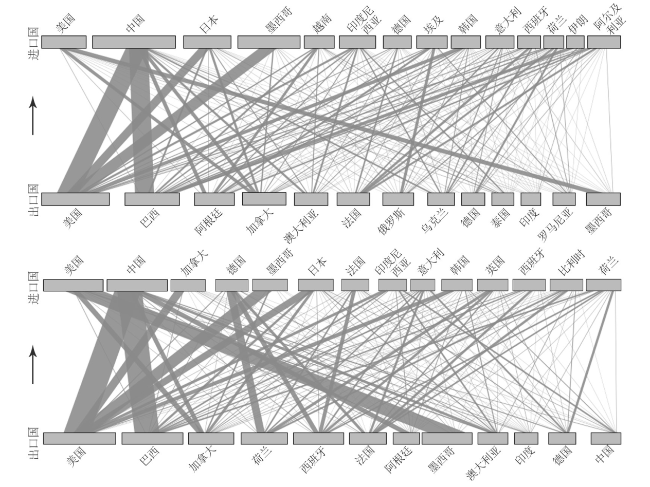
The agricultural product trade network weighted by physical and value quantity, which can reveal the changing characteristics of the network structure and directly response the trade relationships among countries. This paper employs complex network theory to construct two trade networks of 8 categories of agricultural products, the research results indicate that: 1) The total trade of global agricultural products based on physical quantity increases by 2.55 times in the past 30 years and shows a stable trend, the total trade value quantity increases by 1.98 times, but shows a fluctuating upward trend. The increase in total trade quantity signifies a trend of global agricultural economic integration. 2) The cumulative distribution curve of the node strength conforms to a power-law distribution. The expansion index (α) increases with time, which shows that the heterogeneity of various nodes in the network is enhanced, and the function of "hub" node is further strengthened. 3) In recent 30 years, the major trade links in the network have changed a lot, China has gradually become the largest demander of agricultural products. 4) Although there is difference of two trade network because of different attributes of agricultural products, the major trade relationships between them are gradually synchronized.
WANG Xiang , NIU Shuwen , QIANG Wenli , LIU Aiming , CHENG Shengkui , QIU Xin . Trade Network of Global Agricultural Products Weighted by Physical and Value Quantity[J]. Economic geography, 2019 , 39(4) : 164 -173 . DOI: 10.15957/j.cnki.jjdl.2019.04.020
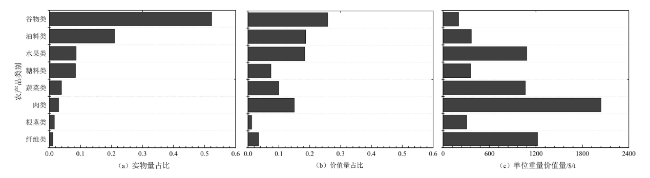
表1 全球农产品贸易中的主要类别Tab.1 The main categories of agricultural products in global trade |
| 农产品类别 | 农产品种类 |
|---|---|
| 谷物类 | 小麦、玉米、稻米、小米、大麦、荞麦、高粱、燕麦 |
| 油料类 | 大豆、花生、向日葵、亚麻籽、油菜籽、芝麻 |
| 纤维类 | 皮棉、黄麻、剑麻、苎麻、棉绒、棉籽、棉籽油、棉籽饼 |
| 糖料类 | 原糖、精炼糖 |
| 根茎类 | 木薯、马铃薯、甜薯、山药、根和块茎 |
| 水果类 | 苹果、菠萝、草莓、桃子、西瓜、香蕉、樱桃、梨、芒果、猕猴桃、木瓜、柠檬和酸橙、葡萄、杏子、牛油果、蓝莓、无花果、橙子、李子 |
| 蔬菜类 | 大蒜、洋葱、西红柿、胡萝卜和萝卜、花椰菜和西蓝花、黄瓜和小黄瓜、茴芹、生姜、卷心菜、辣椒、竹笋、生菜和菊苣、茄子 |
| 肉类 | 猪肉、牛肉、鸡肉、鸭肉、山羊肉、马肉、兔肉、绵羊肉 |
表2 不同年份一些主要国家节点强度的分异Tab.2 The node strength differentiation of some main countries in different years |
| 层级 | 实物量/106 t | 价值量/109 $ | ||||||
|---|---|---|---|---|---|---|---|---|
| 1986 | 1996 | 2006 | 2016 | 1986 | 1996 | 2006 | 2016 | |
| 第一层 实物:>100 价值:>30 | 美(1) | 美(1) | 美(1) | 美、中、巴(3) | 美(1) | 美(1) | 美(1) | 美、中、巴、德 (4) |
| 第二层 实物30~100 价值:20~30 | 日、法、加(3) | 法、日、加(3) | 巴、中、法、加、 日、德、阿(7) | 阿、加、法、德、 俄、荷、墨、日、 澳(9) | 法、德(2) | 法、德(2) | 中、巴(2) | 荷、法、加、西、 墨、阿(6) |
| 第三层 实物:20~30 价值:10~20 | 德、澳、中 (3) | 德、澳、荷、巴 (4) | 墨、荷、澳、西、 比、俄、意(7) | 乌、泰、意、比、 越、印、印尼(8) | 日、古、意、 荷、印、加 (6) | 日、荷、意、比、 英、加、西、澳 (8) | 法、德、加、荷、 比、英、西、意、 日(9) | 意、印、比、日、 俄、英、泰、澳 (8) |
| 第四层 实物:10~20 价值:5~10 | 英、荷、意、比、 巴、泰、韩、阿 (8) | 墨、比、中、意、 西、英、韩、泰、 阿、俄、埃(11) | 韩、埃、印、西、 泰、乌、伊、 印尼(8) | 韩、埃、罗、英、 波、伊、土、南、 摩、马、哥(11) | 比、澳、中、 西(4) | 巴、中、墨、俄、 泰、韩、阿、丹 (8) | 澳、阿、印、俄 (4) | 越、波、韩、土、 乌、埃、乌、埃、 罗、南、印尼(11) |
| 第五层 实物:<10 价值:<5 | 其他(161) | 其他(181) | 其他(178) | 其他(170) | 其他(163) | 其他(181) | 其他(187) | 其他(172) |
注:括号中数字为各层级的国家数量(印—印度、印尼—印度尼西亚、阿—阿根廷、澳—澳大利亚、乌—乌克兰、伊—伊朗、罗—罗马尼亚)。 |
表3 对数坐标系中累积节点强度拟合曲线参数Tab.3 Parameters of fitting curve of cumulative node strength in logarithmic coordinate |
| 年份 | 实物量 | 价值量 | |||
|---|---|---|---|---|---|
| α | R2 | α | R2 | ||
| 1986 | 0.243 | 0.978 | 0.291 | 0.988 | |
| 1996 | 0.242 | 0.981 | 0.290 | 0.989 | |
| 2006 | 0.259 | 0.985 | 0.317 | 0.985 | |
| 2016 | 0.275 | 0.986 | 0.357 | 0.995 | |
注:α为拟合函数的扩展指数,R2为拟合函数的可决系数。 |
表4 八大类农产品节点数目和节点强度的变化Tab.4 The changes of node number and strength of eight types of agricultural products |
| 种类 | 1986 | 2016 | |||||
|---|---|---|---|---|---|---|---|
| 节点数目/个 | 实物总强 度/106 t | 价值总强 度/109 $ | 节点数目/个 | 实物总强 度/106 t | 价值总强 度/109 $ | ||
| 谷物 | 174 | 203 | 53 | 201 | 415 | 84 | |
| 油料 | 119 | 37 | 18 | 190 | 167 | 61 | |
| 纤维 | 117 | 7 | 13 | 170 | 9 | 11 | |
| 糖料 | 174 | 27 | 19 | 200 | 67 | 24 | |
| 根茎 | 152 | 7 | 2 | 198 | 13 | 4 | |
| 水果 | 152 | 17 | 16 | 199 | 68 | 60 | |
| 蔬菜 | 139 | 6 | 6 | 201 | 31 | 33 | |
| 肉类 | 165 | 7 | 26 | 200 | 24 | 49 | |
| [1] |
|
| [2] |
|
| [3] |
|
| [4] |
|
| [5] |
|
| [6] |
OCED. The Economics of Climate Change Mitigation:Policies and Options for Global Action Beyond 2012[C]// Organisation for Economic Co-operation and Development. Paris, 2009.
|
| [7] |
FAO. World Agriculture:Towards 2030/2050-Interim Report[R]. Rome: UN Food and Agriculture Organization, 2006.
|
| [8] |
|
| [9] |
Food and Agriculture Organization of the United Nations. FAOSTAT[EB/OL]. http://www.fao.org/faostat/en/#data.
|
| [10] |
|
| [11] |
|
| [12] |
|
| [13] |
王祥, 强文丽, 牛叔文, 等. 全球农产品贸易网络及其演化分析[J]. 自然资源学报, 2018, 33(6):940-953.
|
| [14] |
|
| [15] |
|
| [16] |
|
| [17] |
刘劲松. 基于社会网络分析的世界天然气贸易格局演化[J]. 经济地理, 2016, 36(12):89-95.
|
| [18] |
蒋小荣, 杨永春, 汪胜兰. 1985—2015年全球贸易网络格局的时空演化及对中国地缘战略的启示[J]. 地理研究, 2018, 37(3):495-511.
|
| [19] |
|
| [20] |
|
| [21] |
|
| [22] |
|
| [23] |
|
/
| 〈 |
|
〉 |