
Influencing Factors of Spatial Structure Evolution of Producer Services in Beijing
Received date: 2018-09-18
Revised date: 2019-03-28
Online published: 2025-04-23
Based on the data of the second and third economic census in Beijing, and taking the postal area as the basic spatial unit, this paper empirically analyzes the evolution of the spatial pattern of the producer service industry in Beijing from the micro perspective. The spatial econometric model is applied to analyze the influencing factors of this process. According to the study, the distribution of the producer service industry in Beijing has a distinctive agglomeration feature, and the agglomeration degree increases first and then decreases with the increasing of distance from the postal area center to the city center. From the perspective of the agglomeration level, the degree of aggregation in the second and third economic census periods shows a trend of central concentration, and the overall trend of development is weakened. The distance which is from the center of the postal area to the nearest subway station, the airport, and the central axis, etc. has an important negative impact on producer service industry agglomeration. The role of road network density and distance from manufacturing centers is weak. Both the new policy zones and the planning of development zone have an important positive impact on the agglomeration of producer services. The two agglomeration levels of producer services in the second and third economic census have a greater impact on the agglomeration of the current period. The above factors codetermine the "circle + polarization" spatial layout characteristic of Beijing's producer service industry. On the basis of empirical analysis, the paper proposes to scientifically guide the agglomeration level, agglomeration location and agglomeration process of producer services according to the influencing factors.
CHEN Hongxia . Influencing Factors of Spatial Structure Evolution of Producer Services in Beijing[J]. Economic geography, 2019 , 39(4) : 128 -135 . DOI: 10.15957/j.cnki.jjdl.2019.04.016
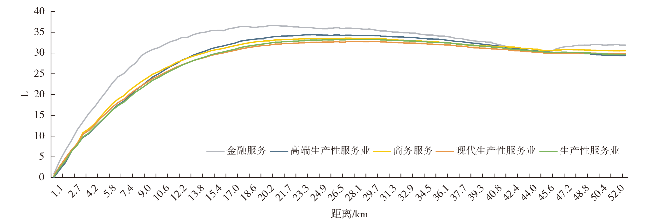
图1 二经普期间北京市生产性服务业空间集聚特征Fig.1 Spatial agglomeration characteristics of Beijing's producer service industry during the period of the second economic census |
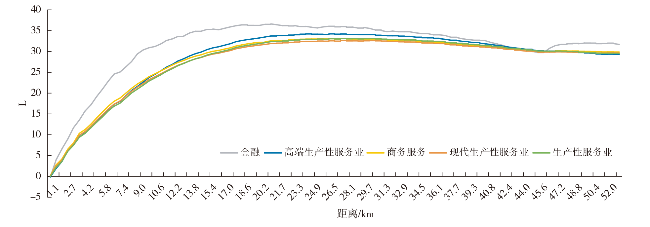
图2 三经普期间北京市生产性服务业空间集聚特征Fig.2 Spatial agglomeration characteristics of Beijing's producer service industry during the period of the third economic census |
表1 两次经济普查间生产性服务业L值中峰值距离和峰值高度比较Tab.1 Comparison of peak distance and peak height in L value of producer service industry in the second and third economic census |
| 距离 | 研发 | 金融 | 信息 | 商务 | 传统 | 高端 | 现代 | 生产性 服务业 | |
|---|---|---|---|---|---|---|---|---|---|
| 五环 | Ⅰ | 30.07 | 35.39 | 30.57 | 30.57 | 27.42 | 31.05 | 29.45 | 29.59 |
| Ⅱ | 29.53 | 35.31 | 29.85 | 29.68 | 26.56 | 30.45 | 29.02 | 29.13 | |
| 21 | Ⅰ | 33.10 | 36.65 | 34.00 | 33.15 | 31.15 | 33.97 | 32.14 | 32.61 |
| Ⅱ | 32.78 | 36.62 | 33.79 | 32.54 | 30.22 | 33.72 | 31.90 | 32.35 | |
| 24 | Ⅰ | 33.69 | 36.13 | 34.58 | 33.50 | 31.92 | 34.40 | 32.59 | 33.12 |
| Ⅱ | 33.41 | 36.04 | 34.49 | 32.98 | 31.07 | 34.21 | 32.43 | 32.94 | |
| 六环 | Ⅰ | 33.73 | 36.07 | 34.42 | 33.51 | 32.24 | 34.34 | 32.70 | 33.22 |
| Ⅱ | 33.40 | 35.82 | 34.44 | 32.98 | 31.11 | 34.16 | 32.44 | 32.92 | |
| 27 | Ⅱ | 33.54 | 36.06 | 34.38 | 33.07 | 31.44 | 34.23 | 32.56 | 33.06 |
| 28 | Ⅰ | 33.73 | 35.99 | 34.33 | 33.57 | 32.35 | 34.29 | 32.77 | 33.25 |
| Ⅱ | 33.53 | 35.98 | 34.34 | 33.08 | 31.59 | 34.19 | 32.60 | 33.09 | |
| 30 | Ⅰ | 33.68 | 35.80 | 34.18 | 33.48 | 32.57 | 34.18 | 32.74 | 33.25 |
| 31 | Ⅱ | 33.43 | 35.16 | 34.03 | 32.93 | 31.87 | 33.92 | 32.55 | 33.01 |
注:距离代表距城市中心距离(km),Ⅰ、Ⅱ分别代表二经普和三经普。 |
表2 回归变量指标选取及说明Tab.2 Selection and description of regression variable indicators |
| 传统区位因素 | 政策因素 | 集聚因素 | ||||||
|---|---|---|---|---|---|---|---|---|
| 变量 | 指标说明 | 假设 | 变量 | 指标说明 | 假设 | 变量 | 指标说明 | 假设 |
| X1 | 邮区内路网密度 | 正 | X7 | 政策新区 | 正 | X9 | 二经普生产性服务业集聚度 | 正 |
| X2 | 邮区中心到最近地铁站距离 | 负 | X8 | 首都功能核心区;城市功能 拓展区;城市发展新区 | 正 | X10 | 二经普高端生产性服务业集聚度 | 正 |
| X3 | 邮区中心到中轴线中心距离 | 负 | X11 | 二经普现代生产性服务业集聚度 | 正 | |||
| X4 | 邮区中心到中关村(高校科研 院所集中地)距离 | 负 | X12 | 二经普传统生产性服务业集聚度 | 正 | |||
| X5 | 邮区中心到制造业中心距离 | 负 | X13 | 三经普生产性服务业集聚度 | 正 | |||
| X6 | 区中心到机场距离 | 负 | X14 | 三经普高端生产性服务业集聚度 | 正 | |||
| X15 | 三经普现代生产性服务业集聚度 | 正 | ||||||
| X16 | 三经普传统生产性服务业集聚度 | 正 | ||||||
表3 各变量指标的描述性统计分析Tab.3 Statistical results of various variable indicators |
| 变量 | 指标说明 | 单位 | 最大值 | 平均值 | 最小值 |
|---|---|---|---|---|---|
| X1 | 邮区内路网密度 | km/km2 | 19.68 | 4.10 | 0.00 |
| X2 | 邮区中心到最近地铁站距离 | km | 108.24 | 18.24 | 0.01 |
| X3 | 邮区中心到中轴线中心距离 | km | 163.84 | 50.42 | 1.46 |
| X4 | 邮区中心到中关村(高校科研院所集中地)距离 | km | 149.88 | 44.11 | 0.02 |
| X5 | 邮区中心到制造业中心距离 | km | 122.87 | 24.25 | 0.01 |
| X6 | 区中心到机场距离 | km | 128.67 | 49.07 | 0.05 |
| 变量 | 指标说明 | 单位 | 1(是) | 0(否) | |
| X7 | 政策新区 | 1,0 | 53个 | 262 | |
| X8 | 首都功能核心区;城市功能拓展区;城市发展新区 | 1,0 | 212个 | 103 | |
| 变量 | 指标说明 | 单位 | 最大值 | 平均值 | 最小值 |
| X9 | 二经普生产性服务业集聚度 | 1 | 0.0590 | 0.0024 | -0.0047 |
| X10 | 二经普高端生产性服务业集聚度 | 1 | 0.0570 | 0.0015 | -0.0021 |
| X11 | 二经普现代生产性服务业集聚度 | 1 | 0.0640 | 0.0021 | -0.0051 |
| X12 | 二经普传统生产性服务业集聚度 | 1 | 0.0414 | 0.0010 | -0.0034 |
| X13 | 三经普生产性服务业集聚度 | 1 | 0.0469 | 0.0017 | -0.0033 |
| X14 | 三经普高端生产性服务业集聚度 | 1 | 0.0467 | 0.0013 | -0.0022 |
| X15 | 三经普现代生产性服务业集聚度 | 1 | 0.0821 | 0.0016 | -0.0037 |
| X16 | 三经普传统生产性服务业集聚度 | 1 | 0.0523 | 0.0011 | -0.0036 |
表4 回归结果Tab.4 Regression results |
| Model | 2ps | 2tradi | 2high | 2modern | 3ps | 3tradi | 3high | 3modern |
|---|---|---|---|---|---|---|---|---|
| SEM | SEM | SLM | OLS | SLM | OLS | OLS | SLM | |
| X1 | ||||||||
| X2 | -0.1554** | -0.2255 | -0.4969* | -0.1985* | -0.4703*** | -0.6072* | -1.117408*** | -0.5051*** |
| X3 | -0.6379*** | -1.2948*** | -0.4739** | -1.8667*** | -2.1595*** | |||
| X4 | -0.5436*** | -1.1945** | -0.6195*** | |||||
| X5 | ||||||||
| X6 | -0.6368*** | -1.4014*** | -0.5817*** | -1.5981*** | -2.6163*** | |||
| X7 | 1.5309** | 2.7869*** | ||||||
| X8 | 1.4107** | 1.8172*** | ||||||
| X9 | 107.0024*** | |||||||
| X10 | -55.2413*** | |||||||
| X11 | 57.1900*** | 42.1965*** | ||||||
| X12 | 137.7771*** | |||||||
| X13 | 68.2284*** | |||||||
| X14 | 由于时间上的先后次序,三经普集聚度对二经普无影响 | |||||||
| X15 | ||||||||
| X16 | ||||||||
| cons | 18.2577*** | 26.2039*** | 7.7707*** | 46.8566*** | 64.2987*** | 8.2140*** | ||
| LAMBDA | 0.4575*** | 0.5344*** | ||||||
注:1.***p<0.01;**p<0.05;*p<0.1;2.表中ps、tradi、high、modern分别代指生产性服务业、传统生产性服务业、高端生产性服务业以及现代生产性服务业,2、3分别代指第二次经济普查和第三次经济普查。 |
| [1] |
|
| [2] |
|
| [3] |
张文忠. 大城市服务业区位理论及其实证研究[J]. 地理研究, 1999, 18(3):273-281.
|
| [4] |
赵群毅, 周一星. 北京都市区生产者服务业的空间结构——兼与西方主流观点的比较[J]. 城市规划, 2007(5):24-31.
|
| [5] |
闫小培, 钟韵. 区域中心城市生产性服务业的外向功能特征研究——以广州市为例[J]. 地理科学, 2005(5):537-543.
|
| [6] |
刘卫东, 金凤君, 张文忠, 等. 中国经济地理学研究进展与展望[J]. 地理科学进展. 2011, 30(12):1 479-1 487.
|
| [7] |
刘秀清, 谭越文. 大连市生产性服务业影响因素分析与评价[J]. 大连交通大学学报, 2011, 32(3):109-112.
|
| [8] |
张延吉, 吴凌燕, 秦波. 北京市生产性服务业的空间集聚及影响因素——基于连续平面的测度方法[J]. 中央财经大学学报, 2017(9):111-118.
|
| [9] |
何昊, 薛君. 西安市生产性服务业发展影响因素的实证研究[J]. 长安大学学报:社会科学版, 2016, 18(1):42-47.
|
| [10] |
万千欢, 千庆兰, 陈颖彪. 广州市生产性服务业影响因素研究[J]. 经济地理, 2014, 34(1):89-93.
|
| [11] |
张珣, 钟耳顺, 张小虎, 等. 2004—2008年北京城区商业网点空间分布与集聚特征[J]. 地理科学进展, 2013, 32(8):1 207-1 215.
|
| [12] |
张景秋, 陈叶龙. 北京城市办公空间的行业分布及集聚特征[J]. 地理学报, 2011, 66(10):1 299-1 308.
|
| [13] |
|
| [14] |
贺灿飞, 潘峰华. 产业地理集中、产业集聚与产业集群:测量与辨识[J]. 地理科学进展, 2007, 26(2):1-13.
|
| [15] |
|
| [16] |
|
| [17] |
|
| [18] |
陈红霞. 北京市生产性服务业空间分布和集聚特征的演变[J]. 经济地理, 2018, 38(5):108-116.
|
| [19] |
卢明华, 杨洁. 北京都市区服务业地域分工及其变化[J]. 经济地理, 2013, 33(2):97-104.
|
| [20] |
赵新正, 宁越敏, 魏也华. 上海外资生产空间演变及影响因素[J]. 地理学报, 2011, 66(10):1 390-1 402.
|
| [21] |
|
| [22] |
|
| [23] |
|
| [24] |
邱灵. 北京市生产性服务业空间结构演化机理研究[J]. 中国软科学, 2013(5):74-91.
|
| [25] |
耿诺. 北京城市轨道交通年内将突破600公里[N]. 北京日报,2017-08-08.
|
| [26] |
高觉民, 李晓慧. 生产性服务业与制造业的互动机理:理论与实证[J]. 中国工业经济, 2011(6):151-160.
|
| [27] |
陈晓峰, 陈昭锋. 生产性服务业与制造业协同集聚的水平及效应——来自中国东部沿海地区的经验证据[J]. 财贸研究, 2014(2):49-57.
|
/
| 〈 |
|
〉 |