
Industry Characteristics and Spatial Pattern of the Top 1 000 Global Innovation Listed Companies
Received date: 2020-04-01
Revised date: 2020-09-18
Online published: 2025-04-23
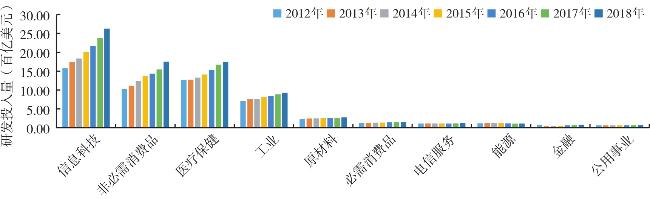
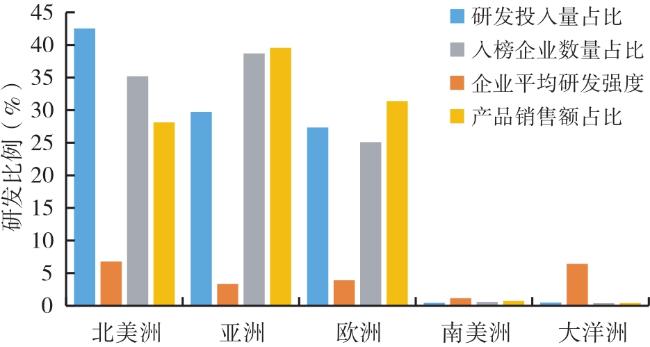
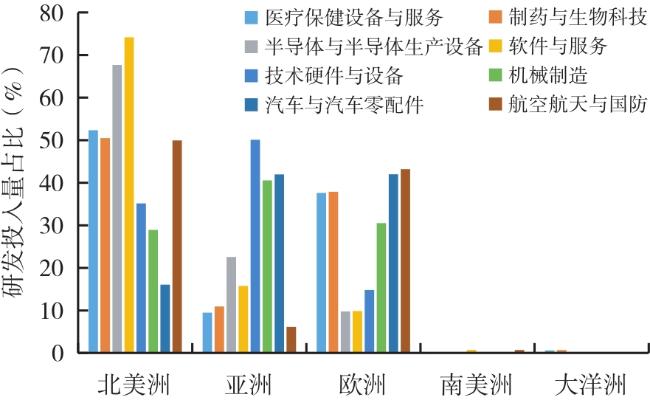
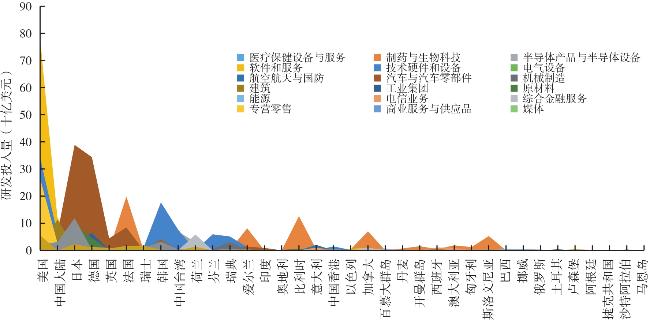
Based on the R&D data of the top 1000 global innovation listed companies,this paper makes a comprehensive analysis of their industry characteristics and spatial patterns,and discusses the implications for China's participation in global innovation cooperation and competition. The study shows that: 1) The global innovation industry has a wide coverage and diversified development trend is obvious. But there are obvious differences among industries. High-tech industry is the most important field of R&D investment. The R&D investment of basic manufacturing industry and service industry is gradually increasing,while that of other industries is relatively lagging behind. The gap among industries tends to increase. 2) At present,North America,Asia and Europe have their own innovative characteristics and dominate the overall pattern of global innovation. There are obvious differences in innovation ability and innovation field between countries and regions,and the spatial differentiation may be further expanded in the future. In order to ensure the safety of China's economic development and further enhance the industrial competitiveness,in addition to continuing to increase R&D investment in key areas,we should make use of innovation advantages and resources around the world by industry and region,actively integrate into the global innovation chain and promote the continuous improvement of China's innovation ability.
MA Jinghan , LIU Tianbao . Industry Characteristics and Spatial Pattern of the Top 1 000 Global Innovation Listed Companies[J]. Economic geography, 2021 , 41(1) : 121 -130 . DOI: 10.15957/j.cnki.jjdl.2021.01.014
表1 国家/地区的综合创新实力评价指标体系Tab.1 Evaluation index system of national (regional) comprehensive innovation strength |
| 要素层 | 权重 | 指标层 | 指标权重 | 补充说明 |
|---|---|---|---|---|
| 创新投入能力 | 0.375 | 研发投入量均值 | 0.125 | 2012—2018年研发投入量均值 |
| 各国企业平均研发强度 | 0.125 | 对企业数量≥10的国家/地区计算企业平均研发强度 | ||
| 高技术产业研发投入均值 | 0.125 | 主要包括信息科技、医疗保健、航空航天与国防等产业 | ||
| 创新产出能力 | 0.25 | 高技术产业销售额 | 0.125 | |
| 总销售额均值 | 0.125 | 2012—2018年总销售额均值 | ||
| 创新可持续发展能力 | 0.375 | 研发投入年均增长速度 | 0.125 | 2012—2018年国家/地区的研发投入量年均增长速度 |
| 入榜企业数量 | 0.125 | |||
| 行业覆盖度 | 0.125 | 采用21个行业组为基准研究各国/地区的行业覆盖度 |
表2 2012—2018年全球主要产业部门的创新强度变化(%)Tab.2 Changes in innovation intensity of major global industrial sectors between 2012 and 2018(%) |
| 产业 | 2012 | 2013 | 2014 | 2015 | 2016 | 2017 | 2018 |
|---|---|---|---|---|---|---|---|
| 医疗保健 | 11.36 | 11.07 | 10.90 | 10.85 | 11.12 | 11.34 | 11.31 |
| 信息科技 | 7.73 | 7.67 | 7.86 | 8.34 | 8.53 | 9.09 | 9.15 |
| 非必需消费品 | 4.09 | 4.22 | 4.28 | 4.28 | 4.25 | 4.18 | 4.47 |
| 金融 | 2.32 | 2.30 | 2.65 | 2.85 | 2.96 | 3.43 | 3.44 |
| 工业 | 3.03 | 3.04 | 3.00 | 3.06 | 3.09 | 3.14 | 3.09 |
| 原材料 | 1.98 | 2.10 | 2.15 | 2.11 | 2.28 | 2.31 | 2.27 |
| 电信服务 | 1.66 | 1.75 | 1.72 | 1.58 | 1.45 | 1.46 | 1.55 |
| 必需消费品 | 1.36 | 1.32 | 1.36 | 1.40 | 1.46 | 1.45 | 1.42 |
| 公用事业 | 0.62 | 0.58 | 0.55 | 0.56 | 0.80 | 0.70 | 0.76 |
| 能源 | 0.33 | 0.32 | 0.35 | 0.40 | 0.51 | 0.56 | 0.47 |
表3 全球主要产业的集中度水平Tab.3 Concentration level of major industries in the world |
| 产业/集中度 | 根据研发投入量计算的集中度水平(%) | 根据销售额计算的集中度水平(%) | |||||||
|---|---|---|---|---|---|---|---|---|---|
| 2012 | 2014 | 2016 | 2018 | 2012 | 2014 | 2016 | 2018 | ||
| 信息科技 | 21.68 | 23.18 | 23.01 | 21.68 | 21.55 | 24.03 | 23.48 | 16.99 | |
| 非必需消费品 | 29.21 | 27.85 | 30.83 | 32.23 | 25.97 | 25.73 | 24.97 | 22.24 | |
| 医疗保健 | 28.55 | 26.26 | 23.48 | 22.99 | 20.89 | 18.51 | 16.49 | 14.52 | |
| 工业 | 24.02 | 21.48 | 20.56 | 18.86 | 16.07 | 15.40 | 16.03 | 13.11 | |
| 原材料 | 26.30 | 26.23 | 26.46 | 26.25 | 19.14 | 18.59 | 19.86 | 15.61 | |
| 必需消费品 | 42.97 | 41.80 | 40.74 | 37.96 | 30.78 | 30.57 | 29.37 | 23.67 | |
| 电信服务 | 56.38 | 55.06 | 55.63 | 47.86 | 55.69 | 54.47 | 54.65 | 54.95 | |
| 能源 | 44.29 | 45.43 | 43.67 | 43.87 | 45.54 | 43.99 | 47.93 | 51.32 | |
| 金融 | 94.35 | 94.14 | 93.88 | 89.09 | 97.58 | 97.55 | 97.46 | 91.69 | |
| 公用事业 | 79.26 | 71.56 | 76.83 | 65.32 | 73.97 | 71.71 | 86.42 | 57.15 | |
表4 2012—2018年全球研发投入规模的碎化指数和均匀度指数Tab.4 Fragmentation index and evenness index of global R&D investment scale between 2012 and 2018 |
| 年份 | 2012 | 2013 | 2014 | 2015 | 2016 | 2017 | 2018 |
|---|---|---|---|---|---|---|---|
| 碎化指数 | 3.8747 | 3.8937 | 3.8917 | 3.8722 | 3.8722 | 3.8830 | 3.8697 |
| 均匀度指数 | 0.5208 | 0.5230 | 0.5225 | 0.5274 | 0.5336 | 0.5391 | 0.5390 |
表5 2018年世界各国及地区创新综合实力得分及排名Tab.5 Scores and rankings of innovation comprehensive strength of countries (regions) in 2018 |
| 排名 | 国家(地区) | 分值 | 排名 | 国家(地区) | 分值 | 排名 | 国家(地区) | 分值 | 排名 | 国家(地区) | 分值 |
|---|---|---|---|---|---|---|---|---|---|---|---|
| 1 | 美国 | 80.65 | 10 | 中国香港 | 14.34 | 19 | 比利时 | 9.34 | 28 | 芬兰 | 6.02 |
| 2 | 日本 | 37.45 | 11 | 中国台湾 | 13.89 | 20 | 奥地利 | 9.18 | 29 | 巴西 | 4.70 |
| 3 | 中国大陆 | 31.73 | 12 | 马恩岛 | 12.43 | 21 | 卢森堡 | 8.26 | 30 | 沙特阿拉伯 | 4.40 |
| 4 | 德国 | 23.00 | 13 | 爱尔兰 | 12.22 | 22 | 意大利 | 8.01 | 31 | 挪威 | 4.39 |
| 5 | 韩国 | 20.22 | 14 | 阿根廷 | 11.94 | 23 | 以色列 | 7.87 | 32 | 匈牙利 | 4.32 |
| 6 | 法国 | 20.20 | 15 | 印度 | 11.41 | 24 | 澳大利亚 | 7.48 | 33 | 斯洛文尼亚 | 4.19 |
| 7 | 英国 | 20.11 | 16 | 开曼群岛 | 10.80 | 25 | 加拿大 | 7.36 | 34 | 捷克共和国 | 2.67 |
| 8 | 荷兰 | 16.69 | 17 | 瑞典 | 10.43 | 26 | 西班牙 | 7.27 | 35 | 百慕大群岛 | 1.16 |
| 9 | 瑞士 | 15.78 | 18 | 土耳其 | 10.07 | 27 | 丹麦 | 7.00 | 36 | 俄罗斯 | 0.18 |
| [1] |
盖红波. 全球科技投入最新态势分析[J]. 科技进步与对策, 2013, 30(11):1-6.
|
| [2] |
张永凯, 杜德斌. 我国R&D活动区域差异的形成机制分析[J]. 科技与经济, 2012, 25(3):66-70.
|
| [3] |
|
| [4] |
|
| [5] |
|
| [6] |
李国团. 从2017年全球创新1000强排行榜看钢铁公司研发支出[J]. 冶金经济与管理, 2018(2):22-24.
|
| [7] |
|
| [8] |
|
| [9] |
|
| [10] |
|
| [11] |
朱有为, 徐康宁. 中国高技术产业研发效率的实证研究[J]. 中国工业经济, 2006(11):38-45.
|
| [12] |
崔维军, 王进山, 陈凤, 等. 中国与发达国家企业研发投入的国际比较——基于研发投入50强的实证分析[J]. 科学学与科学技术管理, 2015, 36(8):128-139.
|
| [13] |
黄亮, 杜德斌, 王宝平. 全球产业研发的主要特征与发展趋势——基于全球研发1000强企业的分析[J]. 科技进步与对策, 2012, 29(9):54-57.
|
| [14] |
洪震, 揭筱纹. 全球最优秀公司的R&D投入、经营和启示——基于《2009年企业研发排行榜》的分析[J]. 西南民族大学学报:人文社会科学版, 2011, 32(1):119-123.
|
| [15] |
|
| [16] |
刘懿, 方玉. 国有上市企业运营效率测算和时空演进分析[J]. 经济地理, 2020, 40(2):117-124,131.
|
| [17] |
高菠阳, 尉翔宇, 黄志基, 等. 企业异质性与中国对外直接投资——基于中国微观企业数据的研究[J]. 经济地理, 2019, 39(10):130-138.
|
| [18] |
巫细波. 外资主导下的汽车制造业空间分布特征及其影响因素——以广州为例[J]. 经济地理, 2019, 39(7):119-128.
|
| [19] |
尹志锋, 陈明. 大型研发企业的研发投入分析——基于全球前2000家企业研发投入数据[J]. 当代经济管理, 2011, 33(5):22-27.
|
| [20] |
|
| [21] |
彼得·迪肯. 全球性转变:重塑21世纪的全球经济地图[M]. 刘卫东, 等,译. 北京: 商务印书馆, 2007.
|
| [22] |
成力为, 李翘楚. 企业研发投入结构特征与经济增长模式——基于中国与主要国家企业研发数据的比较[J]. 科学学研究, 2017, 35(5):700-708.
|
| [23] |
廖伟. 中国与OECD国家R&D投入比较研究[J]. 特区经济, 2010(8):107-109.
|
| [24] |
赵云峰. 当前国际经济背景下我国产业发展分析[J]. 中国商论, 2018(33):166-167.
|
| [25] |
马名杰. 全球创新格局变化的新趋势及对我国的影响[J]. 经济纵横, 2016(7):108-112.
|
| [26] |
石奇, 杜德斌, 张祥, 等. 全球创新资金的空间格局及其演变特征[J]. 中国科技论坛, 2013(11):124-130.
|
| [27] |
段德忠, 杜德斌, 杨凡, 等. 产业技术变迁与全球技术创新体系空间演化[J]. 地理科学, 2019, 39(9):1378-1387.
|
| [28] |
杜德斌, 周天瑜, 王勇, 等. 世界R&D产业的发展现状及趋势[J]. 世界地理研究, 2007(1):1-7.
|
| [29] |
|
| [30] |
|
| [31] |
白文扬, 李雨. 我国工业产业集中度实证研究[J]. 中国工业经济研究, 1994(11):45-50.
|
| [32] |
关爱萍, 陈锐. 产业集聚水平测度方法的研究综述[J]. 工业技术经济, 2014, 33(12):150-155.
|
| [33] |
史雅娟, 朱永彬, 冯德显, 等. 中原城市群多中心网络式空间发展模式研究[J]. 地理科学, 2012, 32(12):1430-1438.
|
| [34] |
罗震东, 朱查松, 张京祥. 都市区域空间集聚—碎化趋势研究——江苏沿江都市区域的实证[J]. 人文地理, 2009, 24(1):22-27,52.
|
| [35] |
李军军, 朱浩军. 中国城市创新竞争力的内涵及其评价指标体系[J]. 经济研究参考, 2018(45):52-59.
|
| [36] |
张仁开, 杜德斌. 中国R&D产业发展的空间差异及地域分类研究[J]. 地域研究与开发, 2006(4):20-24.
|
| [37] |
陈黎, 曾惠芬, 黄智华. 科技创新竞争力评价研究——以广州为例[J]. 科技管理研究, 2012, 32(12):12-15.
|
/
| 〈 |
|
〉 |