
Causes of Economic Rise and Fall in the Yellow River Basin After 2000: Based on the Shift-Share Analysis Method
Received date: 2020-10-16
Revised date: 2020-12-30
Online published: 2025-04-23
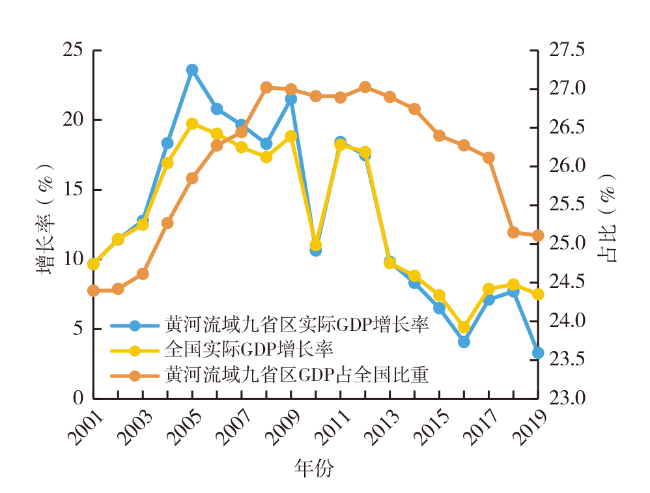
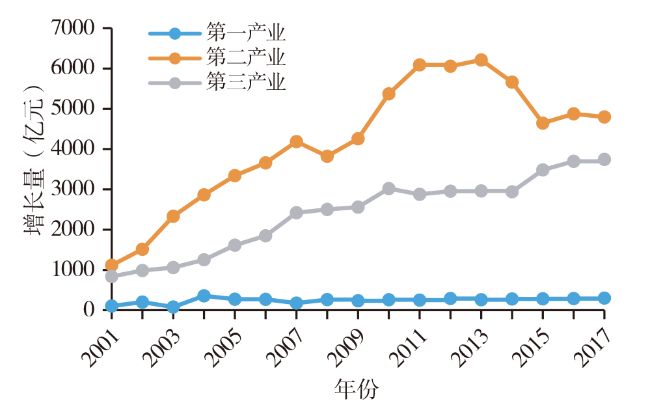
Since 2000,the economy of the Yellow River Basin has experienced the ups and downs. This paper takes 92 cities (prefectures and leagues) in the Yellow River Basin as the research unit,and explores what causes the economic fluctuation in the Yellow River Basin from 2001 to 2017 at the three levels which are respectively macro,mediun and micro perspectives. It mainly uses the shift-share analysis method and spatial expansion model. The results show that,the GDP growth rate of the Yellow River Basin shows an inverted U-shaped pattern from 2001 to 2017. From 2001 to 2008,the economic growth was mainly due to advantaged natural resources and the rapid development of traditional industries. From 2009 to 2012,due to the impact of the economic policies introduced after the financial crisis,there were great fluctuations. Since 2013,the river basin economy has been on a downward trend,which is caused by three reasons: the structural advantages of the secondary industry have weakened,the industrial competitiveness is insufficient,and the competitiveness of the tertiary industry has declined. From the perspective of the upper,middle and lower reaches,the development of the middle and lower secondary industry and the lower primary industry need to be improved urgently,which has a great negative impact on the economic growth in the basin. The downstream secondary industry and the tertiary industry are developing rapidly and have become the key players to drive the regional economic growth. From the city level,it's about 50% of the cities (prefectures and leagues) which primary industry development is relatively stable,nearly 62% of the cities (prefectures and leagues) which secondary industry shows a trend of decline,and about 66% of the cities (prefectures and leagues) which tertiary industry is in a state of vigorous development. Finally,it is proposed that,based on the ecological protection and high-quality development,it should promote the transformation and upgrading of the industrial structure in the Yellow River Basin,follow the laws of the ecological environment in the upper, middle and lower reaches as well as both sides of the river, integrate the transformation and development of the ecosystem,cities and industries,and formulate precise high-quality development policies for the industries in the Yellow River Basin.
YANG Kaizhong , SU Yue , GU Yun . Causes of Economic Rise and Fall in the Yellow River Basin After 2000: Based on the Shift-Share Analysis Method[J]. Economic geography, 2021 , 41(1) : 10 -20 . DOI: 10.15957/j.cnki.jjdl.2021.01.002
表1 黄河流域三次产业偏离—份额分析(单位:亿元)Tab.1 The shift-share analysis of three industries in the Yellow River Basin( unit:100 million RMB) |
| 增长量(D) | 分享成分(NE) | 转移成分(TD) | 结构性转移增(NSE) | 竞争性转移增长(CE) | ||
|---|---|---|---|---|---|---|
| 2001—2017 | 第一产业 | 246.0502 | 477.1189 | -231.0687 | -264.1784 | 33.1097 |
| 第二产业 | 4 164.8875 | 3 097.2996 | 1 067.5879 | 89.5997 | 977.9881 | |
| 第三产业 | 2 397.9472 | 1 844.0114 | 553.9358 | 139.5352 | 414.4006 | |
| 2001—2003 | 第一产业 | 128.5672 | 333.2567 | -204.6895 | -240.4238 | 35.7344 |
| 第二产业 | 1 654.2080 | 968.0989 | 686.1091 | 135.7167 | 550.3925 | |
| 第三产业 | 961.4331 | 705.6778 | 255.7554 | 62.7102 | 193.0451 | |
| 2004—2008 | 第一产业 | 268.9320 | 522.0793 | -253.1473 | -303.5983 | 50.4510 |
| 第二产业 | 3 574.1477 | 2 430.7176 | 1 143.4301 | 126.6093 | 1 016.8207 | |
| 第三产业 | 1 927.6664 | 1 497.1476 | 430.5188 | 133.8042 | 296.7145 | |
| 2009—2012 | 第一产业 | 259.4681 | 525.3403 | -265.8722 | -287.5532 | 21.6811 |
| 第二产业 | 5 444.3970 | 3 683.9091 | 1 760.4879 | 412.5361 | 1 347.9518 | |
| 第三产业 | 2 853.9092 | 2 189.8843 | 664.0248 | -53.3948 | 717.4196 | |
| 2013—2017 | 第一产业 | 282.9237 | 479.8986 | -196.9749 | -220.3114 | 23.3365 |
| 第二产业 | 5 238.4273 | 4 572.1144 | 666.3130 | -233.4291 | 899.7420 | |
| 第三产业 | 3 365.3668 | 2 597.1770 | 768.1898 | 345.7051 | 422.4848 | |
表2 黄河流域上中下游总体经济偏离—份额分析(单位:亿元)Tab.2 The shift-share analysis of the overall economy in the upper,middle and lower reaches of the Yellow River Basin ( unit:100 million RMB) |
| 时间 | 增长量(D) | 分享成分(NE) | 转移成分(TD) | 结构性转移增长(NSE) | 竞争性转移增长(CE) | |
|---|---|---|---|---|---|---|
| 2001—2003 | 上游 | 385.1006 | 246.1323 | 138.9683 | -8.6349 | 147.6031 |
| 中游 | 442.6322 | 349.0402 | 93.5920 | 5.0126 | 88.5793 | |
| 下游 | 1 916.4757 | 1 411.8608 | 504.6149 | -38.3747 | 542.9896 | |
| 2004—2008 | 上游 | 814.3966 | 581.2036 | 233.1930 | -9.6709 | 242.8639 |
| 中游 | 863.6542 | 735.8673 | 127.7870 | 6.6046 | 121.1824 | |
| 下游 | 4 092.6947 | 3 132.8736 | 959.8212 | -40.1184 | 999.9396 | |
| 2009—2012 | 上游 | 1 387.7907 | 888.2685 | 499.5223 | 9.4483 | 490.0740 |
| 中游 | 1 372.7216 | 1 014.7877 | 357.9339 | 12.9373 | 344.9966 | |
| 下游 | 5 797.2621 | 4 496.0777 | 1 301.1844 | 49.2024 | 1 251.9820 | |
| 2013—2017 | 上游 | 1 234.6534 | 1 116.7006 | 117.9528 | -25.5451 | 143.4979 |
| 中游 | 1 273.1170 | 1 205.5375 | 67.5795 | -5.6781 | 73.2577 | |
| 下游 | 6 378.9481 | 5 326.9518 | 1 051.9963 | -76.8121 | 1 128.8084 | |
表3 黄河流域上中下游三次产业偏离—份额分析(时间:2001—2017;单位:亿元)Tab.3 The shift-share analysis of three industries in the upper,middle and lower reaches of the Yellow River Basin(2001-2017; unit:100 million RMB) |
| 第一产业 | 第二产业 | 第三产业 | |||||||||
|---|---|---|---|---|---|---|---|---|---|---|---|
| 上游 | 中游 | 下游 | 上游 | 中游 | 下游 | 上游 | 中游 | 下游 | |||
| 增长量(D) | 44.1112 | 35.8066 | 166.1323 | 649.8848 | 596.4281 | 2 918.5747 | 303.1637 | 397.3323 | 1 697.4512 | ||
| 分享成分(NE) | 69.8264 | 63.6862 | 343.6062 | 443.7295 | 474.8443 | 2 178.7258 | 238.2672 | 332.8398 | 1 272.9044 | ||
| 转移成分(TD) | -25.7153 | -27.8796 | -177.4739 | 206.1554 | 121.5838 | 739.8489 | 64.8966 | 64.4925 | 424.5468 | ||
| 结构性转移增长(NSE) | -38.3833 | -35.0524 | -190.7427 | 10.7194 | 14.3367 | 64.5437 | 18.0056 | 24.9169 | 96.6127 | ||
| 竞争性转移增长(CE) | 12.6680 | 7.1729 | 13.2688 | 195.4360 | 107.2471 | 675.3052 | 46.8910 | 39.5756 | 327.9341 | ||
表4 莫兰指数Tab.4 Moran index |
| 年份 | 第一产业 | 第二产业 | 第三产业 |
|---|---|---|---|
| 2001 | 0.236*** | 0.215*** | 0.143*** |
| 2002 | 0.233*** | 0.212*** | 0.138*** |
| 2003 | 0.226*** | 0.217*** | 0.140*** |
| 2004 | 0.220*** | 0.228*** | 0.134*** |
| 2005 | 0.223*** | 0.232*** | 0.111*** |
| 2006 | 0.222*** | 0.230*** | 0.117*** |
| 2007 | 0.221*** | 0.229*** | 0.120*** |
| 2008 | 0.218*** | 0.224*** | 0.120*** |
| 2009 | 0.217*** | 0.212*** | 0.113*** |
| 2010 | 0.214*** | 0.201*** | 0.118*** |
| 2011 | 0.212*** | 0.186*** | 0.118*** |
| 2012 | 0.206*** | 0.180*** | 0.118*** |
| 2013 | 0.202*** | 0.175*** | 0.123*** |
| 2014 | 0.204*** | 0.179*** | 0.118*** |
| 2015 | 0.201*** | 0.183*** | 0.115*** |
| 2016 | 0.200*** | 0.181*** | 0.114*** |
| 2017 | 0.202*** | 0.189*** | 0.108*** |
注:***p<0.01。 |
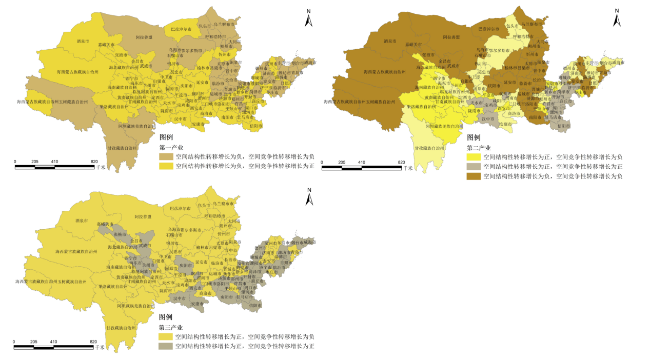
表5 各市(州、盟)第一产业空间结构性转移增长与空间竞争性转移增长演变类型表Tab.5 The evolution types of spatial structural transfer growth and spatial competitive transfer growth of the primary industry in each city (prefecture and league) |
| Ⅰ类 | Ⅱ类 | Ⅲ类 | Ⅳ类 | |
|---|---|---|---|---|
| 稳定型 | <无> | <无> | 上游:嘉峪关市、天水市、酒泉市、庆阳市、临夏州、固原市、中卫市;中游:宝鸡市、咸阳市、榆林市、商洛市;下游:淄博市、濮阳市、济源市 | <无> |
| 相对稳定型 | <无> | <无> | 上游:兰州市、白银市、武威市、平凉市、定西市、陇南市、甘南州、海东市、海北州、黄南州、海南州、果洛州、海西州;中游:<无>;下游:济宁市、日照市、聊城市、滨州市、洛阳市、平顶山市、鹤壁市、新乡市、南阳市 | 上游:阿坝州、甘孜州;中游:大同市、阳泉市、晋城市、朔州市、吕梁市;下游:青岛市、潍坊市、菏泽市 |
| 发展型 | <无> | <无> | 上游:巴彦淖尔市、金昌市、张掖市、西宁市、银川市、石嘴山市、吴忠市;中游:忻州市、西安市、铜川市、渭南市、延安市、汉中市、安康市;下游:开封市、焦作市、三门峡市、商丘市、信阳市、周口市、驻马店市 | <无> |
| 衰退型 | <无> | <无> | <无> | 上游:呼和浩特市、包头市、乌海市、鄂尔多斯市、乌兰察布市、阿拉善盟、玉树州;中游:太原市、长治市、晋中市、运城市、临汾市;下游:济南市、枣庄市、东营市、烟台市、泰安市、威海市、莱芜市、临沂市、德州市、郑州市、安阳市、许昌市、漯河市 |
| 其他 | <无> | <无> | <无> | <无> |
注:1.Ⅰ类表示空间结构性转移增长和空间竞争性转移增长皆为正;Ⅱ类表示空间结构性转移增长为正但空间竞争性转移增长为负;Ⅲ类表示空间结构性转移增长为负但空间竞争性转移增长为正;Ⅳ类表示空间结构性转移增长和空间竞争性转移增长皆为负。2.稳定型:任何阶段都是同一类型;相对稳定型:初期阶段和末期阶段类型一致,但中间有所波动;发展型:从初期阶段任何类型到末期阶段Ⅰ类,或者从初期阶段Ⅳ类到末期阶段任何类型;衰退型:从初期阶段Ⅰ类到末期阶段任何类型,或者从初期阶段任何类型到末期阶段Ⅳ类;其他:从初期阶段Ⅱ类到末期阶段Ⅲ类,或者从初期阶段Ⅲ类到末期阶段Ⅱ类。3.初期阶段定义为2001—2003年,末期阶段定义为2013—2017年。4.表6和表7同注。 |
表6 各市(州、盟)第二产业空间结构性转移增长与空间竞争性转移增长演变类型表Tab.6 The evolution types of spatial structural transfer growth and spatial competitive transfer growth of the secondary industry in each city(prefecture and league) |
| Ⅰ类 | Ⅱ类 | Ⅲ类 | Ⅳ类 | |
|---|---|---|---|---|
| 稳定型 | 上游:<无>;中游:<无>;下游:聊城市、菏泽市、新乡市 | <无> | <无> | <无> |
| 相对稳定型 | 上游:<无>;中游:<无>;下游:济宁市、商丘市 | 上游:兰州市、平凉市、陇南市、黄南州、海南州;中游:<无>;下游:平顶山市 | <无> | <无> |
| 发展型 | 上游:天水市;中游:铜川市、宝鸡市、汉中市;下游:开封市、许昌市、漯河市、信阳市、周口市、驻马店市 | <无> | <无> | <无> |
| 衰退型 | <无> | 上游:甘南州、阿坝州、海北州、果洛州;中游:西安市;下游:枣庄市、安阳市 | 上游:包头市、呼和浩特市、鄂尔多斯市、甘孜州、西宁市、海东市、吴忠市、固原市;中游:<无>;下游:潍坊市、威海市、日照市、莱芜市、德州市、焦作市、济源市 | 上游:乌海市、巴彦淖尔市、乌兰察布市、阿拉善盟、金昌市、武威市、海西州、嘉峪关市、白银市、张掖市、酒泉市、庆阳市、玉树州、石嘴山市;中游:大同市、运城市、临汾市、延安市、榆林市、太原市、阳泉市、长治市、晋城市、朔州市、晋中市、忻州市、吕梁市;下游:青岛市、泰安市、临沂市、滨州市、淄博市、洛阳市、三门峡市、南阳市 |
| 其他 | <无> | <无> | 上游:定西市、临夏州、银川市、中卫市;中游:咸阳市、渭南市、安康市、商洛市;下游:济南市、东营市、烟台市、郑州市、鹤壁市、濮阳市 | <无> |
表7 各市(州、盟)第三产业空间结构性转移增长与空间竞争性转移增长演变类型表Tab.7 The evolution types of spatial structural transfer growth and spatial competitive transfer growth of the tertiary industry in each city(prefecture and league) |
| Ⅰ类 | Ⅱ类 | Ⅲ类 | Ⅳ类 | |
|---|---|---|---|---|
| 稳定型 | <无> | <无> | <无> | <无> |
| 相对稳定型 | 上游:<无>;中游:<无>;下游:威海市、烟台市、临沂市、德州市、聊城市、济宁市、日照市 | 上游:巴彦淖尔市;中游:大同市、朔州市;下游:淄博市、枣庄市、莱芜市 | <无> | <无> |
| 发展型 | 上游:临夏州、兰州市、嘉峪关市、武威市、张掖市、庆阳市、西宁市、海东市;中游:西安市、铜川市、汉中市、安康市;下游:潍坊市、菏泽市、郑州市、开封市、洛阳市、安阳市、濮阳市、许昌市、漯河市、三门峡市、南阳市、商丘市、信阳市、周口市、驻马店市 | 上游:乌海市、阿拉善盟、甘孜州、白银市、天水市、平凉市、定西市、陇南市、海北州、果洛州、银川市、石嘴山市、吴忠市、中卫市;中游:太原市、阳泉市、长治市、晋城市、晋中市、运城市、忻州市、临汾市、吕梁市、宝鸡市、咸阳市、渭南市、延安市、榆林市、商洛市;下游:平顶山市、鹤壁市、新乡市、焦作市、济源市 | <无> | <无> |
| 衰退型 | <无> | 上游:包头市、乌兰察布市;中游:<无>;下游:济南市、青岛市、东营市、泰安市、滨州市 | <无> | <无> |
| 其他 | <无> | 上游:呼和浩特市、鄂尔多斯市、玉树州、阿坝州、酒泉市、甘南州、黄南州、金昌市、海南州、海西州、固原市;中游:<无>;下游:<无> | <无> | <无> |
| [1] |
杨开忠, 董亚宁. 黄河流域生态保护和高质量发展制约因素与对策——基于“要素—空间—时间”三维分析框架[J]. 水利学报, 2020, 51(9):1 038-1 047.
|
| [2] |
杨开忠. “五个坚持”让黄河成为造福人民的幸福河[J]. 中国国情国力, 2020(8):4-5.
|
| [3] |
李敏纳, 蔡舒, 覃成林. 黄河流域经济空间分异态势分析[J]. 经济地理, 2011, 31(3):379-419.
|
| [4] |
陈耀, 张可云, 陈晓东, 等. 黄河流域生态保护和高质量发展[J]. 区域经济评论, 2020(1):8-22.
|
| [5] |
徐勇, 王传胜. 黄河流域生态保护和高质量发展:框架、路径与对策[J]. 中国科学院院刊, 2020, 35(7):875-883.
|
| [6] |
刘华军, 曲惠敏. 黄河流域绿色全要素生产率增长的空间格局及动态演进[J]. 中国人口科学, 2019(6):59-70,127.
|
| [7] |
杨丹, 常歌, 赵建吉. 黄河流域经济高质量发展面临难题与推进路径[J]. 中州学刊, 2020(7):28-33.
|
| [8] |
张可云, 张颖. 不同空间尺度下黄河流域区域经济差异的演变[J]. 经济地理, 2020, 40(7):1-11.
|
| [9] |
|
| [10] |
|
| [11] |
杨开忠. 中国区域经济系统研究(中)——区域经济理论、应用与政策[J]. 中国工业经济, 1989(4):26-36.
|
| [12] |
袁晓玲, 张宝山, 杨万平. 动态偏离—份额分析法在区域经济中的应用[J]. 经济经纬, 2008(1):55-58.
|
| [13] |
|
| [14] |
|
| [15] |
杨开忠. 中国地区工业结构变化与区际增长和分工[J]. 地理学报, 1993, 48(6):481-490.
|
| [16] |
|
| [17] |
尹凯. 基于偏离—份额分析法的山东省产业结构优化研究[J]. 经济研究导刊, 2019(32):26-31.
|
| [18] |
张冬平, 郑博阳. 基于偏离—份额分析法的河南省制造业竞争力研究[J]. 河南农业大学学报, 2017, 51(5):741-746.
|
| [19] |
胡颖琦. 基于偏离份额分析法的青海省产业结构问题研究[J]. 金融经济, 2018(18):94-95.
|
| [20] |
郭庆, 邓凯文. 基于偏离—份额分析法的山东省资源型城市产业结构研究[J]. 经济与管理评论, 2016, 32(6):148-154.
|
| [21] |
陈曦, 张锐, 曹芳萍. 西北地区产业结构演变及优化研究[J]. 北京林业大学学报:社会科学版, 2017, 16(4):69-78.
|
| [22] |
李创. 基于偏离份额分析法的河南省服务业竞争力评价[J]. 现代管理科学, 2015,(11):85-87.
|
| [23] |
姜玲, 张爱宁, 李睆玲. 甘肃省产业结构空间分异研究——基于偏离—份额分析法和ESDA法[J]. 资源开发与市场, 2015, 31(2):150-154.
|
| [24] |
王卓, 杨光磊. 基于动态偏离—份额分析法空间模型的陕西省产业竞争力分析[J]. 西安石油大学学报:社会科学版, 2016, 25(3):14-19,25.
|
| [25] |
吴爱芝, 李国平, 孙铁山. 中国纺织服装产业的区位迁移[J]. 地理科学进展, 2013, 32(2):233-242.
|
| [26] |
吴继英, 赵喜仓. 偏离—份额分析法空间模型及其应用[J]. 统计研究, 2009, 26(4):73-79.
|
| [27] |
耿凤娟, 苗长虹, 胡志强. 黄河流域工业结构转型及其对空间集聚方式的响应[J]. 经济地理, 2020, 40(6):30-36.
|
| [28] |
赵瑞, 申玉铭. 黄河流域服务业高质量发展探析[J]. 经济地理, 2020, 40(6):21-29.
|
| [29] |
李丽萍, 左相国. 动态偏离—份额分析空间模型及湖北产业竞争力分析[J]. 经济问题, 2010(9):117-122.
|
/
| 〈 |
|
〉 |