
Spatial Differentiation and Optimization Strategy of Tourism Flows between China and ASEAN
Received date: 2019-11-23
Revised date: 2020-05-29
Online published: 2025-04-23
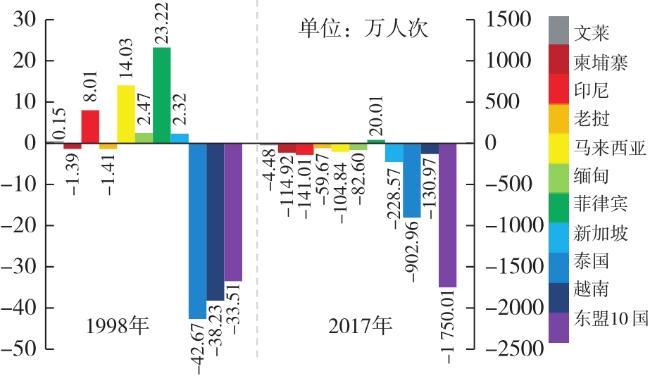
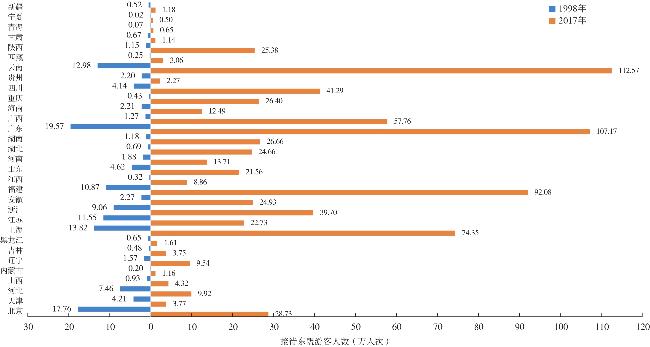
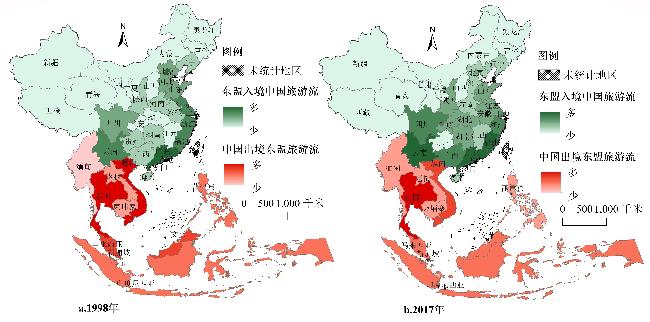
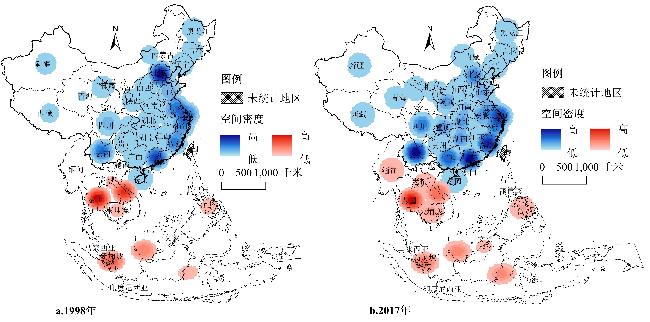
China and ASEAN countries have become important tourist destinations and sources for each other. Based on kernel density analysis,center of gravity model and standard deviation ellipse analysis,this paper reveals the spatial distribution pattern,spatial density characteristics and migration law of China-ASEAN inbound and outbound tourism flows. The research shows that: 1) The tourism deficit between China and ASEAN countries has widened sharply. 2) Taking the "Hu Huanyong line" as the boundary,the ASEAN visitors arrivals present a provincial distribution pattern of "strong southeast and weak northwest",while the outbound visitors from China to ASEAN are mainly concentrated in the countries along the gulf of Thailand,showing a "C" pattern with "more north and less south". 3) The high-density area of ASEAN visitors arrivals is gradually shifting from "Yangtze river delta","Beijing-Tianjin-Hebei" to "Guangdong,Yunnan and Guangxi". The high-density area of outbound visitors from China to ASEAN are centered in Thailand and clustered in the five Mekong countries. 4) The gravity center of ASEAN visitors arrivals shows two Characteristics: Gathering in the junction of Hubei and Jiangxi and migration from northeast to southwest. The gravity center of outbound visitors from China to ASEAN shows two migration tracks: "northwest → southeast" and "southeast → northwest". The main stream of ASEAN visitor arrivals is gradually moving south,showing polarization of "East China→ Southwest China". The main countries of outbound visitors from China to ASEAN are located in countries along the gulf of Thailand and gradually moving northward,showing the polarization of "Thailand-Malaysia".
CHENG Cheng , ZHOU Zeqi , LU Jianqi . Spatial Differentiation and Optimization Strategy of Tourism Flows between China and ASEAN[J]. Economic geography, 2020 , 40(9) : 204 -212 . DOI: 10.15957/j.cnki.jjdl.2020.09.022
表1 1998和2017年中国—东盟出入境旅游比Tab.1 The ratio of inbound and outbound visitors between China and ASEAN in 1998&2017 |
| 国家 | 东盟入境中国旅游流(人次) | 中国出境东盟旅游流(人次) | 出入境旅游比(%) | |||||
|---|---|---|---|---|---|---|---|---|
| 1998 | 2017 | 1998 | 2017 | 1998 | 2017 | |||
| 文莱 | 2 196 | 7 604 | 707 | 52 391 | 32.19 | 6 88.99 | ||
| 柬埔寨 | 4 136 | 61 625 | 18 035 | 1 210 782 | 436.05 | 1 964.76 | ||
| 印尼 | 104 602 | 683 059 | 24 535 | 2 093 171 | 23.46 | 306.44 | ||
| 老挝 | 1 695 | 42 514 | 15 802 | 639 185 | 932.27 | 1 503.47 | ||
| 马来西亚 | 300 119 | 1 233 237 | 159 852 | 2 281 666 | 53.26 | 185.01 | ||
| 缅甸 | 33 263 | 170 927 | 8 561 | 996 916 | 25.74 | 583.24 | ||
| 菲律宾 | 256 498 | 1 168 512 | 24 252 | 968 447 | 9.46 | 82.88 | ||
| 新加坡 | 316 434 | 941 210 | 293 282 | 3 226 934 | 92.68 | 342.85 | ||
| 泰国 | 144 332 | 776 692 | 571 061 | 9 806 260 | 395.66 | 1 262.57 | ||
| 越南 | 38 493 | 2 698 552 | 420 743 | 4 008 253 | 1 093.04 | 148.53 | ||
| 东盟10国 | 1 201 768 | 7 783 932 | 1 536 830 | 25 284 005 | 127.88 | 324.82 | ||
注:“出入境旅游比”是中国出境东盟(国别)游客人数与东盟(国别)入境中国游客人数的比值,大于1且数值越大表示逆差程度越大。 |
表2 1998—2017年中国—东盟旅游流的变异系数Tab.2 The CV of inbound and outbound visitors between China and ASEAN in 1998-2017 |
| 国家 | 东盟入境中国旅游流 | 中国出境东盟旅游流 | |||||
|---|---|---|---|---|---|---|---|
| 变异系数(%) | 平均值(万人次) | 标准差 | 变异系数(%) | 平均值(万人次) | 标准差 | ||
| 文莱 | 40.77 | 0.63 | 0.26 | 73.41 | 2.11 | 1.55 | |
| 柬埔寨 | 73.03 | 2.20 | 1.60 | 122.02 | 26.27 | 32.05 | |
| 印尼 | 41.52 | 43.05 | 17.13 | 121.44 | 47.34 | 57.49 | |
| 老挝 | 83.11 | 1.31 | 1.09 | 112.34 | 17.18 | 19.30 | |
| 马来西亚 | 36.77 | 89.27 | 32.82 | 66.25 | 97.80 | 64.79 | |
| 缅甸 | 91.16 | 18.39 | 16.76 | 159.59 | 21.26 | 33.93 | |
| 菲律宾 | 37.37 | 72.67 | 27.16 | 108.63 | 22.67 | 24.62 | |
| 新加坡 | 33.75 | 75.35 | 25.43 | 63.69 | 128.56 | 81.88 | |
| 泰国 | 35.62 | 51.15 | 18.22 | 114.43 | 254.52 | 291.26 | |
| 越南 | 96.73 | 84.59 | 81.83 | 75.98 | 117.45 | 89.24 | |
| 东盟10国 | 45.76 | 438.61 | 200.61 | 92.08 | 735.16 | 676.96 | |
图3 1998和2017年中国—东盟旅游流空间分布Fig.3 The distribution of inbound and outbound visitors between China and ASEAN in 1998&2017 |
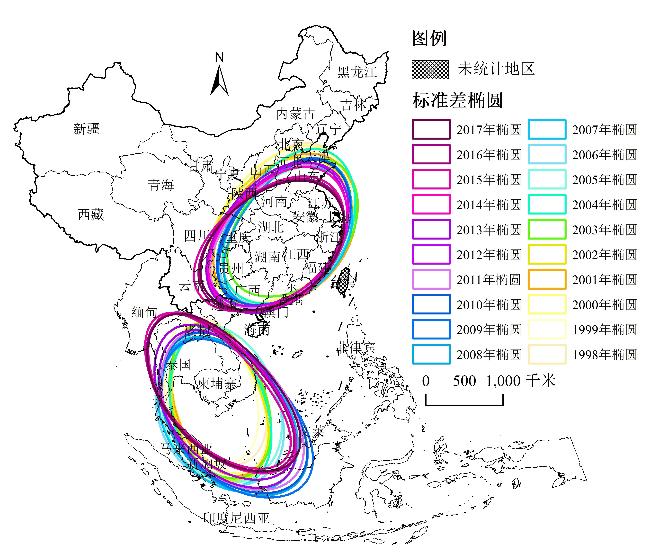
图4 1998和2017年中国—东盟出入境旅游流空间密度Fig.4 The spatial density of inbound and outbound visitors between China and ASEAN in 1998&2017 |
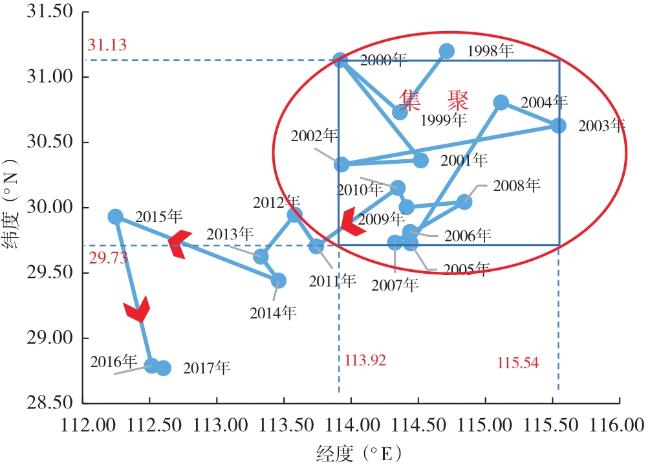
图5 1998—2017年东盟入境中国旅游流重心轨迹Fig.5 The gravity center of ASEAN visitor arrivals in 1998-2017 |
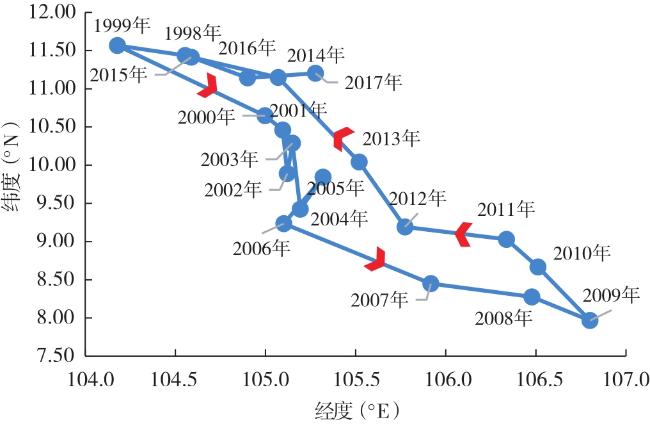
图6 1998—2017年中国出境东盟旅游流重心轨迹Fig.6 The gravity center of outbound visitors from China to ASEAN in 1998-2017 |
表4 1998和2017年中国出境泰国湾沿岸国家游客人数Tab.4 The outbound visitors from China to countries along the Gulf of Thailand 1998&2017 |
| 国家 | 1998 | 2017 | ||||
|---|---|---|---|---|---|---|
| 人数(人次) | 占比(%) | 人数(人次) | 占比(%) | |||
| 东盟10国 | 1 536 830 | 100.00 | 25 284 005 | 100.00 | ||
| 泰 国 湾 沿 岸 国 家 | 1 462 973 | 95.19 | 20 533 895 | 81.21 | ||
| 泰国 | 571 061 | 37.16 | 9 806 260 | 38.78 | ||
| 越南 | 420 743 | 27.38 | 4 008 253 | 15.85 | ||
| 新加坡 | 293 282 | 19.08 | 3 226 934 | 12.76 | ||
| 马来西亚 | 159 852 | 10.40 | 2 281 666 | 9.02 | ||
| 柬埔寨 | 18 035 | 1.17 | 1 210 782 | 4.79 | ||
来源:东盟秘书处ASEANStats数据库。 |
表5 1998和2017年中国各地区接待东盟游客人数Tab.5 The ASEAN visitors arrivals by region in 1998&2017 |
| 地区 | 1998 | 2017 | ||||
|---|---|---|---|---|---|---|
| 人数(人次) | 占比(%) | 人数(人次) | 占比(%) | |||
| 东部沿海 | 1 011 138 | 74.91 | 4 124 884 | 51.31 | ||
| 北京 | 177 552 | 13.15 | 287 285 | 3.57 | ||
| 天津 | 42 063 | 3.12 | 37 682 | 0.47 | ||
| 河北 | 74 583 | 5.53 | 99 168 | 1.23 | ||
| 山东 | 46 158 | 3.42 | 215 589 | 2.68 | ||
| 江苏 | 115 486 | 8.56 | 227 266 | 2.83 | ||
| 浙江 | 90 636 | 6.72 | 396 985 | 4.94 | ||
| 上海 | 138 163 | 10.24 | 743 535 | 9.25 | ||
| 福建 | 108 711 | 8.05 | 920 822 | 11.45 | ||
| 广东 | 195 698 | 14.50 | 1 071 692 | 13.33 | ||
| 海南 | 22 088 | 1.64 | 124 860 | 1.55 | ||
| 长三角 | 366 986 | 27.19 | 1 617 076 | 20.12 | ||
| 上海 | 115 486 | 8.56 | 227 266 | 2.83 | ||
| 江苏 | 90 636 | 6.72 | 396 985 | 4.94 | ||
| 浙江 | 138 163 | 10.24 | 743 535 | 9.25 | ||
| 安徽 | 22 701 | 1.68 | 249 290 | 3.10 | ||
| 京津冀 | 294 198 | 21.80 | 424 135 | 5.28 | ||
| 北京 | 177 552 | 13.15 | 287 285 | 3.57 | ||
| 天津 | 42 063 | 3.12 | 37 682 | 0.47 | ||
| 河北 | 74 583 | 5.53 | 99 168 | 1.23 | ||
| 粤滇桂 | 338 207 | 25.06 | 2 774 943 | 34.52 | ||
| 广东 | 195 698 | 14.50 | 1 071 692 | 13.33 | ||
| 广西 | 12 720 | 0.94 | 577 599 | 7.19 | ||
| 云南 | 129 789 | 9.62 | 1 125 652 | 14.00 | ||
注:数据来源于1999—2018年《中国旅游统计年鉴》。 |
表6 1998和2017年中国出境湄公河五国游客人数Tab.6 The outbound visitors from China to 5 Mekong countries in 1998&2017 |
| 国家 | 1998 | 2017 | ||||
|---|---|---|---|---|---|---|
| 人数(人次) | 占比(%) | 人数(人次) | 占比(%) | |||
| 东盟10国 | 1 536 830 | 100.00 | 25 284 005 | 100.00 | ||
| 湄 公 河 五 国 | 1 034 202 | 67.29 | 16 661 396 | 65.89 | ||
| 缅甸 | 8 561 | 0.56 | 996 916 | 3.94 | ||
| 柬埔寨 | 18 035 | 1.17 | 1 210 782 | 4.79 | ||
| 老挝 | 15 802 | 1.03 | 639 185 | 2.53 | ||
| 泰国 | 571 061 | 37.16 | 9 806 260 | 38.78 | ||
| 越南 | 420 743 | 27.38 | 4 008 253 | 15.85 | ||
来源:东盟秘书处ASEANStats数据库。 |
| [1] |
薛华菊, 马耀峰, 黄毅. 基于ESDA-GIS中国入境旅游流质时空演进模式及影响因素研究[J]. 资源科学, 2014, 36(9):1 860-1 869.
|
| [2] |
李中建, 孙根年. 中美英德法出境旅游国际影响力比较——基于经济视角的时空分析[J]. 资源科学, 2019, 41(5):919-930.
|
| [3] |
李中建, 孙根年. 中国出境旅游国际影响力的时空测度——基于市场占比和增长贡献度的分析[J]. 陕西师范大学学报:自然科学版, 2019, 47(4):59-66.
|
| [4] |
|
| [5] |
王兆峰, 赵松松. 基于DEA-Malmquist模型的湖南省旅游产业效率时空动态演化及影响因素[J]. 长江流域资源与环境, 2019(8): 1 886-1 897.
|
| [6] |
申鹏鹏, 周年兴, 张允翔, 等. 基于DEA-Malmquist指数二次分解模型的江苏省旅游产业效率时空演变及影响因素[J]. 长江流域资源与环境, 2018, 27(1):53-62.
|
| [7] |
|
| [8] |
刘佳, 陆菊, 刘宁. 基于DEA-Malmquist模型的中国沿海地区旅游产业效率时空演化、影响因素与形成机理[J]. 资源科学, 2015, 37(12):2 381-2 393.
|
| [9] |
刘建国, 刘宇. 2006—2013年杭州城市旅游全要素生产率格局及影响因素[J]. 经济地理, 2015, 35(7):190-197.
|
| [10] |
方叶林, 黄震方, 李东, 等. 中国省域旅游业发展效率测度及其时空演化[J]. 经济地理, 2015, 35(8):189-195.
|
| [11] |
王佳果, 吴忠军, 曹宏丽. “一带一路”背景下民族地区入境旅游时空特征[J]. 经济地理, 2017, 37(7):208-215.
|
| [12] |
温晓金, 蒋依依, 刘焱序. “一带一路”国家入境游客规模演化规律与中国出境游客的对应特征[J]. 资源科学, 2019, 41(5):931-942.
|
| [13] |
李龙, 杨效忠, 鄢方卫. 中国入境旅游目的地时空地域格局分异研究[J]. 资源开发与市场, 2019, 35(1):112-116.
|
| [14] |
郭鹏, 董锁成, 李泽红, 等. 丝绸之路经济带旅游业格局与国际旅游合作模式研究[J]. 资源科学, 2014, 36(12):2 459-2 467.
|
| [15] |
姚梦汝, 陈焱明, 周桢津, 等. 中国—东盟旅游流网络结构特征与重心轨迹演变[J]. 经济地理, 2018, 38(7):181-189.
|
| [16] |
|
| [17] |
陈秀琼, 黄福才. 中国入境旅游的区域差异特征分析[J]. 地理学报, 2006(12): 1 271-1 280.
|
| [18] |
王富强. 中国赴东盟旅游流重心轨迹演变研究[D]. 南宁: 广西大学, 2016.
|
| [19] |
包富华, 陈瑛. 我国东部地区外企投资与入境商务旅游重心格局演变对比研究[J]. 商业研究, 2015(11):186-192.
|
| [20] |
赵安周, 白凯, 卫海燕. 中国入境旅游重心演变与省域空间分异规律[J]. 陕西师范大学学报:自然科学版, 2011, 39(4):97-102
|
| [21] |
侯志强. 交通基础设施对区域旅游经济增长效应的实证分析——基于中国省域面板数据的空间计量模型[J]. 宏观经济研究, 2018(6):118-132.
|
| [22] |
邓祖涛, 尹贻梅. 我国旅游资源、区位和入境旅游收入的空间错位分析[J]. 旅游科学, 2009, 23(3):6-10.
|
| [23] |
包富华, 陈瑛. 中国大陆外商直接投资与入境商务旅游的空间错位研究[J]. 浙江大学学报:理学版, 2016, 43(4):465-475.
|
| [24] |
陈乔, 程成, 田芮凡. 东盟旅桂“客流量—景区—酒店”空间错位及演变[J]. 经济地理, 2017, 37(9):192-199.
|
| [25] |
|
/
| 〈 |
|
〉 |