
Land Use Transition in Northeast China:Features Measurement and Mechanism Exploration
Received date: 2019-07-27
Revised date: 2020-04-16
Online published: 2025-04-23
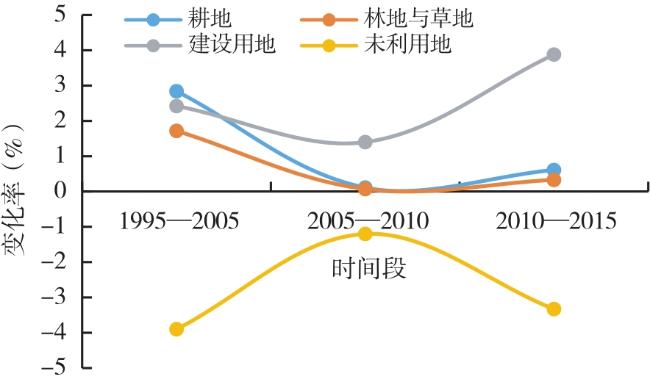
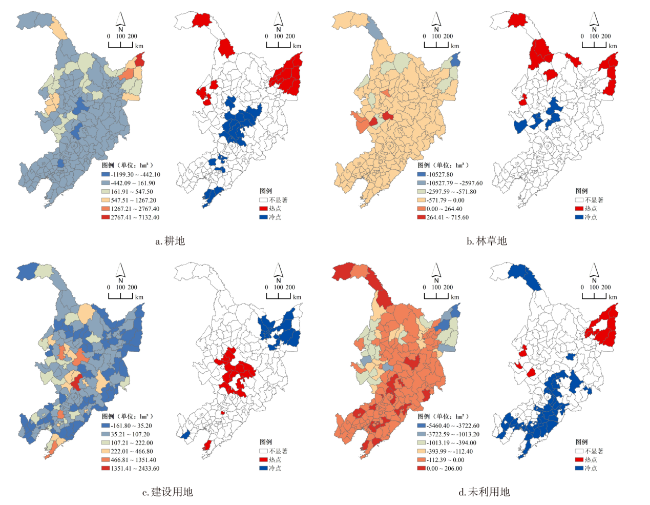
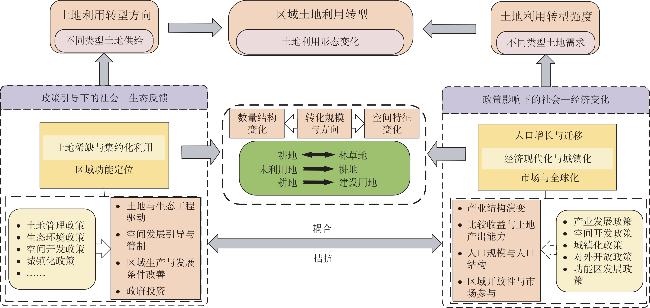
This paper measured the characteristics of land use transition in Northeast China from 1995 to 2015 based on land use transfer matrix and spatial exploratory analysis method,and further uses spatial econometric model to analyze the influencing factors and dynamic mechanism of land use transition in Northeast China. The results showed that: 1) The characteristics of land use transition in Northeast China can be described in terms of quantity change and spatial change. From 2005 to 2010,the change speed of main land use types in Northeast China slowed down,the scale of cropland and construction land continued to expand,but the scale of forest and grass land,as well as unused land continued to decline. Spatially,the hotspot of cropland area growth,as well as forest and grassland decrease converge to the Sanjiang Plain. The forest and grassland in the Greater Khingan Mountains and Lesser Khingan Mountains changed from decrease to increase. There was a transfer path of "Megalopolis-urban belt and coastal area-Ha-Chang Urban Agglomerations" in the hotspot of construction land growth,which showed a change process of "agglomeration-dispersion-agglomeration" in space. The decrease of unused land mainly also occurs in Sanjiang Plain,and the scope of hotspot gradually expanding. 2) The results of qualitative and quantitative analysis showed that based on the regional natural conditions,various policy factors can directly control different types of land supply through land/ecological engineering construction,government investment,spatial development regulation,preferential policy support and other forms,forming the path of socio-ecological feedback under the guidance of policies. In addition,the policy factors can also influence the regional land use demand by promoting the change of industrial structure,changing the comparative income and output capacity,controlling the population scale and population structure,forming the path of socio-economic change under the influence of policies. The two paths interact together to drive the process of land use transition in Northeast China. (3) At present,the problem of unsustainable use of land resources in Northeast China is becoming increasingly prominent due to various policy conflicts and unreasonable policy design. The government should further strengthen the comprehensive coordination among various policies based on the perspective of spatial governances,and guide the regional land resources development to the sustainable direction with scientific policy design.
TIAN Junfeng , WANG Binyan , WANG Shijun . Land Use Transition in Northeast China:Features Measurement and Mechanism Exploration[J]. Economic geography, 2020 , 40(9) : 184 -195 . DOI: 10.15957/j.cnki.jjdl.2020.09.020
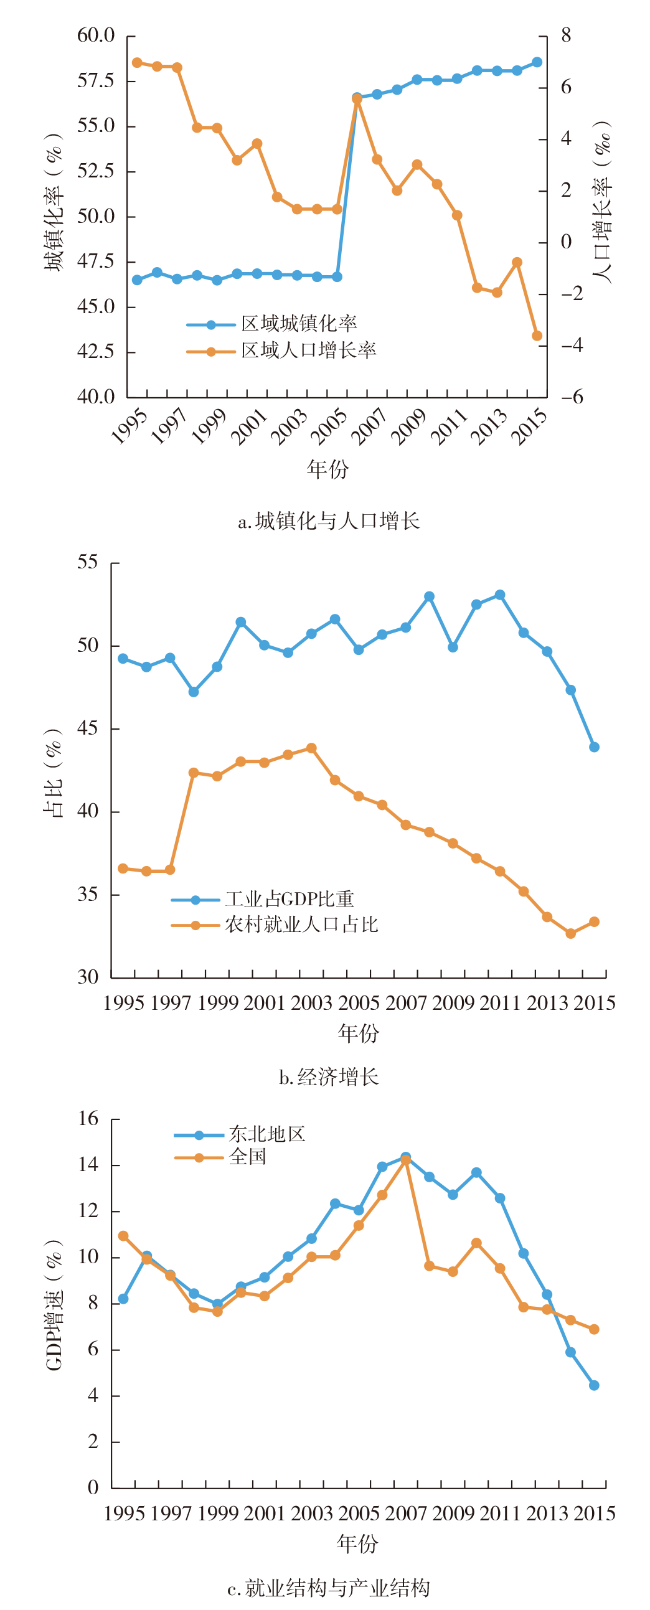
图1 东北地区1995—2015年主要经济社会指标变化Fig.1 Changes of major socio-economic indicators in Northeast China from 1995 to 2015 |
表1 1995—2015年东北地区经济社会发展阶段Tab.1 Socio-economic development stage of Northeast China from 1995 to 2015 |
| 时间 | 阶段 | 特征 |
|---|---|---|
| 1995—2005 | 经济缓慢增长,城镇化与人口发展停滞期 | 区域经济增速低于全国平均水平;农业就业人口在全部就业人口中占据主导地位,所占比重持续上升;区域人口增长缓慢,城镇化进程趋于停滞 |
| 2005—2010 | 经济高速增长,人口转型期 | 区域经济高速增长,增速高于全国平均水平;农业就业人口在全部就业人口中占比下降;农村人口数量由增长转为下降 |
| 2010—2015 | 经济与人口衰退期 | 经济增速“断崖式”下滑;工业在国民经济中主导地位削弱;区域人口总量由增长转为下降 |
表2 1995—2015年东北地区主要土地利用类型数量变化Tab.2 Quantity change of major land use types in Northeast China from 1995 to 2015 |
| 土地利用类型 | 面积(104hm2) | 变化量(104hm2) | ||||||
|---|---|---|---|---|---|---|---|---|
| 1995 | 2005 | 2010 | 2015 | 1995—2005 | 2005—2010 | 2010—2015 | ||
| 耕地 | 2 934.05 | 3 017.36 | 3 020.58 | 3 038.89 | 83.31 | 3.22 | 18.31 | |
| 林草地 | 4 047.00 | 3 977.22 | 3 974.08 | 3 960.91 | -69.78 | -3.14 | -13.17 | |
| 建设用地 | 236.04 | 241.76 | 245.20 | 254.71 | 5.71 | 3.44 | 9.51 | |
| 未利用地 | 426.60 | 409.95 | 405.03 | 391.53 | -16.64 | -4.92 | -13.50 | |
表3 东北地区不同时期土地利用转移矩阵Tab.3 Land use transfer matrix in different periods of Northeast China |
| 阶段 | 年份 | 耕地(104hm2) | 林草地(104hm2) | 建设用地(104hm2) | 未利用地(104hm2) | |
|---|---|---|---|---|---|---|
| 2005 | ||||||
| 1995—2005 | 耕地 | 1995 | 2 893.01 | 27.00 | 5.67 | 5.40 |
| 林草地 | 92.32 | 3 940.85 | 1.12 | 10.80 | ||
| 建设用地 | 1.16 | 0.14 | 234.68 | 0.03 | ||
| 未利用地 | 26.94 | 7.84 | 0.12 | 389.26 | ||
| 2010 | ||||||
| 2005—2010 | 耕地 | 2005年 | 3 004.37 | 7.15 | 3.61 | 0.44 |
| 林草地 | 10.26 | 3 965.63 | 0.63 | 0.31 | ||
| 建设用地 | 0.79 | 1.19 | 240.80 | 0.01 | ||
| 未利用地 | 4.71 | 0.82 | 0.09 | 404.15 | ||
| 2015 | ||||||
| 2010—2015 | 耕地 | 2010年 | 3 011.30 | 1.08 | 7.79 | 0.06 |
| 林草地 | 14.37 | 3 958.07 | 1.67 | 0.09 | ||
| 建设用地 | 0.72 | 0.01 | 244.45 | 0.15 | ||
| 未利用地 | 11.02 | 1.69 | 0.60 | 391.22 | ||
表4 不同时期主要土地转化类型全局Moran's I值Tab.4 Global Moran's I test for major land use conversion types in different periods |
| 耕地—林草地 | 耕地—建设用地 | 林草地—耕地 | 未利用地—耕地 | ||||||||
|---|---|---|---|---|---|---|---|---|---|---|---|
| Moran's I | P | Moran's I | P | Moran's I | P | Moran's I | P | ||||
| 1995—2005 | 0.1321 | 0.0080*** | 0.0593 | 0.0860* | 0.2860 | 0.0010*** | 0.2893 | 0.0010*** | |||
| 2005—2010 | 0.3185 | 0.0010*** | 0.0448 | 0.0910* | 0.3093 | 0.0020*** | 0.3384 | 0.0030*** | |||
| 2010—2015 | - | - | 0.0875 | 0.0290** | 0.0995 | 0.0030*** | 0.2016 | 0.0030*** | |||
注:*、**、***分别表示在10%、5%、1%置信水平下显著。表5同。 |
表5 2010—2015年东北地区主要土地转化类型影响因素空间分析结果Tab.5 The estimation results of the spatial econometric model of main land conversion types in Northeast China in 2010-2015 |
| 变量 | 耕地—建设用地 | 林草地—耕地 | 未利用地—耕地 | |||||
|---|---|---|---|---|---|---|---|---|
| OLS | SEM | OLS | SLM | OLS | SEM | |||
| 基期建设用地面积 | 0.0192*** | 0.0190*** | ||||||
| 基期未利用地面积 | 0.0179*** | 0.0214*** | ||||||
| 河网密度 | 352.4900*** | 341.3800** | ||||||
| GDP | 0.0001*** | 0.0001*** | ||||||
| 财政收入 | 0.0013*** | 0.0013*** | ||||||
| 第二产业占GDP比重 | -8.9975*** | -8.7966*** | ||||||
| 总人口 | 0.0051*** | 0.0050*** | ||||||
| 城镇人口 | 0.0031*** | 0.0052*** | ||||||
| 农村居民人均纯收入 | -1.0529*** | -1.0430*** | -0.2099** | -0.2028** | ||||
| 农业机械总动力 | 49.6337*** | 46.7885*** | 44.6260*** | 39.5848*** | ||||
| W-Y | -2.8582*** | |||||||
| LAMBDA | 2.4406** | 2.2456*** | ||||||
| R2 | 0.9096 | 0.9162 | 0.2806 | 0.3358 | 0.2835 | 0.3228 | ||
| logL | -1 282.23 | -1 279.30 | -1 703.60 | -1 700.35 | -1 620.99 | -1 618.51 | ||
| AIC | 2 580.46 | 2 576.61 | 3 415.19 | 3 410.69 | 3 249.99 | 3 245.02 | ||
| SC | 2 605.91 | 2 605.25 | 3 427.92 | 3 422.60 | 3 262.72 | 3 257.75 | ||
| [1] |
龙花楼. 论土地利用转型与土地资源管理[J]. 地理研究, 2015, 34(9):1 607-1 618.
|
| [2] |
李全峰, 胡守庚, 瞿诗进. 1990—2015年长江中游地区耕地利用转型时空特征[J]. 地理研究, 2017, 36(8):1 489-1 502.
|
| [3] |
|
| [4] |
宋小青, 李心怡. 区域耕地利用功能转型的理论解释与实证[J]. 地理学报, 2019, 74(5):992-1 010.
|
| [5] |
龙花楼, 李婷婷. 中国耕地和农村宅基地利用转型耦合分析[J]. 地理学报, 2012, 67(2):201-210.
|
| [6] |
|
| [7] |
瞿诗进, 胡守庚, 童陆亿, 等. 长江中游经济带城镇建设用地转型的时空特征[J]. 资源科学, 2017, 39(2):240-251.
|
| [8] |
|
| [9] |
史洋洋, 吕晓, 黄贤金, 等. 江苏沿海地区耕地利用转型及其生态系统服务价值变化响应[J]. 自然资源学报, 2017, 32(6):961-976.
|
| [10] |
杨清可, 段学军, 王磊, 等. 基于“三生空间”的土地利用转型与生态环境效应——以长江三角洲核心区为例[J]. 地理科学, 2018, 38(1):97-106.
|
| [11] |
刘永强, 龙花楼, 李加林. 长江中游经济带土地利用转型及其生态服务功能交叉敏感性研究[J]. 地理研究, 2018, 37(5):1 009-1 022.
|
| [12] |
陈龙, 周生路, 周兵兵, 等. 基于主导功能的江苏省土地利用转型特征与驱动力[J]. 经济地理, 2015, 35(2):155-162.
|
| [13] |
刘永强, 龙花楼. 黄淮海平原农区土地利用转型及其动力机制[J]. 地理学报, 2016, 71(4):666-679.
|
| [14] |
曲衍波, 姜广辉, 张佰林, 等. 山东省农村居民点转型的空间特征及其经济梯度分异[J]. 地理学报, 2017, 72(10):1 845-1 858.
|
| [15] |
赵儒煜, 王媛玉. 论“东北现象” 的成因及对策[J]. 南开学报:哲学社会科学版, 2017(6):56-64.
|
| [16] |
武鹏, 李同昇, 李卫民. 县域农村贫困化空间分异及其影响因素——以陕西山阳县为例[J]. 地理研究, 2018, 37(3):593-606.
|
| [17] |
张松林, 张昆. 局部空间自相关指标对比研究[J]. 统计研究, 2007(7):65-67.
|
| [18] |
|
| [19] |
|
| [20] |
|
| [21] |
马恩朴, 蔡建明, 林静, 等. 远程耦合视角下的土地利用/覆被变化解释[J]. 地理学报, 2019, 74(3):421-431.
|
| [22] |
|
| [23] |
|
| [24] |
王士君, 宋飏. 中国东北地区城市地理基本框架[J]. 地理学报, 2006, 61(6):574-584.
|
| [25] |
张国平, 刘纪远, 张增祥. 基于遥感和GIS的中国20世纪90年代毁林开荒状况分析[J]. 地理研究, 2003, 22(2):221-226,261-262.
|
| [26] |
宋艳, 李勇. 老工业基地振兴背景下东北地区城镇化动力机制及策略[J]. 经济地理, 2014, 34(1):47-53.
|
| [27] |
|
| [28] |
张迪, 张凤荣, 安萍莉, 等. 中国现阶段后备耕地资源经济供给能力分析[J]. 资源科学, 2004, 26(5):46-52.
|
| [29] |
郎宇. 东北地区农产品国际竞争力研究[D]. 长春: 东北师范大学, 2006:30,35.
|
| [30] |
罗冲, 姜博, 张文琦, 等. 东北地区耕地利用效率时空差异及其影响因素分析[J]. 中国农业资源与区划, 2017, 38(10):38-44.
|
| [31] |
|
| [32] |
任林静, 黎洁. 退耕还林政策交替期退耕农户土地利用意愿研究——基于制度约束的影响分析[J]. 干旱区资源与环境, 2018, 32(8):52-58.
|
| [33] |
|
| [34] |
许欣. 东北振兴战略演进轨迹及其未来展望[J]. 改革, 2017(12):15-24.
|
| [35] |
王姣娥, 杜德林. 东北振兴以来地区经济发展水平演化及空间分异模式[J]. 地理科学, 2016, 36(9):1 320-1 328.
|
| [36] |
王士君, 田俊峰, 王彬燕, 等. 精准扶贫视角下中国东北农村贫困地域性特征及成因[J]. 地理科学, 2017, 37(10):1 449-1 458.
|
/
| 〈 |
|
〉 |