
Environmental Efficiency Evaluation of Hog Scale Production in Superior Districts of China:Based on Non-Radical and Non-Oriented SE-SBM Model
Received date: 2019-05-04
Revised date: 2020-05-21
Online published: 2025-04-23
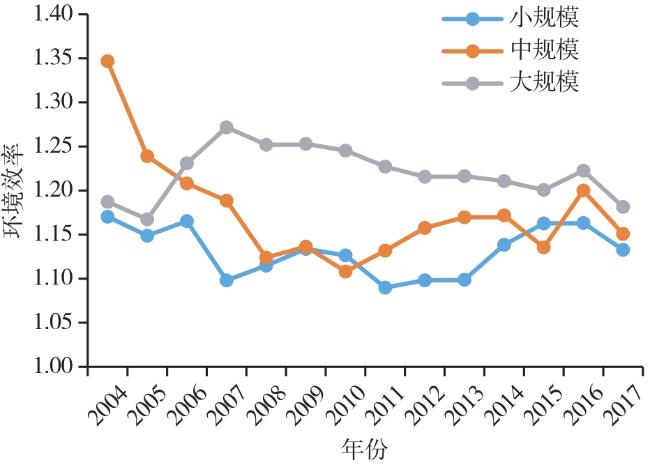
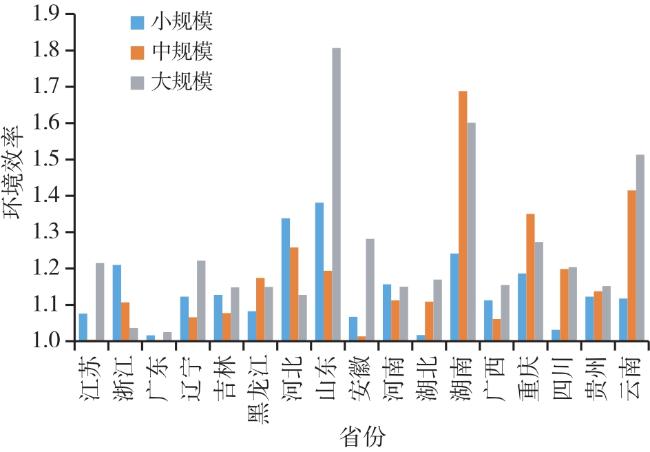
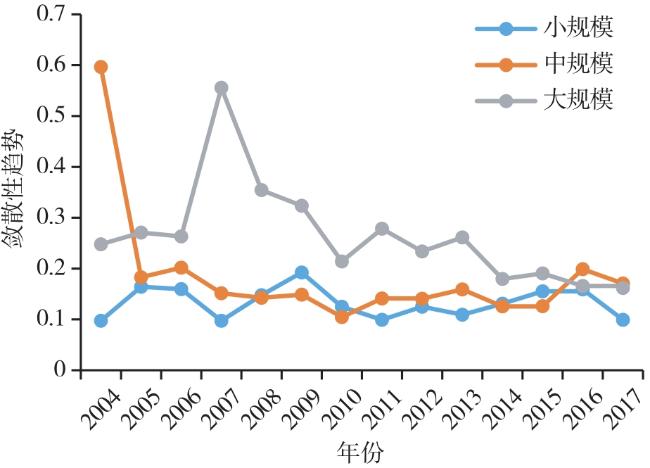
Evaluating and contrastively analyzing the environmental efficiency of hog scale cultivation is of great significance to its green development and industry distribution optimization.This paper takes the pollution factors(COD,TN,TP) as undesirable output and constructs evaluation indication system on environmental efficiency of hog scale production, it evaluates the environmental efficiency of different scale production of 17 main pig-breeding provinces at the regional and provincial-level in China from 2004 to 2014 applying non-radical and non-oriented SE-SBM model and discusses its improvement directions.The result reveals that:1)It exists obvious regional difference on the environmental efficiency of hog scale production which is higher in the middle and southwest China than the northeast and coastal;2)It exists obvious scale difference on the environmental efficiency of hog scale production,the larger the scale, the higher efficiency, namely the environmental efficiency is proportional to the production scale;3)The result of σ convergence test reveals that: the environmental efficiency at the different scale presents convergent tendency, it presents σ consistency at the large scale, while it presents divergence to some extent at the middle and small scale;4)The overall environmental efficiency has not reached the optimal level, improving the resource utilization ration and reducing resource consumption and pollutant discharge are the key measures to improve the environmental efficiency.
DU Hongmei , WANG Mingchun . Environmental Efficiency Evaluation of Hog Scale Production in Superior Districts of China:Based on Non-Radical and Non-Oriented SE-SBM Model[J]. Economic geography, 2020 , 40(9) : 176 -183 . DOI: 10.15957/j.cnki.jjdl.2020.09.019
表1 我国17个生猪生产优势省份的区域划分Tab.1 Regional division of 17 advantageous pig producing provinces in China |
| 优势产区 | 包含省份 |
|---|---|
| 东北 | 辽宁、吉林、黑龙江 |
| 沿海 | 江苏、浙江、广东 |
| 中部 | 河北、山东、安徽、河南、湖北、湖南 |
| 西南 | 广西、重庆、四川、贵州、云南 |
表2 生猪养殖规模界定的对照Tab.2 Comparison of the definition of pig breeding scale |
| 《资料汇编》 | 《排污系数手册》 | |||
|---|---|---|---|---|
| 养殖模式 | 年出栏(头) | 养殖模式 | 养殖规模(头) | |
| 农户散养 | <30 | - | - | |
| 小规模 | 30~100 | 养殖专业户 | ≥50 | |
| 中规模 | 100~1 000 | 规模化养殖场 | ≥500 | |
| 大规模 | >1 000 | 养殖小区 | 无具体定义 | |
表3 各省的干清粪及水冲粪比例Tab.3 Provincial dry nightsoil and water manure proportion |
| 地区 | 干清粪(%) | 水冲粪(%) | 地区 | 干清粪(%) | 水冲粪(%) |
|---|---|---|---|---|---|
| 黑龙江 | 77.36 | 22.13 | 安徽 | 62.12 | 36.46 |
| 吉林 | 78.02 | 21.06 | 山东 | 66.22 | 32.13 |
| 辽宁 | 80.46 | 18.58 | 广西 | 54.02 | 44.87 |
| 河南 | 64.54 | 35.11 | 广东 | 50.10 | 48.22 |
| 河北 | 65.03 | 33.89 | 浙江 | 48.76 | 49.03 |
| 重庆 | 52.44 | 45.68 | 江苏 | 49.88 | 47.98 |
| 四川 | 56.28 | 43.02 | 云南 | 51.89 | 47.23 |
| 湖南 | 55.01 | 43.50 | 贵州 | 54.22 | 45.12 |
| 湖北 | 53.88 | 44.78 |
注:各省干清粪、水冲粪所占比例加和大多不为100%,主要是因为除此两种方式外还有生物发酵床或野外放养的方式。 |
表4 17个生猪主产省环境效率排名及动态变化(2004—2017)Tab.4 The specific environment efficiency ranking 17 pigs and dynamic change (2004-2017) |
| 省份 | 小规模 | 中规模 | 大规模 | ||||||||||||
|---|---|---|---|---|---|---|---|---|---|---|---|---|---|---|---|
| 2004 | 2017 | 幅度 | 均值 | 2004 | 2017 | 幅度 | 均值 | 2004 | 2017 | 幅度 | 均值 | ||||
| 江苏 | 2 | 16 | (-14) | 13 | 2 | 16 | (-14) | 16 | 8 | 9 | (-1) | 7 | |||
| 浙江 | 7 | 11 | (-4) | 4 | 14 | 6 | (+8) | 11 | 13 | 17 | (-4) | 16 | |||
| 广东 | 16 | 17 | (-1) | 17 | 15 | 17 | (-2) | 17 | 17 | 15 | (+2) | 17 | |||
| 沿海平均 | (2) | (4) | (-2) | (4) | (2) | (4) | (-2) | (4) | (4) | (4) | (0) | (4) | |||
| 辽宁 | 12 | 12 | (0) | 9 | 7 | 13 | (-6) | 13 | 6 | 11 | (-5) | 6 | |||
| 吉林 | 10 | 8 | (+2) | 7 | 17 | 14 | (+3) | 12 | 10 | 14 | (-4) | 14 | |||
| 黑龙江 | 17 | 9 | (+8) | 12 | 16 | 7 | (+9) | 7 | 14 | 8 | (-6) | 13 | |||
| 东北平均 | (4) | (2) | (+2) | (3) | (4) | (3) | (+1) | (3) | (3) | (3) | (0) | (3) | |||
| 河北 | 1 | 4 | (-3) | 2 | 3 | 3 | (0) | 4 | 12 | 12 | (0) | 15 | |||
| 山东 | 5 | 3 | (+2) | 1 | 5 | 11 | (-6) | 6 | 4 | 1 | (+3) | 1 | |||
| 安徽 | 6 | 7 | (-1) | 14 | 10 | 10 | (0) | 15 | 5 | 2 | (+3) | 4 | |||
| 河南 | 8 | 2 | (+6) | 6 | 11 | 8 | (+3) | 9 | 15 | 7 | (+8) | 12 | |||
| 湖北 | 15 | 15 | (0) | 16 | 8 | 4 | (+4) | 10 | 16 | 3 | (+13) | 9 | |||
| 湖南 | 11 | 5 | (+6) | 3 | 1 | 2 | (-1) | 1 | 1 | 6 | (-5) | 2 | |||
| 中部平均 | (1) | (1) | (0) | (1) | (1) | (1) | (0) | (2) | (2) | (1) | (+1) | (1) | |||
| 广西 | 3 | 10 | (-7) | 11 | 12 | 15 | (-3) | 14 | 7 | 13 | (-6) | 10 | |||
| 重庆 | 4 | 1 | (+3) | 5 | 4 | 5 | (-1) | 3 | 11 | 5 | (+6) | 5 | |||
| 四川 | 14 | 13 | (+1) | 15 | 6 | 12 | (-6) | 5 | 2 | 16 | (-14) | 8 | |||
| 贵州 | 9 | 14 | (-5) | 8 | 13 | 9 | (+4) | 8 | 9 | 10 | (-1) | 11 | |||
| 云南 | 13 | 6 | (+7) | 10 | 9 | 1 | (+8) | 2 | 3 | 4 | (-1) | 3 | |||
| 西南平均 | (3) | (3) | (0) | (2) | (3) | (2) | (+1) | (1) | (1) | (2) | (-1) | (2) | |||
图3 2004—2017年三种规模的环境效率差异敛散性趋势Fig.3 Convergence trends of environmental efficiency differences of three scales from 2004 to 2017 |
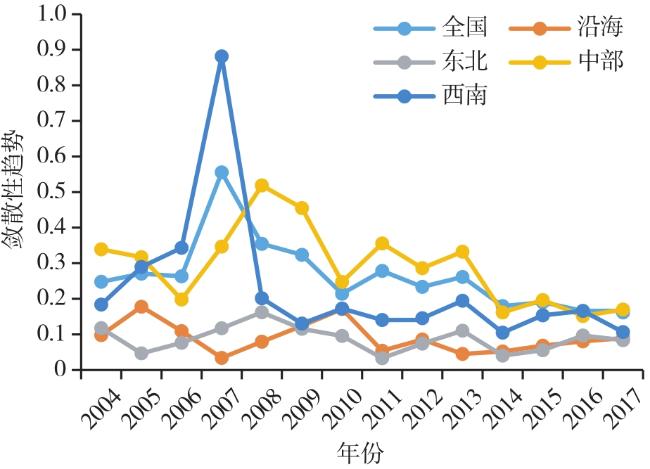
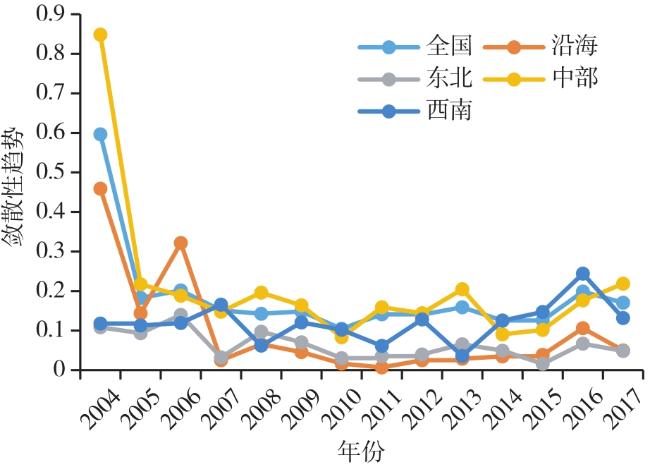
图4 2004—2017年大规模生猪养殖环境效率区域差异敛散性趋势Fig.4 Convergence trend of regional differences in environmental efficiency of large-scale pig breeding from 2004 to 2017 |
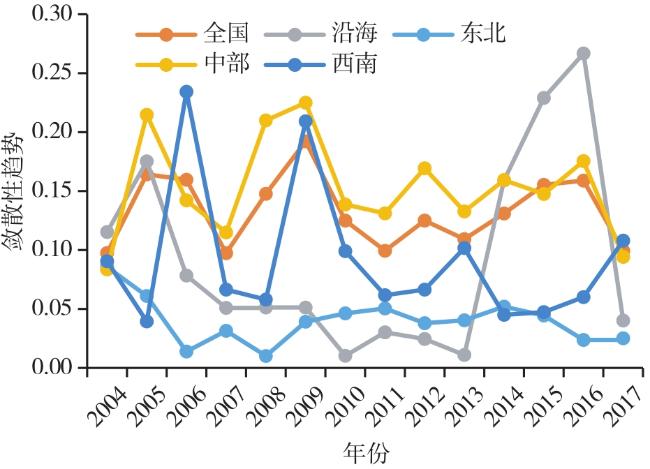
图5 2004—2017年中规模生猪养殖环境效率区域差异敛散性趋势Fig.5 Convergence trend of regional differences in environmental efficiency of medium-scale pig breeding from 2004 to 2017 |
表5 2004—2017年17省大规模养殖环境效率及其松弛变量结果 Tab.5 17 provinces’ large-scale aquaculture environmental efficiency and the slack variable results from 2004 to 2017 |
| DMU | 效率值 | 投入松弛变量 | 产出松弛变量 | ||||||||
|---|---|---|---|---|---|---|---|---|---|---|---|
| 用工数量 | 精饲料重量 | 仔猪重量 | 水及燃料动力费 | 医疗防疫费 | 化学需氧量 | 总氮排放量 | 总磷排放量 | 主产品净产量 | |||
| 江苏 | 1.215 | 0.399 | 16.911 | 4.904 | 0.607 | 2.222 | 425.670 | 0.122 | 0.286 | 0.286 | |
| 浙江 | 1.037 | 0.027 | 1.922 | 0.258 | 0.069 | 1.462 | 0.959 | 0.340 | 0.066 | 0 | |
| 广东 | 1.025 | 0.046 | 4.305 | 0.877 | 0 | 0 | 0.964 | 0.870 | 0.124 | 0 | |
| 辽宁 | 1.221 | 0.816 | 0.807 | 3.291 | 0.502 | 1.982 | 327.110 | 0.984 | 0 | 0 | |
| 吉林 | 1.148 | 0.857 | 4.426 | 0.426 | 0.808 | 1.254 | 188.370 | 0.273 | 0.057 | 0 | |
| 黑龙江 | 1.149 | 0.071 | 0.915 | 4.454 | 0.095 | 2.237 | 41.955 | 51.696 | 0 | 0 | |
| 河北 | 1.128 | 0.080 | 15.478 | 5.203 | 0.371 | 0.241 | 0.974 | 0.473 | 0.120 | 0 | |
| 山东 | 1.806 | 1.033 | 0.854 | 1.000 | 4.258 | 0.716 | 1 166.900 | 169.340 | 0 | 0.657 | |
| 安徽 | 1.282 | 0.932 | 4.131 | 1.840 | 0.938 | 0.929 | 113.040 | 0.052 | 0.065 | 0 | |
| 河南 | 1.150 | 0.643 | 6.785 | 4.202 | 0.643 | 0.910 | 0.349 | 0.965 | 0.643 | 0 | |
| 湖北 | 1.170 | 0.483 | 3.083 | 0.827 | 0.119 | 0.153 | 0.828 | 0.822 | 0.051 | 0 | |
| 湖南 | 1.601 | 1.354 | 6.957 | 3.525 | 2.238 | 0.454 | 211.460 | 60.808 | 0.356 | 0 | |
| 广西 | 1.154 | 0.164 | 29.463 | 2.353 | 0.356 | 1.942 | 0.658 | 1.072 | 1.237 | 0 | |
| 重庆 | 1.273 | 0.082 | 27.019 | 1.322 | 0.556 | 1.586 | 0.998 | 0.622 | 0.121 | 0 | |
| 四川 | 1.204 | 0.232 | 5.045 | 0.660 | 0.675 | 2.904 | 0.993 | 26.790 | 0.061 | 0.143 | |
| 贵州 | 1.152 | 0.500 | 9.848 | 0.934 | 0.625 | 2.575 | 0.852 | 15.955 | 0.140 | 0 | |
| 云南 | 1.513 | 1.079 | 4.027 | 0.883 | 1.918 | 3.940 | 1.000 | 19.092 | 0.571 | 0 | |
| [1] |
|
| [2] |
王兵, 杨华, 朱宁. 中国各省份农业效率和全要素生产率增长——基于SBM方向性距离函数的实证分析[J]. 南方经济, 2011(10):12-26.
|
| [3] |
薛建良, 李秉龙. 基于环境修正的中国农业全要素生产率度量[J]. 中国人口·资源与环境, 2011, 21(5):113-118.
|
| [4] |
杨俊, 陈怡. 基于环境因素的中国农业生产率增长研究[J]. 中国人口·资源与环境, 2011, 21(6):153-157.
|
| [5] |
李谷成, 陈宁陆, 闵锐. 环境规制条件下中国农业全要素生产率增长与分解[J]. 中国人口·资源与环境, 2011, 21(11):153-160.
|
| [6] |
潘国言, 龙方, 周发明. 我国区域生猪生产效率的综合评价[J]. 农业技术经济, 2011(3):58-66.
|
| [7] |
刘清泉, 周发明. 我国生猪养殖效益的影响因素分析[J]. 中国畜牧杂志, 2012, 48(22):47-54.
|
| [8] |
梁建宏, 刘清泉. 我国生猪生产规模报酬与全要素生产率[J]. 农业技术经济, 2014(8):44-52.
|
| [9] |
闫振宇, 陶建平, 徐家鹏. 中国生猪生产的区域效率差异及其适度规模选择[J]. 经济地理, 2012, 32(7):107-112.
|
| [10] |
李杰, 胡向东, 王玉斌. 生猪养殖户养殖效率分析——基于4省277户养殖户的调研[J]. 农业技术经济, 2019(8):29-39.
|
| [11] |
张晓恒, 周应恒, 张蓬. 中国生猪养殖的环境效率估算——以粪便中氮盈余为例[J]. 农业技术经济, 2015(5):92-101.
|
| [12] |
吴学兵, 乔娟, 李谷成. 环境约束下的中国规模猪场生产率增长与分解研究[J]. 统计与决策, 2013(20):118-120.
|
| [13] |
王德鑫, 郑炎成, 李谷成, 等. 环境规制条件下我国规模化生猪生产效率的测度与分析——兼论生猪养殖的适度规模经营[J]. 农业现代化研究, 2015, 36(5):818-825.
|
| [14] |
郑微微, 胡浩, 周力. 基于碳排放约束的生猪养殖业生产效率研究[J]. 南京农业大学学报:社会科学版, 2013, 13(2):60-67.
|
| [15] |
左永彦, 彭珏, 封永刚. 环境约束下规模生猪养殖的全要素生产率研究[J]. 农村经济, 2016(9):37-43.
|
| [16] |
王雪娇, 肖海峰. 中国生猪养殖业生产效率和全要素生产率增长——基于SBM方向性距离函数的实证分析[J]. 北京航空航天大学学报:社会科学版, 2017, 30(4):67-76.
|
| [17] |
王刚毅, 申玉琢, 王舫. 基于DEA-Tobit法的生猪养殖生态效率估算及影响因素分析——以黑龙江省为例[J]. 东北农业大学学报:社会科学版, 2018, 16(4):13-18.
|
| [18] |
于连超, 张卫国, 毕茜, 等. 中国生猪养殖业绿色全要素生产率的测算[J]. 统计与决策, 2020(13):107-110.
|
| [19] |
|
| [20] |
|
| [21] |
|
| [22] |
吴根义, 廖新俤, 贺德春, 等. 我国畜禽养殖污染防治现状及对策[J]. 农业环境科学学报, 2014, 33(7):1 261-1 264.
|
| [23] |
祝其丽. 猪场清粪方式调查与沼气工程适用性分析[J]. 中国沼气, 2011(1):27-28.
|
| [24] |
杜红梅, 李孟蕊, 王明春, 等. 基于SE-DEA模型的中国生猪规模养殖环境效率时空差异研究[J]. 中国畜牧杂志, 2017, 53(1):131-137.
|
| [25] |
杜红梅, 王明春, 胡梅梅. 湖南省生猪规模养殖环境效率及其比较分析——基于SE-SBM模型及2004—2014年的数据[J]. 湖南农业大学学报:社会科学版, 2017, 18(1):67-76.
|
/
| 〈 |
|
〉 |