
The Characteristics of Spatial-Temporal Evolution of Chinese Technology Market
Received date: 2019-11-14
Revised date: 2020-06-15
Online published: 2025-04-23
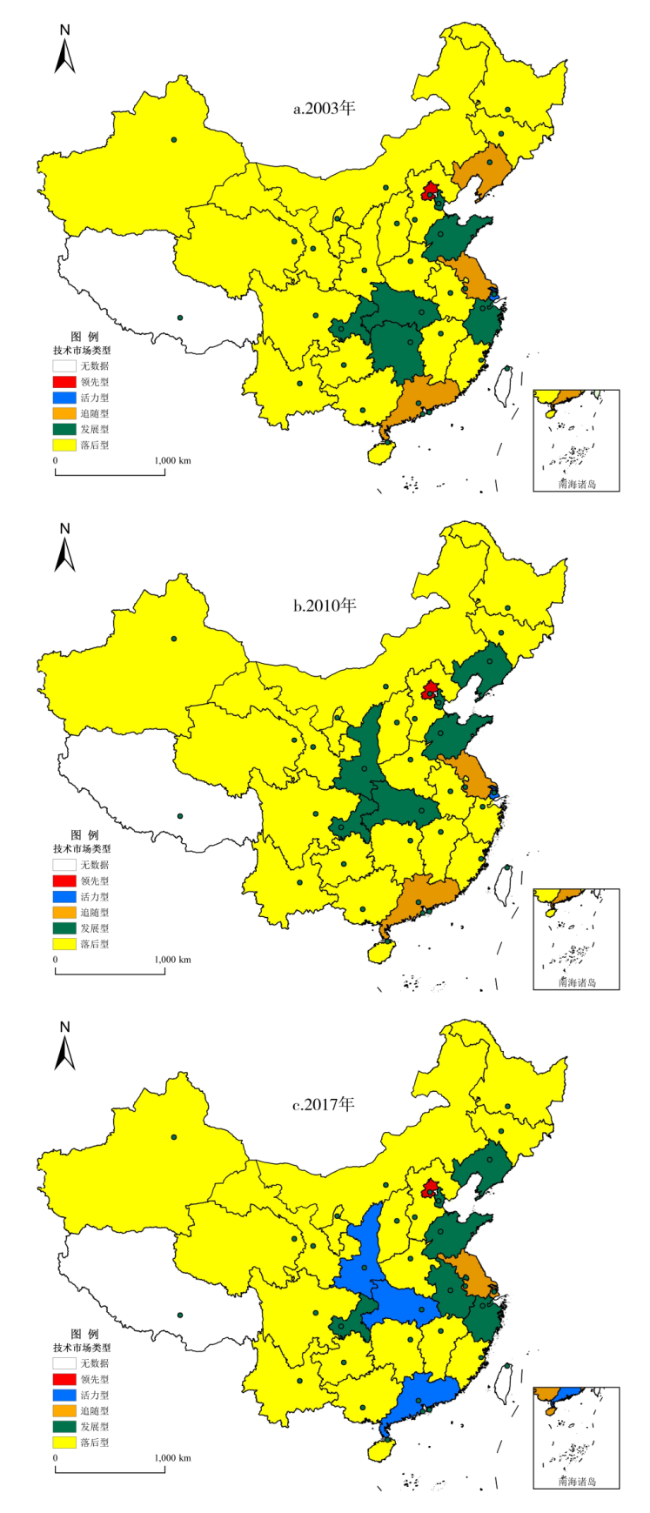
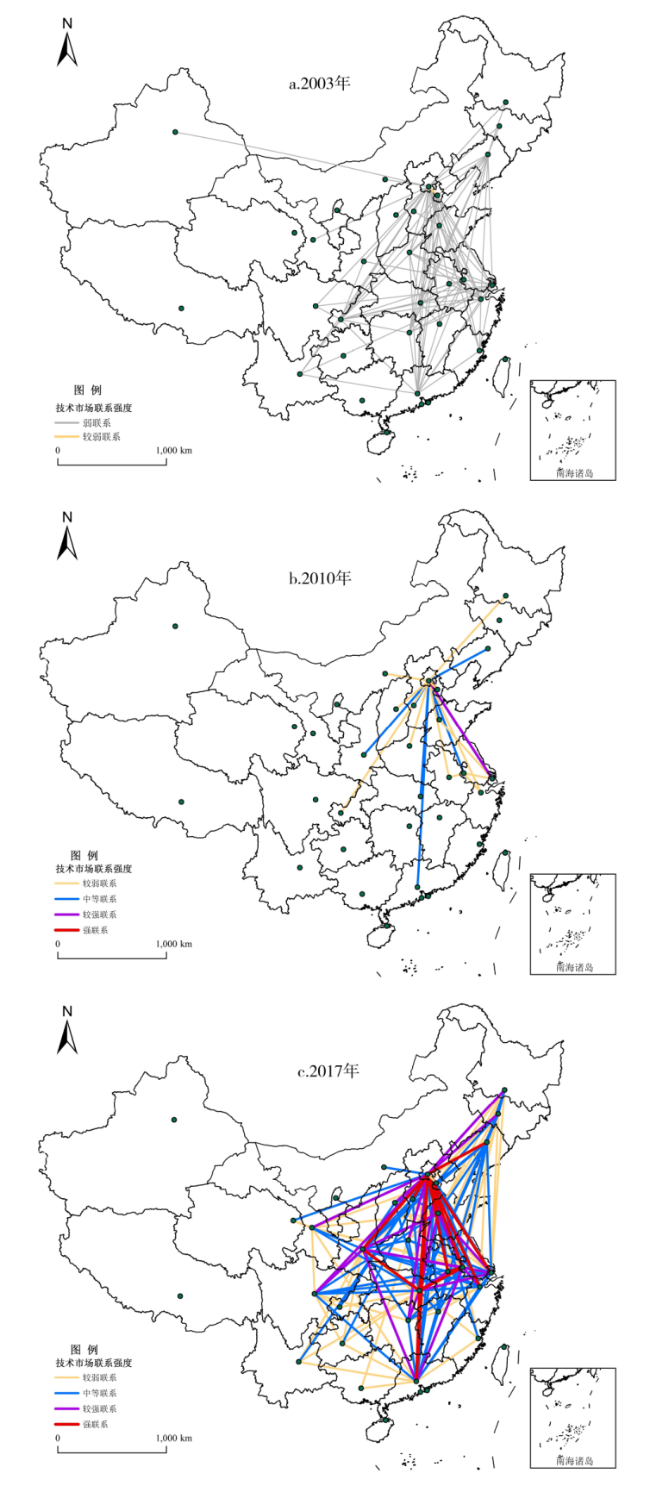
This paper takes the technology market of 30 provinces (municipalities and autonomous regions) as the research object. According to the research idea of "point-line-face", using fractal theory, linkage strength model and membership degree model to analyze the temporal and spatial pattern evolution characteristics of Chinese technology market during 2003-2017,and draw the following conclusions: 1) At the "point" level. Most of technology marke around China belongs to the backward technology market. The technology market has fractal features,and the scale distribution is scattered. The transaction size in different regions has large difference, the technology market that has large scale is outstanding, and the technology market that has large scale,however technology market that has small and medium scale is not developed enough.It is necessary to improve regional balance. From the perspective of regional heterogeneity, technology market in the eastern and western regions shows a decentralized development trend,and technology market in the central region shows a decentralized-centralized-decentralized development trend. 2) At the "line" level, because of the level of technological development and the location of geospatial space, there is a low connect between technology market. 3)At the "face" level,technology market is mainly centered on Beijing, Shanghai, Hubei, Guangdong and Shanxi. And the contiguous trend of center regions is becoming more and more significant. Bace on this,this paper proposes to strengthen the leading role of the technology market. Make full use of technology market + internet and strengthen the line relationship between technology markets to solve the information asymmetry between supply and demand in technology market. Strengthen the ability of the technology market to serve the locality, and improve the performance of the piece.
ZHANG Lin , MO Cailing . The Characteristics of Spatial-Temporal Evolution of Chinese Technology Market[J]. Economic geography, 2020 , 40(9) : 125 -132 . DOI: 10.15957/j.cnki.jjdl.2020.09.013
表1 中国技术市场分维值测算结果Tab.1 Calculation results of fractal dimension of Chinese technology market |
| 年份 | 等级分布回归方程 | Zipf指数 | 分维值(D) | 相关系数(R2) |
|---|---|---|---|---|
| 2003 | lnN(r)=6.570-1.546lnr | 1.546 | 0.647 | 0.813 |
| 2010 | lnN(r)=7.808-1.682lnr | 1.682 | 0.595 | 0.855 |
| 2017 | lnN(r)=9.211-1.697lnr | 1.697 | 0.589 | 0.785 |
表2 东、中和西部地区技术市场分维值测算结果Tab.2 Calculating results of fractal dimensions of technology markets in eastern,central and western regions |
| 年份 | 等级分布回归方程 | Zipf指数 | 分维值(D) | 相关系数(R2) | |
|---|---|---|---|---|---|
| 东部地区 | 2003 | lnN(r)= 6.233-1.633lnr | 1.633 | 0.612 | 0.654 |
| 2010 | lnN(r)= 7.769-1.997lnr | 1.997 | 0.501 | 0.816 | |
| 2017 | lnN(r)= 8.875-1.972lnr | 1.972 | 0.507 | 0.654 | |
| 中部地区 | 2003 | lnN(r)= 4.047-1.128lnr | 1.128 | 0.887 | 0.876 |
| 2010 | lnN(r)= 4.574-0.783lnr | 0.783 | 1.277 | 0.964 | |
| 2017 | lnN(r)= 6.715-1.142lnr | 1.142 | 0.876 | 0.942 | |
| 西部地区 | 2003 | lnN(r)= 4.502-1.614lnr | 1.614 | 0.620 | 0.814 |
| 2010 | lnN(r)= 5.500-1.750lnr | 1.750 | 0.571 | 0.823 | |
| 2017 | lnN(r)= 7.259-1.979lnr | 1.979 | 0.505 | 0.902 |
表3 中国技术市场空间联系总量Tab.3 Total spatial linkage of Chinese technology markets |
| 地区 | 2003 | 2010 | 2017 | |||||
|---|---|---|---|---|---|---|---|---|
| 联系 总量 | 占比 (%) | 联系 总量 | 占比 (%) | 联系 总量 | 占比 (%) | |||
| 北京 | 291.02 | 25.43 | 4 488.64 | 36.13 | 54 512.24 | 31.11 | ||
| 天津 | 123.92 | 10.83 | 1 745.87 | 14.05 | 24 368.74 | 13.91 | ||
| 河北 | 13.00 | 1.14 | 154.30 | 1.24 | 2 352.35 | 1.34 | ||
| 山西 | 4.46 | 0.39 | 99.39 | 0.80 | 1 750.21 | 1.00 | ||
| 内蒙 | 12.74 | 1.11 | 133.50 | 1.07 | 322.51 | 0.18 | ||
| 辽宁 | 55.86 | 4.88 | 478.38 | 3.85 | 4 799.69 | 2.74 | ||
| 吉林 | 7.25 | 0.63 | 56.00 | 0.45 | 2 151.33 | 1.23 | ||
| 黑龙江 | 8.59 | 0.75 | 131.56 | 1.06 | 1 307.10 | 0.75 | ||
| 上海 | 99.76 | 8.72 | 1 059.48 | 8.53 | 7 427.98 | 4.24 | ||
| 江苏 | 88.69 | 7.75 | 909.27 | 7.32 | 11 382.69 | 6.50 | ||
| 浙江 | 56.76 | 4.96 | 219.27 | 1.77 | 4 309.89 | 2.46 | ||
| 安徽 | 13.83 | 1.21 | 227.57 | 1.83 | 4 624.79 | 2.64 | ||
| 福建 | 13.39 | 1.17 | 87.73 | 0.71 | 722.52 | 0.41 | ||
| 江西 | 9.71 | 0.85 | 79.39 | 0.64 | 1 385.71 | 0.79 | ||
| 山东 | 83.73 | 7.32 | 645.91 | 5.20 | 10 866.70 | 6.20 | ||
| 河南 | 28.56 | 2.50 | 142.67 | 1.15 | 1 465.38 | 0.84 | ||
| 湖北 | 47.62 | 4.16 | 330.34 | 2.66 | 13 368.62 | 7.63 | ||
| 湖南 | 37.12 | 3.24 | 126.78 | 1.02 | 2 695.40 | 1.54 | ||
| 广东 | 50.64 | 4.42 | 447.12 | 3.60 | 6 873.67 | 3.92 | ||
| 广西 | 2.96 | 0.26 | 8.74 | 0.07 | 322.65 | 0.18 | ||
| 海南 | 0.75 | 0.07 | 6.16 | 0.05 | 29.77 | 0.02 | ||
| 重庆 | 41.45 | 3.62 | 199.49 | 1.61 | 552.99 | 0.32 | ||
| 四川 | 10.50 | 0.92 | 131.02 | 1.05 | 3 483.46 | 1.99 | ||
| 贵州 | 1.49 | 0.13 | 18.21 | 0.15 | 722.56 | 0.41 | ||
| 云南 | 12.91 | 1.13 | 19.40 | 0.16 | 576.99 | 0.33 | ||
| 陕西 | 16.64 | 1.45 | 334.42 | 2.69 | 10 599.97 | 6.05 | ||
| 甘肃 | 5.55 | 0.49 | 107.59 | 0.87 | 1 571.97 | 0.90 | ||
| 青海 | 0.55 | 0.05 | 26.60 | 0.21 | 593.19 | 0.34 | ||
| 宁夏 | 0.81 | 0.07 | 2.98 | 0.02 | 73.22 | 0.04 | ||
| 新疆 | 4.09 | 0.36 | 5.44 | 0.04 | 24.78 | 0.01 | ||
表4 中心地区腹地范围Tab.4 The hinterland of central areas |
| 年份 | 中心地区 | 腹地范围 |
|---|---|---|
| 2003 | 北京 | 天津、河北、内蒙古、辽宁、山东 |
| 上海 | 山西、吉林、黑龙江 | |
| 湖北 | 江苏、安徽、江西、湖南 | |
| 广东 | 浙江、福建、广西、海南、贵州、云南 | |
| 陕西 | 河南、重庆、四川、甘肃、青海、宁夏、新疆 | |
| 2010 | 北京 | 天津、河北、山西、内蒙古、辽宁、吉林、黑龙江、 上海、山东 |
| 湖北 | 江苏、安徽、江西、湖南 | |
| 广东 | 浙江、福建、广西、海南、四川、贵州、云南、新疆 | |
| 陕西 | 河南、重庆、甘肃、青海、宁夏 | |
| 2017 | 北京 | 天津、河北、山西、吉林、山东 |
| 上海 | 内蒙古、辽宁、黑龙江 | |
| 湖北 | 江苏、安徽、江西、湖南 | |
| 广东 | 浙江、福建、广西、海南、四川、贵州、云南 | |
| 陕西 | 河南、重庆、甘肃、青海、宁夏、新疆 |
| [1] |
约瑟夫·熊彼特. 经济发展理论[M]. 北京: 商务印书馆, 1990.
|
| [2] |
|
| [3] |
|
| [4] |
|
| [5] |
吕国庆, 曾刚, 顾娜娜. 经济地理学视角下区域创新网络的研究综述[J]. 经济地理, 2014, 34(2):1-8.
|
| [6] |
|
| [7] |
|
| [8] |
|
| [9] |
|
| [10] |
|
| [11] |
张江雪. 我国技术市场的发展现状、问题及对策分析[J]. 科学管理研究, 2010, 28(4):50-53,63.
|
| [12] |
黄微, 尹爽, 桓明姣, 等. 基于SWOT分析的东北地区技术市场发展战略选择研究[J]. 情报科学, 2011, 29(6):914-919.
|
| [13] |
|
| [14] |
刘凤朝, 林原, 马荣康. 多维邻近性对技术交易网络的动态影响研究[J]. 科学学研究, 2018, 36(12):2 205-2 214.
|
| [15] |
张欣炜, 林娟. 中国技术市场发展的空间格局及影响因素分析[J]. 科学学研究, 2015(10): 1 471-1 478.
|
| [16] |
刘凤朝, 马荣康. 区域间技术转移的网络结构及空间分布特征研究——基于我国2006-2010省际技术市场成交合同的分析[J]. 科学学研究, 2013, 31(4):529-536.
|
| [17] |
雷滔, 陈向东. 区域校企合作申请专利的网络图谱分析[J]. 科研管理, 2011, 32(2):67-73.
|
| [18] |
李丹丹, 汪涛, 魏也华, 等. 中国城市尺度科学知识网络与技术知识网络结构的时空复杂性[J]. 地理研究, 2015(3):525-540.
|
| [19] |
姚作林, 涂建军, 牛慧敏, 等. 成渝经济区城市群空间结构要素特征分析[J]. 经济地理, 2017, 37(1):82-89.
|
| [20] |
宋琼, 谢志祥, 李同昇, 等. 长江中游城市群城市网络空间结构研究[J]. 地域研究与开发, 2017, 36(3):59-65.
|
| [21] |
李一曼, 修春亮, 魏冶, 等. 浙江三大城镇群空间组织与结构演变[J]. 经济地理, 2016, 36(11):47-53.
|
| [22] |
毕强, 姜毓锋. 我国网上技术市场发展模式及对策研究[J]. 图书情报工作, 2009, 53(22):30-34.
|
| [23] |
|
| [24] |
郑荣, 姜毓锋. 技术市场发展现状及其影响因素分析[J]. 图书情报工作, 2009, 53(22):13-17.
|
| [25] |
杨开忠, 陈良文. 中国区域城市体系演化实证研究[J]. 城市问题, 2008(3):6-12.
|
| [26] |
刘学华, 张学良, 李鲁. 中国城市体系规模结构:特征事实与经验阐释[J]. 财经研究, 2015, 41(11):108-123.
|
| [27] |
刘继生, 陈彦光. 城镇体系等级结构的分形维数及其测算方法[J]. 地理研究, 1998(1):83-90.
|
| [28] |
张鸿鹤, 马荣康, 刘凤朝. 基于引力模型的东北地区创新产出空间联系研究[J]. 大连理工大学学报:社会科学版, 2017, 38(4):33-39.
|
| [29] |
王晶晶, 程钰, 曹欣欣. 山东省区域创新产出空间演化与影响因素研究[J]. 华东经济管理, 2018, 32(11):14-21.
|
| [30] |
李凌月, 张啸虎, 罗瀛. 基于创新产出的城市科技创新空间演化特征分析——以上海市为例[J]. 城市发展研究, 2019, 26(6):87-92,33.
|
| [31] |
吕海萍, 池仁勇, 化祥雨. 创新资源协同空间联系与区域经济增长——基于中国省域数据的实证分析[J]. 地理科学, 2017, 37(11):1 649-1 658.
|
| [32] |
杨志民, 化祥雨, 邵元海, 等. 外商直接投资空间联系研究——以浙江省为例[J]. 经济地理, 2013, 33(11):21-27.
|
| [33] |
刘静玉, 杨虎乐, 宋琼, 等. 中原经济区城市间相互作用时空格局演变研究[J]. 地理科学, 2014, 34(9):1 060-1 068.
|
/
| 〈 |
|
〉 |