
Spatio-Temporal Patterns Evolution and Impact Mechanism of the Agglomeration of Creative Talents in China
Received date: 2019-12-02
Revised date: 2020-07-13
Online published: 2025-04-23
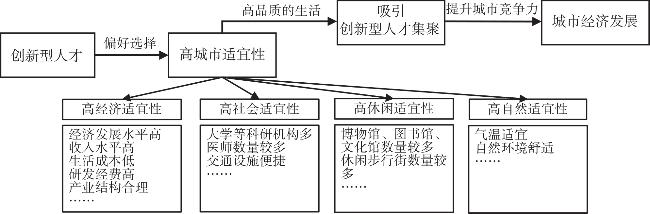
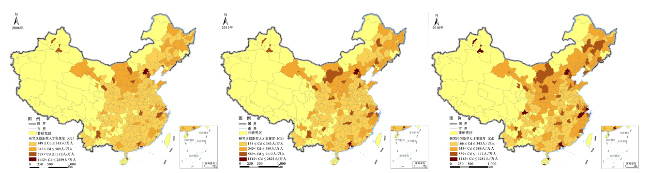
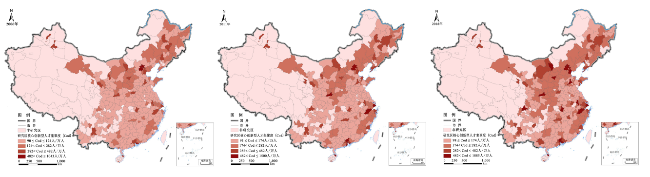
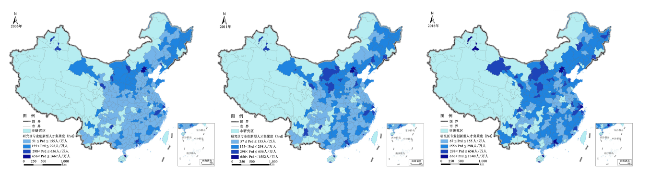
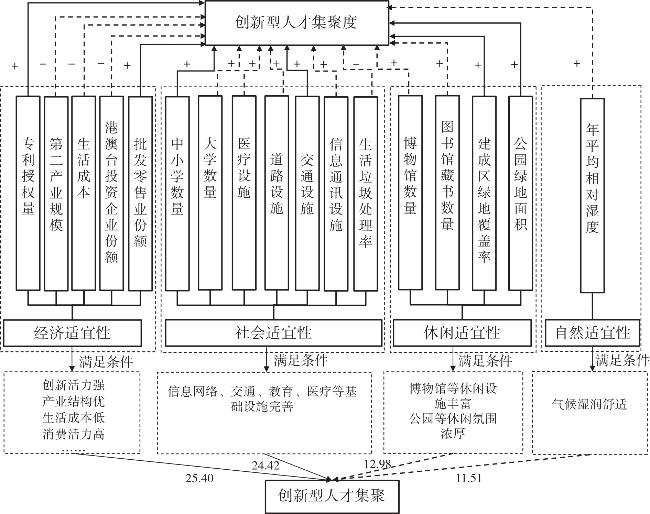
As an important factor of production,the scale and quality of creative talents determine the core competitive advantages of urban development and profoundly affect the development of urban social economy. Based on the urban amenity theory,this paper constructs an urban amenity theoretical model and an evaluation index system of impact factors of creative talent agglomeration,and explores the spatio-temporal pattern and impact mechanism of creative talent agglomeration in China. Conclusions are drawn as follows: 1) China has formed the agglomeration points of creative talents in the provincial capitals and municipality,showing the "Center-Peripheral" pattern of spatial distribution. The eastern region has always been the main gathering area of creative talents in China,while the central and western regions are the weak areas of creative talents in China from 2006 to 2016. However,in recent years,the creative talents show the trend of flowing to the western region,while they gather in the eastern region,and the growth rate of creative talents in the western regions has been accelerating. Nevertheless,the growth rate of creative talents in the northeast is the slowest,and the aggregation degree of creative talents in the major cities of the northeast tends to decrease in the national ranking. 2) Economic amenity is still the most important factor affecting the aggregation of creative talents. And while,the number of patents and the proportion of tertiary industry have the greatest impact on the spatial distribution of creative talents. 3) The impact of social amenity and leisure amenity on the aggregation of creative talents ranks the second and the third. Among them,the infrastructure of education,medical care,as well as museums and park areas have also become the main factors affecting the aggregation of creative talents. Accordingly,this paper suggests that it is essential for policy makers to focus on the humanistic needs of creative talents while enhancing their economic vitality,and increase investment in infrastructure and leisure facilities to attract creative talents.
CUI Dan , LI Guoping , WU Dianting , SUN Yukang . Spatio-Temporal Patterns Evolution and Impact Mechanism of the Agglomeration of Creative Talents in China[J]. Economic geography, 2020 , 40(9) : 1 -14 . DOI: 10.15957/j.cnki.jjdl.2020.09.001
表1 中国创新型人才集聚影响因素的综合指标体系Tab.1 Evaluation index system of impact factors of creative talents agglomeration in China |
| 变量名 | 单位 | 指标释义与影响性质 | 权重 | 功效性 | |
|---|---|---|---|---|---|
| 经 济 适 宜 性 | 第二产业占GDP比重(Industry) | % | 衡量城市产业结构 | 0.0143 | 正向指标 |
| 第三产业占GDP比重(Tindustry) | % | 衡量城市第三产业发展 | 0.0131 | 正向指标 | |
| 每万人拥有的专利授权量(Patent) | 个/万人 | 衡量城市的创新活力 | 0.3675 | 正向指标 | |
| 生活成本(Lcost) | 房价收入比,用来衡量城市生活成本 | 0.0210 | 负向指标 | ||
| 人均GDP (Pgdp) | 元 | 衡量城市的经济发展水平 | 0.0900 | 正向指标 | |
| 外商投资企业份额(Finvest) | % | 衡量城市经济的对外开放程度度 | 0.1232 | 正向指标 | |
| 港澳台投资企业份额(Hinvest) | % | 衡量城市经济的对外开放程度度 | 0.1846 | 正向指标 | |
| 批发零售业份额 (Wholesale) | % | 衡量城市的消费活力 | 0.0720 | 正向指标 | |
| 科学技术支出占总财政支出比(Sexpend) | % | 衡量城市的科学技术投入 | 0.0972 | 正向指标 | |
| 教育支出占总财政支出比(Eexpend) | % | 衡量城市的教育投入 | 0.0171 | 正向指标 | |
| 社 会 适 宜 性 | 每万人拥有的中小学数量(PM) | 所/万人 | 衡量城市教育基础设施配套 | 0.0059 | 正向指标 |
| 每万人拥有的大学数量(Unversity) | 所/万人 | 衡量城市的人才储备 | 0.0969 | 正向指标 | |
| 每万人拥有的医院数量(Hospital) | 个/万人 | 衡量城市医疗设施配套 | 0.0575 | 正向指标 | |
| 每万人拥有的床位数量(Hbed) | 张/万人 | 衡量城市医疗设施配套 | 0.0159 | 正向指标 | |
| 每万人拥有的出租车数量(Texi) | 辆/万人 | 衡量城市公共交通设施配套 | 0.0903 | 正向指标 | |
| 每万人拥有的公共汽车数量(Bus) | 辆/万人 | 衡量城市公共交通设施配套 | 0.0456 | 正向指标 | |
| 每万人拥有的道路面积(Roadway) | 万m2/万人 | 衡量城市道路设施状况 | 0.0326 | 正向指标 | |
| 每万人移动电话用户数量(Mobile) | 户/万人 | 衡量城市的通信设施状况 | 0.0507 | 正向指标 | |
| 每万人互联网接入用户数量(Internet) | 户/万人 | 衡量城市的信息网络设施状况 | 0.0706 | 正向指标 | |
| 生活垃圾无公害处理率(Waste) | % | 衡量城市的环保状况 | 0.1104 | 正向指标 | |
| 污水处理厂集中处理率(Sewage) | % | 衡量城市的环保状况 | 0.0994 | 正向指标 | |
| 休 闲 适 宜 性 | 每万人拥有公园绿地面积(Parka) | 万m2/万人 | 衡量城市的生态休闲环境 | 0.0718 | 正向指标 |
| 建成区绿地覆盖率(Greenc) | % | 衡量城市的绿化水平 | 0.0652 | 正向指标 | |
| 每万人拥有的电影院数量(Cinema) | 个/万人 | 衡量城市的休闲娱乐设施状况 | 0.1579 | 正向指标 | |
| 每万人拥有的博物馆数量(Museum) | 个/万人 | 衡量城市的休闲文化氛围 | 0.0563 | 正向指标 | |
| 每万人公共图书馆藏书数量 (Books) | 册/万人 | 衡量城市的公共资源状况 | 0.0698 | 正向指标 | |
| 每万人拥有的文化馆数量(Gallary) | 个/万人 | 衡量城市的休闲文化氛围 | 0.0590 | 正向指标 | |
| 每万人拥有的艺术团数量(Art) | 个/万人 | 衡量城市的休闲娱乐氛围 | 0.2112 | 正向指标 | |
| 自 然 适 宜 性 | 城市平均气温(Temperature) | ℃ | 衡量城市的舒适度 | 0.2765 | 正/负向指标 |
| 城市年平均相对湿度(Humidity) | % | 衡量城市的舒适度 | 0.6662 | 正/负向指标 | |
| 每平方公里工业烟(粉)尘排放量(Smoke) | t/km2 | 衡量城市的空气质量 | 0.0097 | 负向指标 | |
| 每平方公里SO2排放量(SO2) | t/km2 | 衡量城市的空气质量 | 0.0333 | 负向指标 | |
| 每平方公里工业废水排放量(Effluent) | 万t/km2 | 衡量城市的空气质量 | 0.0143 | 负向指标 | |
注:生活成本=城市住宅房价/可支配收入。人均GDP是以2006年为基年,对每个城市2007—2016年的GDP进行不变价处理获得。 |
表2 本文关于创新型人才的分类Tab.2 The classification of creative talents in this study |
| 类型 | 职业类别 | |
|---|---|---|
| 创新型人才 | 超级创意 核心人才 | 信息传输、计算机服务和软件业人才 |
| 金融业人才 | ||
| 科学研究、技术服务和地质勘查业人才 | ||
| 文化、体育、娱乐业人才 | ||
| 教育业人才 | ||
| 其他专业 知识人才 | 房地产业人才 | |
| 水利、环境和公共设施管理业人才 | ||
| 公共管理和社会组织行业人才 | ||
| 职业医师和职业助理医师 | ||
| 租赁和商业服务业人才 |
表3 2006—2016年创新型人才空间集聚影响因素分析的面板回归结果Tab.3 Results of panel analysis predicting the impact factors of creative talents agglomeration from 2006 to 2016 |
| 解释变量 | 被解释变量 | ||
|---|---|---|---|
| 创新型人才 | 超级创意核心人才 | 其他专业知识人才 | |
| 方法 | |||
| Drisc-kraay稳健 型标准误估计 | Drisc-kraay稳健 型标准误估计 | Drisc-kraay稳健 型标准误估计 | |
| ln Em | 0.2540***(10.25) | 0.1779***(4.87) | 0.3250***(8.90) |
| ln Sm | 0.2442***(8.89) | 0.1710***(8.47) | 0.2911***(5.52) |
| ln Lm | 0.1298***(8.67) | 0.0602***(6.01) | 0.1196***(10.54) |
| ln Nm | 0.1151*(1.96) | 0.1286***(1.95) | 0.0974*(1.81) |
| 常数项 | 6.9183***(48.83) | 5.9273***(57.11) | 6.5322***(34.99) |
| F值 | 327.91*** | 233.14*** | 303.13*** |
| R2 | 0.5008 | 0.6385 | 0.6081 |
| 观测值 | 2992 | 2992 | 2992 |
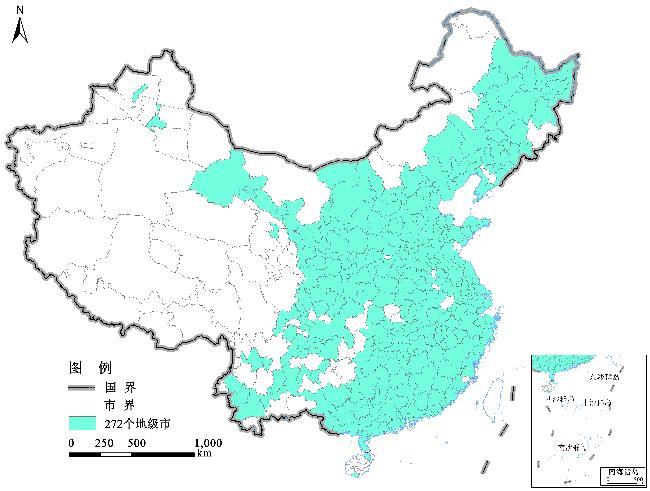
| 城市数 | 272 | 272 | 272 |
注:括号中的数字为面板校正标准误估计的z值。***表示1%置信水平上显著;**表示5%置信水平上显著;*表示10%置信水平上显著。 |
表4 2006—2016年创新型人才空间集聚核心要素分析的面板回归结果Tab.4 Results of panel analysis predicting the core factors of creative talents agglomeration from 2006 to 2016 |
| 被解释变量 | 创新型人才 | 被解释变量 | 超级创意核心人才 | 被解释变量 | 其他专业知识人才 |
|---|---|---|---|---|---|
 | Drisc-kraay稳健型 标准误估计 |  | Drisc-kraay稳健型 标准误估计 |  | 面板校正标准 误估计PSCE |
| ln Lcost | -0.0563***(-4.77) | ln Industry | -0.1684***(-5.27) | ln Lcost | -0.0772***(-6.27) |
| ln Industry | -0.1830***(-10.46) | ln Patent | 0.1909***(12.19) | ln Industry | -0.1748***(-7.30) |
| ln Patent | 0.1288***(12.67) | ln Hinvest | -0.0082***(-4.30) | ln Patent | 0.1396***(12.03) |
| ln Hinvest | -0.0093***(-8.27) | ln Wholesale | 0.0294**(2.26) | ln Hinvest | -0.0079***(-5.10) |
| ln Wholesale | 0.0370***(3.08) | ln University | 0.0079***(3.94) | ln Wholesale | 0.0412***(3.50) |
| ln PM | 0.0717***(2.93) | ln Hbed | 0.0856**(2.56) | ln Pm | 0.0665***(3.26) |
| ln University | 0.0083***(2.63) | ln Taxi | 0.0474***(2.80) | ln University | 0.0093**(2.15) |
| ln Hbed | 0.1145***(3.50) | ln Roadway | 0.0290***(4.94) | ln Hbed | 0.1410***(4.36) |
| ln Taxi | 0.0392***(2.96) | ln Waste | -0.0098***(-3.94) | ln Taxi | 0.0334***(2.98) |
| ln Roadway | 0.0345***(3.40) | ln Mobile | 0.0101*(1.88) | ln Waste | -0.0082***(-3.72) |
| ln Waste | -0.0085***(-3.87) | ln Cinema | 0.0094***(3.65) | ln Mobile | 0.0189***(2.84) |
| ln Mobile | 0.0161**(2.58) | ln Humidity | 0.0794**(2.54) | ln Internet | 0.0119***(4.72) |
| ln Books | 0.0305**(2.61) | 常数项 | 3.2928***(3.48) | ln Books | 0.0331**(2.00) |
| ln Parka | 0.0359***(3.89) | F值 | 7 376.20*** | ln Parka | 0.0565***(5.89) |
| ln Greenc | 0.0119***(4.77) | R2 | 0.5795 | ln Greenc | 0.0121***(3.93) |
| ln Museum | 0.0194***(7.94) | 观测值 | 2992 | ln Museum | 0.0262***(8.40) |
| ln Humidity | 0.1068**(2.55) | 城市数 | 272 | ln Gallary | 0.0326**(2.35) |
| 常数项 | 4.0901***(5.22) | ln Temperature | 0.1025*(1.65) | ||
| F值 | 1 251.27*** | ln Humidity | 0.1029**(3.04) | ||
| R2 | 0.5808 | 常数项 | 2.4573***(2.77) | ||
| 观测值 | 2 992 | F值 | 48.17*** | ||
| 城市数 | 272 | R2 | 0.6182 | ||
| 观测值 | 2 992 | ||||
| 城市数 | 272 |
注:括号中的数字为面板校正标准误估计的z值。***表示1%置信水平上显著;**表示5%置信水平上显著;*表示10%置信水平上显著。 |
| [1] |
|
| [2] |
|
| [3] |
|
| [4] |
|
| [5] |
|
| [6] |
|
| [7] |
|
| [8] |
|
| [9] |
|
| [10] |
|
| [11] |
|
| [12] |
|
| [13] |
|
| [14] |
|
| [15] |
|
| [16] |
孙健, 尤雯. 人才集聚与产业集聚的互动关系研究[J]. 管理世界, 2008(3):177-178.
|
| [17] |
林毅夫, 陈斌开. 发展战略、产业结构与收入分配[J]. 经济学(季刊), 2013, 12(4):1109-1 140.
|
| [18] |
温婷, 林静, 蔡建明, 等. 城市舒适性:中国城市竞争力评估的新视角及实证研判[J]. 地理研究, 2016, 35(2):214-226.
|
| [19] |
朱翔. 中国人才时期与人才地理研究[J]. 人文地理, 2001, 16(5):11-15.
|
| [20] |
|
| [21] |
王宁. 地方消费主义、城市舒适物与产业结构优化:从消费社会学视角看产业转型升级[J]. 社会学研究, 2014(4):24-48.
|
| [22] |
|
| [23] |
王宁. 消费流动:人才流动的又一动因——“地理流动与社会流动”的理论探究之一[J]. 学术研究, 2014(10):29-37.
|
| [24] |
杨开忠. 京津冀协同发展的新逻辑:地方品质驱动型发展[J]. 经济与管理, 2019(1):1-3.
|
| [25] |
|
| [26] |
|
| [27] |
|
| [28] |
|
| [29] |
|
| [30] |
|
| [31] |
|
| [32] |
|
| [33] |
周后福. 气候变化对人体健康影响的综合指标探讨[J]. 气候与环境研究, 1999, 4(1):121-126.
|
| [34] |
|
| [35] |
|
| [36] |
|
| [37] |
国家职业分类大典修订工作委员会. 中华人民共和国职业分类大典2015年修订版[M]. 北京: 中国劳动社会保障出版社, 2015.
|
| [38] |
国家统计局,中国标准化研究院. 中华人民共和国国家标准GB/T 4754-2017国民经济行业分类[S]. 中华人民共和国国家质量监督检验检疫总局和中国国家标准化管理委员会发布, 2017-06-30.
|
| [39] |
|
| [40] |
郭鑫鑫, 杨河清. 中国省际人才分布影响因素的实证研究[J]. 人口与经济, 2018(3):47-55.
|
| [41] |
张波, 丁金宏. 中国省域高端人才空间分布及变动趋势:2000-2015年[J]. 干旱区资源与环境, 2019, 33(2):32-36.
|
| [42] |
李瑞, 吴殿廷, 鲍捷, 等. 高级科学人才集聚成长的时空格局演化及其驱动机制——基于中国科学院院士的典型分析[J]. 地理科学进展, 2013, 32(7):1123-1 138.
|
| [43] |
姜怀宇, 徐效坡, 李铁立. 1990年代以来中国人才分布的空间变动分析[J]. 经济地理, 2005, 25(5):702-706.
|
| [44] |
吴殿廷. 区域经济学(第三版)[M]. 北京: 科学出版社, 2017.
|
| [45] |
|
| [46] |
|
| [47] |
|
| [48] |
|
| [49] |
蔡昉. 理解中国经济发展的过去、现在和将来——基于一个贯通的增长理论框架[J]. 经济研究, 2013(11):4-16.
|
| [50] |
|
| [51] |
赵海益, 李永刚, 尚俊松. “高房价”对中国地区间人才竞争影响的实证研究[J]. 南京财经大学学报(双月刊), 2019(1):26-35.
|
| [52] |
|
| [53] |
牛冲槐, 张帆, 封海燕. 科技型人才聚集、高新技术产业聚集与区域技术创新[J]. 科技进步与对策, 2012, 29(15):46-51.
|
| [54] |
汤清. 广东省金融支持下的产业转移溢出效应研究[D]. 广州: 华南理工大学, 2011.
|
| [55] |
|
| [56] |
|
/
| 〈 |
|
〉 |