
Spatial-Temporal Evolution of Airbnb in Beijing and Its Influencing Factors
Received date: 2020-04-03
Revised date: 2020-09-18
Online published: 2025-04-22
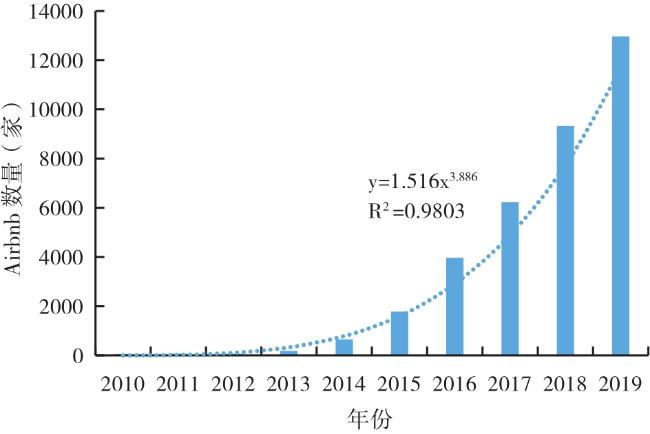
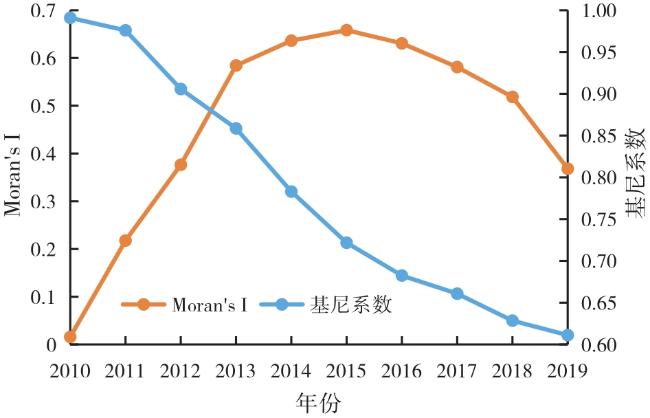
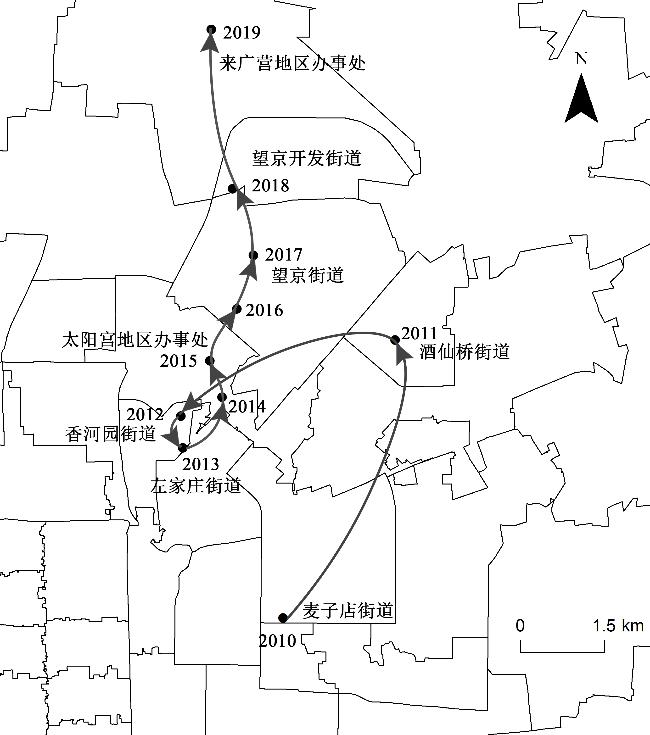
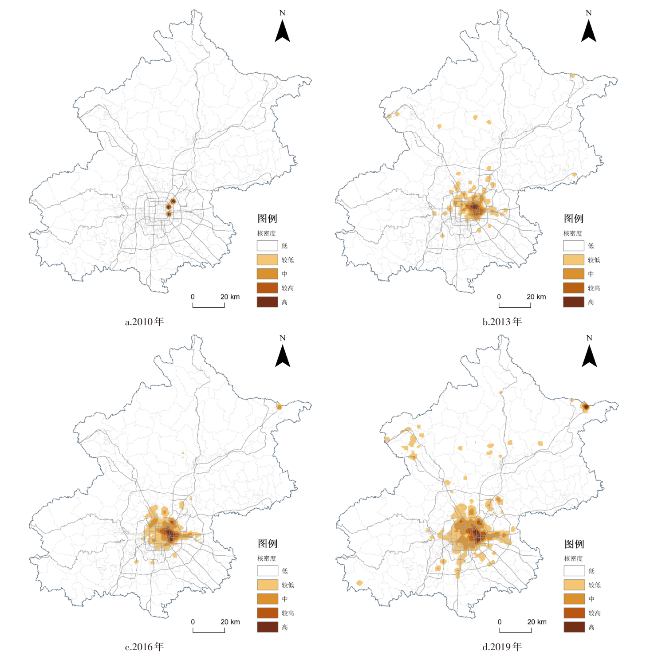
Airbnb,as a typical representative of the sharing economy in the accommodation industry,has become a strong competitor of the traditional hotel industry. Based on Beijing Airbnb data from 2010 to 2019,this paper uses GIS spatial analysis and spatial variogram methods to analyze the spatial and temporal evolution and agglomeration characteristics of Beijing Airbnb,and further explores the influencing factors of its spatial and temporal evolution. The research shows that: 1) The overall situation of Beijing's Airbnb distribution is from centralized and agglomerated to balanced and dispersed. The geographic center of gravity of the distribution has shifted significantly toward the north,gradually moves from the city center to the suburb along the trunk road. 2) The overall spatial difference of the Beijing Airbnb distribution is increasing,and the degree of random variation in the distribution has decreased since 2016. Regional differences are mainly reflected in the northeast-southwest direction,and the distribution in the southeast-northwest direction is better. 3) The urban spatial structure,the development of tourist attractions,the environment of policies and regulations,major festivals and so on are important factors affecting the spatial and temporal evolution of Airbnb in Beijing.
XIA Xinying , ZHANG Honglei , TIAN Yuan , YANG Yixin , XU Li . Spatial-Temporal Evolution of Airbnb in Beijing and Its Influencing Factors[J]. Economic geography, 2020 , 40(11) : 68 -76 . DOI: 10.15957/j.cnki.jjdl.2020.11.008
表1 北京市主体功能区不同时段新增Airbnb数量Tab.1 The number of new Airbnb in development priority zones of Beijing |
| 分区 | 总数/家 | 占比/% | 2010—2013 | 2013—2016 | 2016—2019 | |||||
|---|---|---|---|---|---|---|---|---|---|---|
| 总数/家 | 占比/% | 总数/家 | 占比/% | 总数/家 | 占比/% | |||||
| 首都核心功能区 | 1 611 | 12.34 | 40 | 22.22 | 536 | 14.33 | 1 035 | 11.34 | ||
| 城市功能拓展区 | 6 679 | 51.17 | 120 | 66.67 | 2 324 | 62.14 | 4 232 | 46.35 | ||
| 城市发展新区 | 2 468 | 18.91 | 12 | 6.67 | 572 | 15.29 | 1 884 | 20.63 | ||
| 生态涵养发展区 | 2 295 | 17.58 | 8 | 4.44 | 308 | 8.24 | 1 979 | 21.68 | ||
| 总数 | 13 053 | 100.00 | 180 | 100.00 | 3 740 | 100.00 | 9 130 | 100.00 | ||
表2 北京市Airbnb变差函数拟合参数Tab.2 The parameters of variogram model of Airbnb in Beijing |
| 年份 | 块金值(C0) | 基台值(C0+C) | 变程(A) | 块金系数(C/ C0+C) | 拟合模型(Model) | 决定系数(R2) | 残差(RSS) |
|---|---|---|---|---|---|---|---|
| 2010 | 0.0008 | 0.0008 | 90 015.919 | 0.000 | 线性模型 | 0.739 | 3.971E+06 |
| 2011 | 0.0056 | 0.0056 | 90 015.919 | 0.000 | 线性模型 | 0.680 | 1.712E+04 |
| 2012 | 0.0179 | 0.0179 | 90 015.919 | 0.000 | 线性模型 | 0.897 | 6.824E+04 |
| 2013 | 0.0502 | 0.0502 | 90 015.919 | 0.000 | 线性模型 | 0.870 | 2.135E+03 |
| 2014 | 0.0198 | 0.1366 | 10 200.000 | 0.855 | 指数模型 | 0.209 | 4.329E+03 |
| 2015 | 0.0584 | 0.2498 | 29 000.000 | 0.766 | 球状模型 | 0.704 | 0.0118 |
| 2016 | 0.0722 | 0.3424 | 36 500.000 | 0.789 | 球状模型 | 0.637 | 0.0394 |
| 2017 | 0.0570 | 0.3930 | 40 000.000 | 0.855 | 球状模型 | 0.709 | 0.0487 |
| 2018 | 0.0500 | 0.4180 | 41 700.000 | 0.880 | 球状模型 | 0.732 | 0.0545 |
| 2019 | 0.0590 | 0.4440 | 46 800.000 | 0.867 | 球状模型 | 0.793 | 0.0457 |
表3 北京市Airbnb变差函数分维数Tab.3 The fractal of variogram of Airbnb in Beijing |
| 年份 | 全方向 | 南—北(0°) | 东北—西南(45°) | 东—西(90°) | 东南—西北(135°) | |||||||||
|---|---|---|---|---|---|---|---|---|---|---|---|---|---|---|
| D | R2 | D | R2 | D | R2 | D | R2 | D | R2 | |||||
| 2010 | 1.710 | 0.922 | 1.755 | 0.810 | 1.692 | 0.798 | 1.638 | 0.837 | 1.752 | 0.496 | ||||
| 2011 | 1.713 | 0.915 | 1.692 | 0.857 | 1.722 | 0.840 | 1.592 | 0.499 | 1.629 | 0.449 | ||||
| 2012 | 1.795 | 0.862 | 1.777 | 0.911 | 1.794 | 0.774 | 1.776 | 0.648 | 1.765 | 0.487 | ||||
| 2013 | 1.886 | 0.577 | 1.895 | 0.585 | 1.865 | 0.486 | 1.846 | 0.494 | 1.899 | 0.231 | ||||
| 2014 | 1.998 | 0.000 | 1.994 | 0.005 | 1.989 | 0.000 | 1.951 | 0.084 | 1.995 | 0.000 | ||||
| 2015 | 1.891 | 0.471 | 1.889 | 0.553 | 1.903 | 0.334 | 1.921 | 0.155 | 1.918 | 0.152 | ||||
| 2016 | 1.866 | 0.489 | 1.859 | 0.750 | 1.874 | 0.347 | 1.883 | 0.248 | 1.922 | 0.224 | ||||
| 2017 | 1.828 | 0.598 | 1.836 | 0.745 | 1.827 | 0.510 | 1.842 | 0.354 | 1.899 | 0.339 | ||||
| 2018 | 1.812 | 0.630 | 1.817 | 0.817 | 1.810 | 0.547 | 1.810 | 0.453 | 1.892 | 0.377 | ||||
| 2019 | 1.798 | 0.720 | 1.812 | 0.891 | 1.792 | 0.630 | 1.777 | 0.630 | 1.893 | 0.390 | ||||
| [1] |
吴晓隽, 裘佳璐. Airbnb房源价格影响因素研究——基于中国36个城市的数据[J]. 旅游学刊, 2019, 34(4):13-28.
|
| [2] |
国家信息中心. 2019中国共享经济发展年度报告[EB/OL]. http://www.sic.gov.cn/News/557/9904.htm,2019-02.
|
| [3] |
北京旅游协会. 北京旅游发展报告(2018)[R]. 北京: 社会科学文献出版社, 2018:29-30.
|
| [4] |
国家信息中心分享经济研究中心. 中国共享住宿发展报告[EB/OL]. http://www.360doc.com/content/19/0704/18/755922_846714199.shtml,2019-07-04.
|
| [5] |
|
| [6] |
|
| [7] |
|
| [8] |
|
| [9] |
|
| [10] |
|
| [11] |
|
| [12] |
|
| [13] |
|
| [14] |
|
| [15] |
|
| [16] |
闫丽英, 韩会然, 陈婉婧, 等. 北京市住宿业空间分布格局及影响因素研究[J]. 经济地理, 2014, 34(1):94-101.
|
| [17] |
北京旅游协会. 北京旅游发展报告(2018)[R]. 北京: 社会科学文献出版社, 2018:253-254.
|
| [18] |
刘汉初, 樊杰, 周道静, 等. 2000年以来中国高耗能产业的空间格局演化及其成因[J]. 经济地理, 2019, 39(5):110-118.
|
| [19] |
唐承财, 孙孟瑶, 万紫微. 京津冀城市群高等级景区分布特征及影响因素[J]. 经济地理, 2019, 39(10):205-213.
|
| [20] |
王亚平, 曹欣欣, 程钰, 等. 山东省污染密集型产业时空演变特征及影响机理[J]. 经济地理, 2019, 39(1):130-139.
|
| [21] |
熊薇, 徐逸伦, 王迎英. 江苏省县域经济差异时空演变[J]. 地理科学进展, 2011, 30(2):225-230.
|
| [22] |
李阳, 陈晓红. 哈尔滨市商业中心时空演变与空间集聚特征研究[J]. 地理研究, 2017, 36(7):1377-1 385.
|
| [23] |
胡璇, 杜德斌. 外资企业研发中心在城市内部的时空演化及机制分析——以上海为例[J]. 经济地理, 2019, 39(7):129-138.
|
| [24] |
郭洁, 吕永强, 沈体雁. 基于点模式分析的城市空间结构研究——以北京都市区为例[J]. 经济地理, 2015, 35(8):68-74.
|
| [25] |
吴媛媛, 宋玉祥. 中国旅游经济空间格局演变特征及其影响因素分析[J]. 地理科学, 2018, 38(9):1491-1 498.
|
| [26] |
车磊, 白永平, 周亮, 等. 中国绿色发展效率的空间特征及溢出分析[J]. 地理科学, 2018, 38(11):1788-1 798.
|
| [27] |
靳诚, 陆玉麒. 基于空间变差函数的长江三角洲经济发展差异演变研究[J]. 地理科学, 2011, 31(11):1329-1 334.
|
| [28] |
栾福明, 张小雷, 杨兆萍, 等. 1990—2011年山东省旅游节庆的时空变异特征及机理[J]. 地理科学进展, 2013, 32(6):940-949.
|
| [29] |
徐冬, 黄震方, 胡小海, 等. 浙江省县域旅游效率空间格局演变及其影响因素[J]. 经济地理, 2018, 38(5):197-207.
|
| [30] |
陈思宇, 张昕彤, 吴迪, 等. 北京市批发企业区位分布演化与驱动力分析[J]. 经济地理, 2016, 36(9):111-117.
|
| [31] |
龙飞, 刘家明, 朱鹤, 等. 长三角地区民宿的空间分布及影响因素[J]. 地理研究, 2019, 38(4):950-960.
|
| [32] |
贾子玉, 高梦瑶, 厉基巍, 等. 基于Airbnb数据的京郊乡村民宿空间分布与影响因素分析[J]. 住区, 2019(2):76-81.
|
| [33] |
王朝辉, 陆林, 方婷, 等. 世博建设期上海市旅游住宿产业空间格局演化[J]. 地理学报, 2012, 67(10):1423-1 437.
|
/
| 〈 |
|
〉 |

