
Distribution and Formative Factors of Tourism Safety Incidents in China
Received date: 2020-01-24
Revised date: 2020-07-09
Online published: 2025-04-22
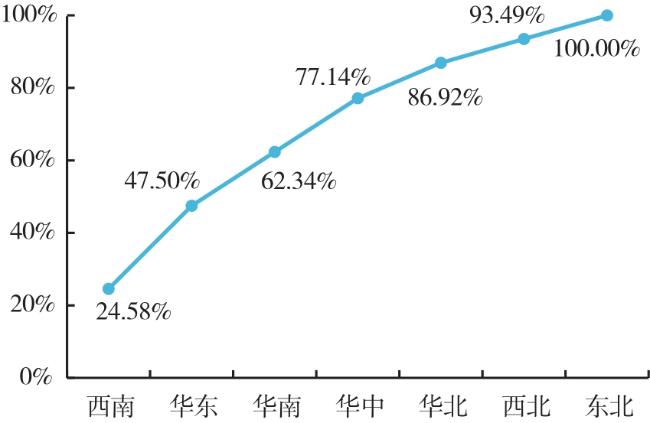
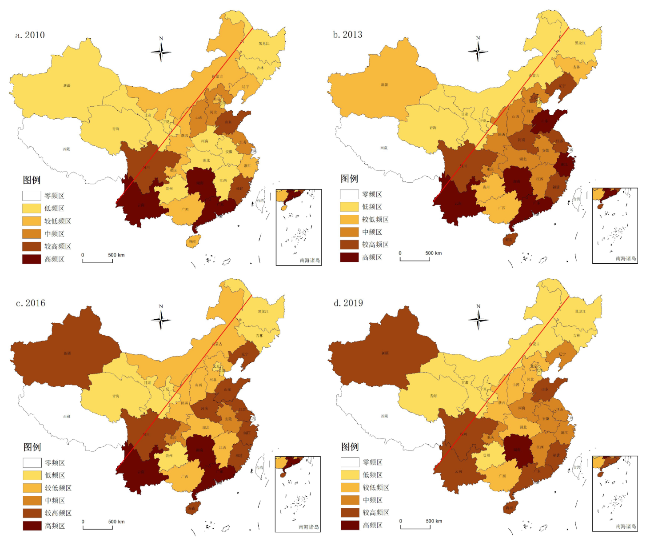
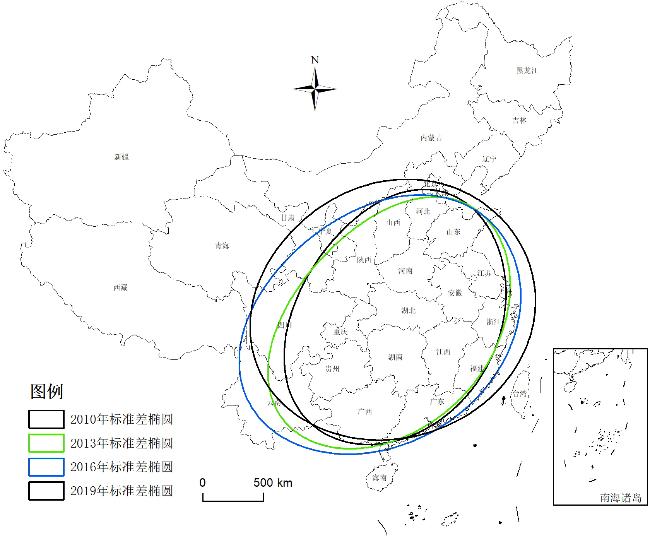
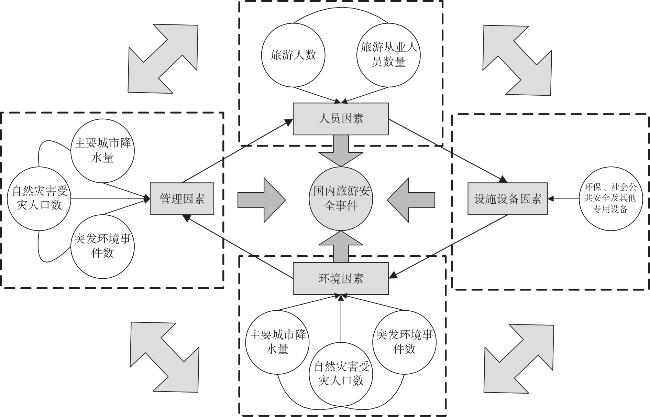
In order to reveal the spatial and temporal distribution characteristics and evolution rules of domestic tourism security events from 2010 to 2019,we employed the seasonal intensity index,geographical concentration,imbalance index,standard deviation ellipse and other methods to analyze the domestic tourism security events. Additionally,we explored the key factors that lead to the temporal and spatial differentiation of domestic tourism safety events with the help of geographic probes. The results show that: 1) the occurrence time of domestic tourism security incidents in China presents the overall volatility and distribution concentration characteristics. July and August are the months with high incidence of accidents,while spring and summer are the periods with high incidence of tourism safety incidents. 2) The high incidence of domestic tourism security incidents in China is characterized by dispersion and reduction. The events were consistent with the spatial distribution characteristics of Hu Huanyong line,that is,they were mostly in the southeast of China. From 2010 to 2019,the spatial distribution of China's domestic tourism safety incidents is relatively dispersed,with the low-frequency accident area gradually expanding and the high-frequency accident area gradually decreasing. The center of the standard deviation ellipse of China's domestic tourism security events is located in Hubei Province with tends to shift to the northeast,and the standard deviation ellipse shows an expanding trend. 3) The coupling effect of personnel,facilities,environment and management factors leads to the temporal and spatial differentiation of domestic tourism security events,among which the investment in geological disaster prevention and control,number of tourism practitioners and precipitation in major cities have great influence.
CHENG Yun , YIN Jie . Distribution and Formative Factors of Tourism Safety Incidents in China[J]. Economic geography, 2020 , 40(11) : 215 -224 . DOI: 10.15957/j.cnki.jjdl.2020.11.024
表1 2010-2019年国内旅游安全事件月度变化特征Tab.1 Monthly change characteristics of domestic tourism safety incidents from 2010 to 2019 |
| 月份 | 2010 | 2011 | 2012 | 2013 | 2014 | 2015 | 2016 | 2017 | 2018 | 2019 | 均值 |
|---|---|---|---|---|---|---|---|---|---|---|---|
| 1月 | 68 | 344 | 381 | 433 | 497 | 413 | 383 | 418 | 429 | 269 | 363.5 |
| 2月 | 173 | 443 | 304 | 518 | 578 | 386 | 357 | 557 | 350 | 326 | 399.2 |
| 3月 | 388 | 546 | 655 | 641 | 768 | 451 | 735 | 743 | 639 | 652 | 621.8 |
| 4月 | 565 | 717 | 1 190 | 903 | 824 | 793 | 899 | 755 | 899 | 708 | 825.3 |
| 5月 | 567 | 656 | 707 | 730 | 724 | 818 | 742 | 648 | 756 | 616 | 696.4 |
| 6月 | 614 | 625 | 629 | 776 | 653 | 594 | 657 | 769 | 585 | 558 | 646 |
| 7月 | 932 | 1 142 | 1 323 | 1 488 | 1 317 | 1 074 | 1 054 | 1 178 | 880 | 713 | 1 110.1 |
| 8月 | 825 | 998 | 1 134 | 1 343 | 1 110 | 1 102 | 930 | 1 311 | 901 | 856 | 1 051 |
| 9月 | 539 | 576 | 549 | 878 | 649 | 540 | 686 | 590 | 755 | 400 | 616.2 |
| 10月 | 702 | 680 | 695 | 589 | 783 | 577 | 698 | 594 | 512 | 536 | 636.6 |
| 11月 | 406 | 458 | 543 | 515 | 676 | 586 | 580 | 591 | 518 | 280 | 515.3 |
| 12月 | 322 | 307 | 472 | 572 | 447 | 451 | 361 | 448 | 438 | 12 | 383 |
表2 2010—2019年旅游安全事件的季节性强度指数Tab.2 Seasonal intensity index of domestic tourism safety incidents from 2010 to 2019 |
| 年份 | D(第一季度) | D(第二季度) | D(第三季度) | D(第四季度) | D(全年) | R值 |
|---|---|---|---|---|---|---|
| 2010 | 629 | 1 746 | 2 296 | 1 430 | 6 101 | 2.505996 |
| 2011 | 1 333 | 1 998 | 2 716 | 1 445 | 7 492 | 2.171656 |
| 2012 | 1 340 | 2 526 | 3 006 | 1 710 | 8 582 | 3.640348 |
| 2013 | 1 592 | 2 409 | 3 709 | 1 676 | 9 386 | 4.813544 |
| 2014 | 1 843 | 2 201 | 3 076 | 1 906 | 9 026 | 4.618334 |
| 2015 | 1 250 | 2 205 | 2 716 | 1 614 | 7 785 | 2.765945 |
| 2016 | 1 475 | 2 298 | 2 670 | 1 639 | 8 082 | 3.056501 |
| 2017 | 1 718 | 2 172 | 3 079 | 1 633 | 8 602 | 3.949369 |
| 2018 | 1 418 | 2 240 | 2 536 | 1 468 | 7 662 | 2.861256 |
| 2019 | 1 247 | 1 882 | 1 969 | 828 | 5 926 | 8.246758 |
注:D表示旅游安全发生事件数,R表示季节性强度指数。 |
表3 2010—2019年旅游安全事件地理集中指数Tab.3 Geographical concentration index of domestic tourism safety incidents from 2010 to 2019 |
| 年份 | 2010 | 2011 | 2012 | 2013 | 2014 | 2015 | 2016 | 2017 | 2018 | 2019 |
|---|---|---|---|---|---|---|---|---|---|---|
| 安全事件总数(起) | 6 101 | 7 492 | 8 582 | 9 386 | 9 026 | 7 785 | 8 082 | 8 602 | 7 662 | 5 926 |
| G值 | 25.067 | 25.614 | 26.583 | 25.992 | 25.681 | 25.070 | 27.049 | 26.512 | 23.121 | 21.909 |
表4 2010、2013、2016、2019年国内旅游安全事件的标准差椭圆参数Tab.4 Standard deviation elliptic parameters of domestic tourism safety incidents in 2010,2013,2016,2019 |
| 年份 | 中心坐标 | 长半轴 | 短半轴 | 方位角 | 移动方向 | 区域面积(km2) |
|---|---|---|---|---|---|---|
| 2010 | (30.716°N,112.016°E) | 10.742 | 8.028 | 50.179 | 西南 | 270.917 |
| 2013 | (30.264°N,111.616°E) | 11.595 | 7.697 | 57.116 | 西南 | 280.350 |
| 2016 | (30.232°N,110.756°E) | 12.601 | 8.757 | 68.332 | 西南 | 346.632 |
| 2019 | (31.676°N ,111.683°E) | 12.454 | 9.500 | 80.992 | 东北 | 371.676 |
表5 国内旅游安全事件的引致因子分析Tab.5 Causes of domestic tourism safety incidents |
| 一级指标 | 二级指标 | q值 | |||||||||
|---|---|---|---|---|---|---|---|---|---|---|---|
| 2010 | 2011 | 2012 | 2013 | 2014 | 2015 | 2016 | 2017 | 2018 | 均值 | ||
| 人员因素 | 旅游人数 | 0.236 | 0.117 | 0.115 | 0.157 | 0.205 | 0.092 | 0.134 | 0.176 | 0.250 | 0.165 |
| 旅游从业人员数 | - | 0.378 | 0.246 | 0.414 | 0.241 | 0.213 | 0.306 | - | - | 0.300 | |
| 设施设备因素 | 环保、社会公共安全及其他专用设备 | 0.091 | 0.118 | 0.095 | - | 0.113 | 0.079 | 0.024 | 0.024 | - | 0.076 |
| 环境因素 | 主要城市降水量 | 0.199 | 0.187 | 0.298 | 0.157 | 0.229 | 0.177 | 0.239 | 0.221 | 0.229 | 0.217 |
| 自然灾害受灾人口数 | 0.282 | 0.212 | 0.224 | 0.142 | 0.292 | 0.248 | 0.222 | 0.064 | 0.130 | 0.191 | |
| 突发环境事件数 | 0.051 | 0.095 | 0.039 | 0.064 | 0.050 | 0.165 | 0.029 | 0.057 | 0.114 | 0.077 | |
| 管理因素 | 公园和游览景区管理法人数 | 0.134 | 0.265 | 0.191 | - | 0.112 | 0.151 | 0.142 | 0.238 | - | 0.183 |
| 地质灾害防治投资 | 0.412 | 0.287 | 0.748 | 0.422 | 0.456 | 0.444 | 0.720 | 0.438 | 0.402 | 0.490 | |
| GDP | 0.119 | 0.202 | 0.121 | 0.170 | 0.139 | 0.090 | 0.042 | 0.068 | 0.229 | 0.133 | |
| [1] |
|
| [2] |
邹永广. 意识与应景:中国旅游安全政策演进特征研究[J]. 旅游学刊, 2018, 33(6):110-122.
|
| [3] |
万红莲, 张咪, 宋海龙, 等. 1990—2016年国内旅游安全研究述评[J]. 经济地理, 2018, 38(2):213-219.
|
| [4] |
|
| [5] |
邹永广, 林炜铃, 郑向敏. “驴友”旅游安全事故成因机理研究——基于扎根理论范式的质性分析[J]. 旅游科学, 2014, 28(3):76-86.
|
| [6] |
翟向坤, 韩玉灵. 大学生旅游安全风险防控[J]. 人民论坛, 2017(35):64-65.
|
| [7] |
姚延波, 侯平平. 女性旅游风险感知维度研究[J]. 消费经济, 2019, 35(3):88-96.
|
| [8] |
范云峰. 女性旅游安全需求与消费行为研究[J]. 湖北社会科学, 2011(8):95-97.
|
| [9] |
吴巧红. 老年旅游安全保障体系的构建[J]. 旅游学刊, 2015, 30(8):10-12.
|
| [10] |
陈水雄, 孙春燕, 范武波. 西沙旅游安全特征及其防范探析[J]. 生态经济, 2014, 30(1):137-140.
|
| [11] |
孙滢悦, 杨青山, 陈鹏. 长白山景区旅游安全风险动态评价研究[J]. 地理科学, 2019, 39(5):770-778.
|
| [12] |
梅诗婧, 李陇堂, 石磊, 等. 沙漠型景区旅游安全风险评价——以宁夏沙坡头景区为例[J]. 中国沙漠, 2019, 39(5):143-154.
|
| [13] |
蒙歆媛, 杨晓霞, 向旭, 等. 国内外洞穴旅游安全研究综述[J]. 中国岩溶, 2015, 34(5):529-537.
|
| [14] |
|
| [15] |
|
| [16] |
|
| [17] |
张进福, 郑向敏. 旅游安全研究[J]. 华侨大学学报:人文社科版, 2001(1):15-22.
|
| [18] |
黄锐, 谢朝武. 中国出境旅游安全事故时空分布格局及形成机制[J]. 人文地理, 2019, 34(6):120-128.
|
| [19] |
殷杰, 郑向敏. 高聚集游客群安全的影响因素与实现路径基于扎根理论的探索[J]. 旅游学刊, 2018, 33(7):133-144.
|
| [20] |
|
| [21] |
|
| [22] |
|
| [23] |
|
| [24] |
侯国林. 旅游危机:类型、影响机制与管理模型[J]. 南开管理评论, 2005(1):78-82.
|
| [25] |
谢朝武, 张俊, 陈岩英. 中国出境旅游安全风险的区域分布研究[J]. 中国安全科学学报, 2018, 28(1):155-160.
|
| [26] |
李月调, 谢朝武, 王静. 时空因素对我国赴泰旅游安全事件的影响[J]. 世界地理研究, 2017, 26(5):128-135.
|
| [27] |
朱尧, 邹永广. 中国游客赴欧洲旅游安全感知事件空间特征研究[J]. 地域研究与开发, 2019, 38(6):74-79.
|
| [28] |
周李, 吴殿廷, 李泽红, 等. 中蒙俄经济走廊自然旅游资源格局及影响因素研究[J]. 资源科学, 2018, 40(11):2168-2 176.
|
| [29] |
李东瑾, 毕华. 中国国家森林公园旅游景区空间结构研究[J]. 中国人口·资源与环境, 2016, 26(S1):274-277.
|
| [30] |
耿虹, 李彦群, 范在予. 农家乐发展的地域空间格局及其影响因素——基于浙江、湖北、四川的比较研究[J]. 经济地理, 2019, 39(11):183-193.
|
| [31] |
方叶林, 黄震方, 王坤, 等. 不同时空尺度下中国旅游业发展格局演化[J]. 地理科学, 2014, 34(9):1025-1032.
|
| [32] |
汪秋菊, 刘宇, 李新, 等. 中国主要城市旅游要素网络关注空间演化特征[J]. 世界地理研究, 2017, 26(1):45-55.
|
| [33] |
郭建科, 王绍博, 王辉, 等. 国家级风景名胜区区位优势度综合测评[J]. 经济地理, 2017, 37(1):187-195.
|
| [34] |
阮文奇, 张舒宁, 李勇泉, 等. 中国赴泰旅游需求时空分异及其影响因素[J]. 旅游学刊, 2019, 34(5):76-89.
|
| [35] |
唐承财, 孙孟瑶, 万紫微. 京津冀城市群高等级景区分布特征及影响因素[J]. 经济地理, 2019, 39(10):204-213.
|
| [36] |
邹雅真, 谢朝武. 大陆游客赴台旅游安全事件结果特征及其引致因素研究[J]. 旅游学刊, 2016, 31(8):81-89.
|
| [37] |
石飞, 刘峰贵, 李春花, 等. 基于旅游安全的川藏公路沿线自然灾害危险性分析[J]. 干旱区资源与环境, 2014, 28(7):121-126.
|
| [38] |
林炜铃, 赖思振, 邹永广. 滨海旅游地安全氛围对游客安全行为的影响机制——来自三亚和厦门的实证数据[J]. 旅游学刊, 2017, 32(2):104-116.
|
| [39] |
殷杰, 郑向敏, 董斌彬, 等. 游客高聚集场所:概念、特征、风险与研究议题[J]. 重庆工商大学学报:社会科学版, 2016, 33(2):34-41.
|
| [40] |
郭峰, 吴晋峰, 王鑫, 等. 基于SNA的西安入境旅游市场“倒二八”结构研究[J]. 人文地理, 2011, 26(5):127-132.
|
| [41] |
陈金华, 秦耀辰, 何巧华. 自然灾害对海岛旅游安全的影响研究——以平潭岛为例[J]. 未来与发展, 2007(8):62-65.
|
| [42] |
|
/
| 〈 |
|
〉 |
