
Spatial Differentiation Pattern and Its Influencing Factors of Town Economy in China:Based on 31 755 Towns' per Capita Net Income of Farmers
Received date: 2020-01-16
Revised date: 2020-07-08
Online published: 2025-04-22
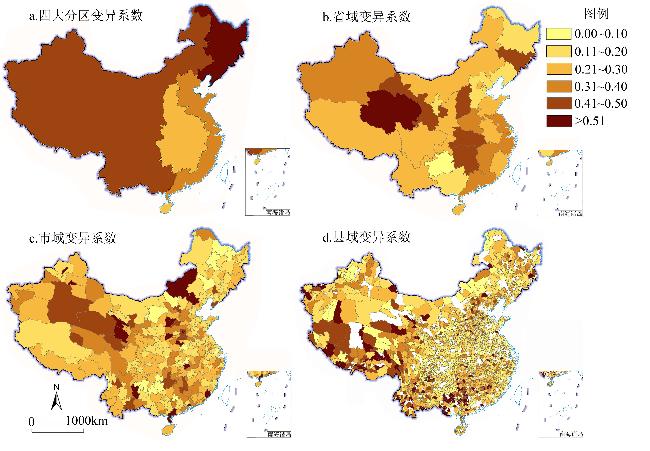
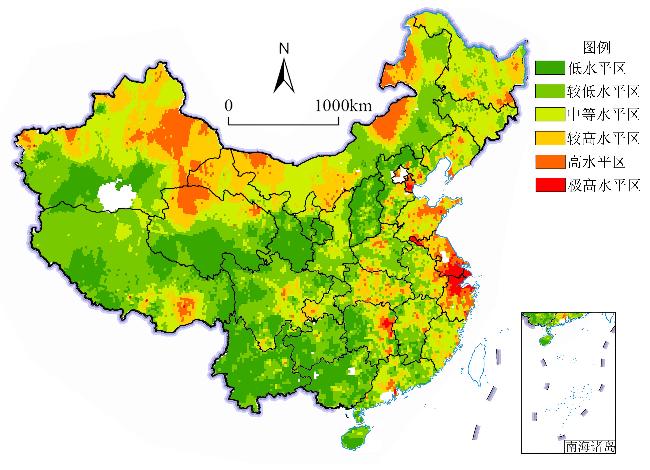
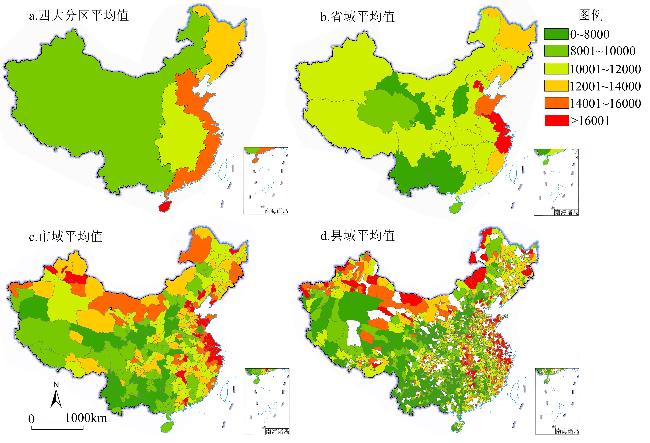
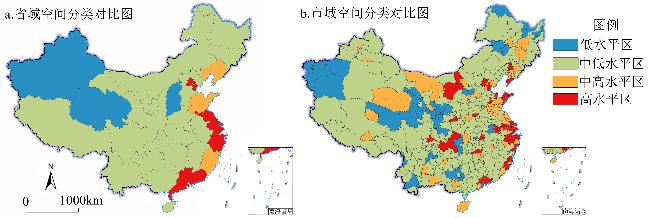
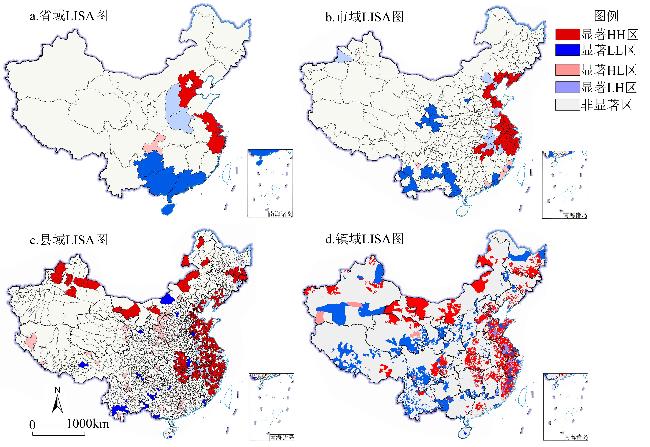
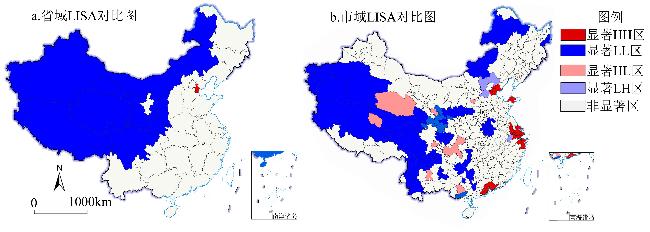
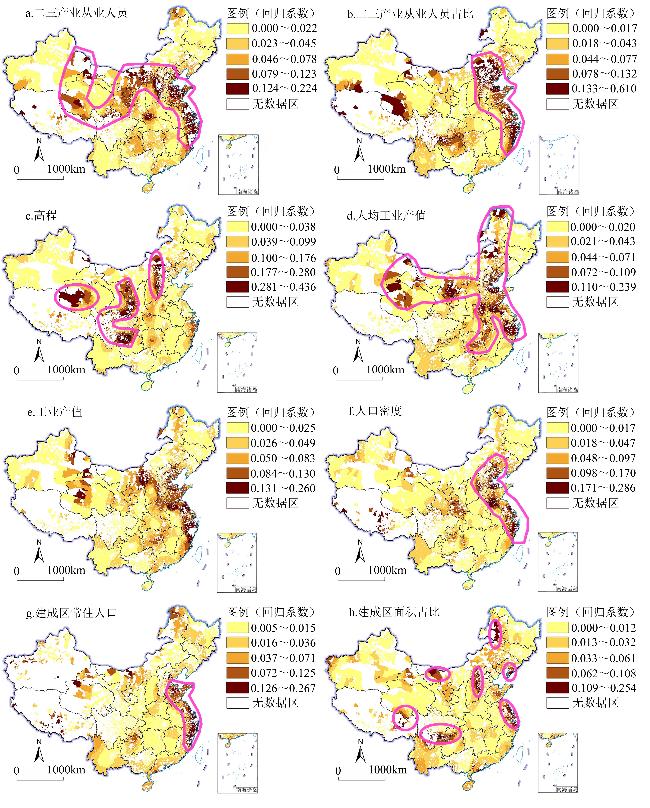
Based on the per capita net income indicator of peasants and the data of 31 755 town research units in China which were collected in 2016,the spatial pattern of China's town scale economy was analyzed by using methods including coefficient of variation,spatial classification,spatial interpolation,and spatial autocorrelation,and influencing factors were analyzed by geographic weighted regression and other methods. The results were as follows. 1) From the perspective of internal differences,the four major economic partitions were in order Northeast >West > Eastern > Central; the provincial level pattern showed the northwestern provinces were largest,the central and northeast provinces were relatively larger,the eastern coastal provinces were common,and the southwest were very small. The highest-value and higher-value areas at the city level showed the characteristics of "two core high-level cluster areas + a relatively concentrated area + speckle distribution",and the lower- value and lowest- value areas were continuously distributed. The pattern of county level was further refined than the city level,and the highest-value areas were mainly distributed in the southwest at this level. 2) From spatial distribution pattern,it was similar to the existing research conclusions,but the internal refinement and fragmentation were obvious. The highest-value and higher-value areas were mainly prominent in the core cities of Jiangsu,Zhejiang and some cities around Xinjiang and Inner Mongolia and are scattered in the central region. The low-value areas were continuously distributed in Central China,West China,Southwest China,and Northeast China,the high-value areas showed a decreasing trend from east to west in four economic partitions. High-value areas of provincial level were mainly distributed in the eastern coastal and border areas,and lowest-value areas were mainly distributed in the five provinces of Gansu,Shaanxi,Yunnan,Guizhou,and Sichuan,with the remaining areas at a middle-value level. Highest-value areas at the city and county levels were distributed along the "Xinjiang-Inner Mongolia-Heilongjiang" border in the north,along the Shandong Peninsula-Yangtze River Delta coast,and along Beijing-Guangzhou Line. 3) From the spatial correlation pattern,there was obvious spatial agglomeration phenomenon at town scale. Among them,the significant LL areas were widely distributed in the less developed regions of the provinces,and the significant HH areas were mainly distributed along the eastern coast,along the Yangtze river,and scattered in the north. 4) From the GWR model,the absolute value of the regression coefficient was ranked from large to small by the resident population in the built-up area> altitude > industrial output value> employees in the secondary and tertiary industries> proportion of employees in the secondary and tertiary industries> per capita industrial output value> population density> built-up area ratio,which indicated that only when the township economy developed to a certain stage and level can it have a good explanation relationship with industrial strength and the level of rural urbanization and industrialization.
DING Zhiwei , LIU Yingying , WU Xiaoni , WEI Yaxin , QIAO Xiaofan , ZHANG Haopeng , ZHANG Gaisu . Spatial Differentiation Pattern and Its Influencing Factors of Town Economy in China:Based on 31 755 Towns' per Capita Net Income of Farmers[J]. Economic geography, 2020 , 40(11) : 18 -28 . DOI: 10.15957/j.cnki.jjdl.2020.11.003
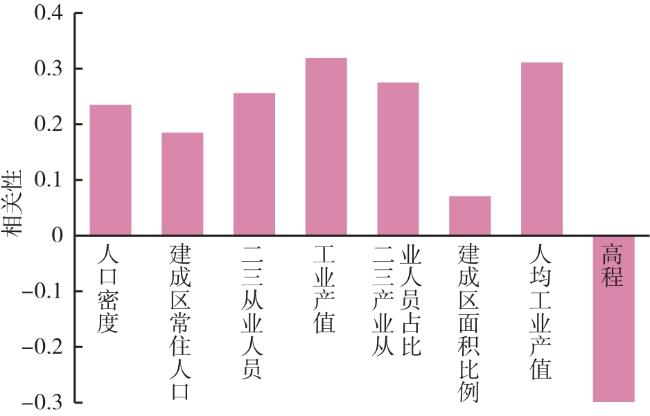
图7 基于8个变量的相关分析图注:以上相关系数在0.01水平(双侧)上显著相关。 Fig.7 Correlation analysis results based on eight variables |
表1 基于8个变量的线性回归分析表Tab.1 Linear regression analysis results based on eight variables |
| 变量 | 人口 密度 | 建成区常 住人口 | 二三产业 从业人员 | 工业 产值 | 二三产业从业 人员/从业人员 | 建成区面积/行 政区域面积 | 人均工 业产值 | 高程 |
|---|---|---|---|---|---|---|---|---|
| 回归系数 | 0.117 | -0.031 | 0.148 | 0.104 | 0.075 | -0.071 | 0.043 | -0.235 |
表2 中国镇域经济GWR模型五分位观察表Tab.2 The quintile observation explanation of China's township economy by GWR model |
| 上四分位数 | 中位数 | 下四分位数 | 最大值 | 最小值 | 平均值 | 标准差 | 显著性水平 | |
|---|---|---|---|---|---|---|---|---|
| 人口密度 | 0.0021 | 0.0156 | 0.6767 | 0.5249 | 0.0000 | 0.0410 | 0.0568 | ** |
| 人均工业产值 | 0.0079 | 0.0271 | 0.0690 | 0.5820 | 0.0000 | 0.0431 | 0.0485 | ** |
| 建成区面积比例 | 0.0023 | 0.0130 | 0.3945 | 0.3827 | 0.0000 | 0.0248 | 0.0314 | ** |
| 建成区常住人口 | 0.0037 | 0.0148 | 0.0430 | 0.9455 | 0.0000 | 0.3091 | 0.0448 | ** |
| 工业产值 | 0.0129 | 0.0323 | 0.0924 | 0.4992 | 0.0000 | 0.0532 | 0.0549 | ** |
| 高程 | 0.0037 | 0.0279 | 0.1050 | 0.8568 | 0.0000 | 0.0622 | 0.0827 | ** |
| 二三产业从业人员 | 0.0093 | 0.0279 | 0.0772 | 0.3650 | 0.0000 | 0.0479 | 0.0541 | ** |
| 二三产业从业人员占比 | 0.0037 | 0.0227 | 0.0831 | 0.6108 | 0.0000 | 0.0443 | 0.0538 | ** |
注:**为0.01显著性水平。 |
| [1] |
中国共产党中央委员会, 中华人民共和国国务院. 国家新型城镇化规划(2014—2020年)[M]. 北京: 人民出版社, 2014.
|
| [2] |
中共中央国务院. 乡村振兴战略规划(2018—2022年)[M]. 北京: 人民出版社, 2018.
|
| [3] |
中共中央国务院. 关于坚持农业农村优先发展做好“三农”工作的若干意见[M]. 北京: 人民出版社, 2019.
|
| [4] |
|
| [5] |
|
| [6] |
|
| [7] |
|
| [8] |
|
| [9] |
张静. 东营市乡镇经济社会发展的现状与对策思考[J]. 全国商情(经济理论研究), 2014(20):37.
|
| [10] |
周仕通, 魏燕. 乡镇创新经济发展路径研究——以徐州市为例[J]. 农村经济与科技, 2014, 25(9):173-176.
|
| [11] |
胡金林. 我国重点乡镇经济发展的对策研究——以湖北省为例[J]. 农业经济, 2008(9):13-15.
|
| [12] |
薛德升, 许学强, 陈浩光. 珠江三角洲镇域乡镇工业发展及其地方经济影响研究——以顺德市北窑镇为例[J]. 人文地理, 1998, 13(4):39-43.
|
| [13] |
蒋海兵, 徐建刚, 商硕. 江苏沿海乡镇经济差异的空间分析[J]. 经济地理, 2010, 30(6):998-1 004.
|
| [14] |
乔家君, 赵德华. 河南省百强镇时空演化特征及其影响环境[J]. 经济地理, 2008, 28(2):255-260,282.
|
| [15] |
魏建飞, 程迪, 丁志伟, 等. 安徽省镇域经济发展水平的时空分异及空间格局影响因素[J]. 长江流域资源与环境, 2019, 28(8):1860-1 871.
|
| [16] |
|
| [17] |
丁志伟, 黄逦茗, 谢慧钰, 等. 中原城市群镇域经济空间格局及其影响因素[J]. 经济地理, 2019, 39(11):60-68.
|
| [18] |
卢刚. 中国特大城市镇域经济研究[D]. 上海: 上海社会科学院, 2016.
|
| [19] |
丁志伟, 张改素, 王发曾. 郑州都市区镇域经济差异的空间分析[J]. 经济地理, 2013, 33(7):29-35.
|
| [20] |
|
| [21] |
蒋海兵, 徐建刚, 商硕. 盐城市乡镇经济差异空间分析[J]. 地域研究与开发, 2010, 29(1):42-48.
|
| [22] |
韩冬, 乔家君, 马玉玲. 快速工业化背景下乡村性时空分异及其演化——以河南省巩义市为例[J]. 地理研究, 2017, 36(12):2405-2 418.
|
| [23] |
杨嫚. 乡镇经济时空演变、影响因素与发展研究[D]. 开封: 河南大学, 2018.
|
| [24] |
曹昊天, 王方雄. 基于空间自相关的乡镇经济差异分析[J]. 地理空间信息, 2013, 11(4):19-20.
|
| [25] |
魏建飞, 程迪, 丁志伟, 等. 安徽省镇域经济发展水平的时空分异及空间格局影响因素[J]. 长江流域资源与环境, 2019, 28(8):1860-1 871.
|
| [26] |
丁志伟, 张改素, 康江江, 等. 基于镇域尺度的信阳经济空间格局演变及其影响因素[J]. 河南大学学报:自然科学版, 2016, 46(6):638-647.
|
| [27] |
文琦, 丁金梅, 纳静涛. 宁夏农民人均纯收入时空演进格局分析[J]. 干旱区地理, 2014, 37(3):596-600.
|
| [28] |
毛达, 黎世民, 康江江, 等. 信阳市镇域农民收入时空分异研究[J]. 河南农业科学, 2015, 44(8):165-172.
|
| [29] |
丁志伟, 康江江, 王超. 基于“市域—县域—镇域”三维尺度的信阳市经济空间格局的研究[J]. 河南科学, 2015, 33(10):1848-1 855.
|
| [30] |
李裕瑞, 尹旭. 镇域发展研究进展与展望[J]. 经济地理, 2019, 39(7):1-8.
|
| [31] |
徐建华. 计量地理学[M]. 北京: 高等教育出版社, 2006.
|
| [32] |
王洋, 修春亮. 1990—2008年中国区域经济格局时空演变[J]. 地理科学进展, 2011, 30(8):1037-1 046.
|
| [33] |
徐建华. 地理建模方法[M]. 北京: 科学出版社, 2010.
|
| [34] |
曹小曙, 徐建斌. 中国省际边界区县域经济格局及影响因素的空间异质性[J]. 地理学报, 2018, 73(6):1065-1 075.
|
| [35] |
江孝君. 中国区域经济差异的多尺度时空演化特征及驱动机制研究[D]. 长春: 东北师范大学, 2019.
|
| [36] |
|
/
| 〈 |
|
〉 |