
Urban Landscape Pattern Evolution and Prediction Based on Multi-Criteria CA-Markov Model:Take Shanghang County as an Example
Received date: 2019-04-23
Revised date: 2020-07-08
Online published: 2025-04-21
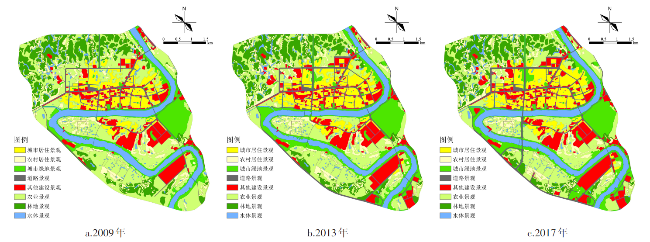
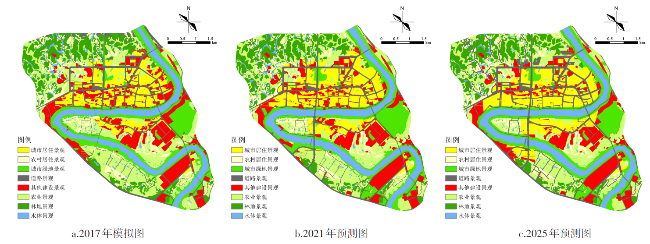
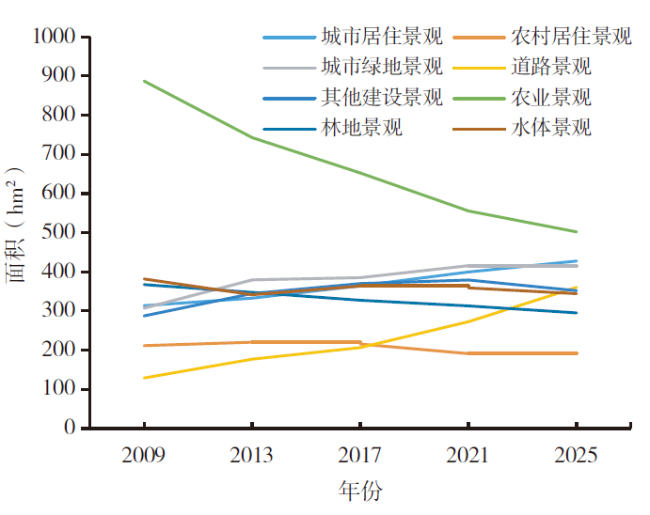
This paper takes the urban outer ring-road boundary of Shanghang county in 2020 as the research object,and takes the satellite image map of Shanghang county in 2009 and 2013,and the aerial image map of Shanghang county in 2017 as the information source. This paper analyzes the dynamic changes of landscape types in the research area,and constructs the Multi-Criterion Ca-Markov model. The results show that: 1) From 2009 to 2017, agricultural landscape has always been the dominant landscape element in the overall landscape. From the single change of dynamic attitude,the road landscape has the largest change in the past eight years, followed by other-construction landscape and agricultural landscape. From the comprehensive change of dynamic attitude, it can be seen that the total change amount of landscape area in the two research periods has decreased. From 2009 to 2013,the change rate of landscape area was faster than that of 2013 to 2017,and the change of landscape pattern in the research area had obvious stage characteristics. 2) The Multi-Criteria Ca-Markov model constructed better simulated the landscape pattern in 2017,with Kappa coefficients all above 0.75; By 2025,the urban residential landscape,other-construction landscape,urban greenland landscape in the research area show an increasing trend,while the rural residential landscape,agricultural landscape and forest landscape show a decreasing trend,and all landscape types tend to be balanced and stable in 2025. The overall fragmentation degree of landscape pattern increases,showing high heterogeneity,but the aggregation degree of landscape decreases,and the landscape distribution is more uniform. The landscape types in the study area are gradually developing towards equilibrium in landscape space.
LUO Ziwei , HU Xijun , WEI Baojing , CAO Pan , CAO Shiyi , DU Xinyu . Urban Landscape Pattern Evolution and Prediction Based on Multi-Criteria CA-Markov Model:Take Shanghang County as an Example[J]. Economic geography, 2020 , 40(10) : 58 -66 . DOI: 10.15957/j.cnki.jjdl.2020.10.007
表1 上杭县城市景观分类表Tab.1 Classification table of urban landscape of Shanghang County |
| 一级类型名称 | 代码 | 二级类型名称 | 含义 |
|---|---|---|---|
| 人工景观 | 1 | 城市居住景观 | 指城市居民的住宅小区、公寓和成片居民点,包括居住区内的道路、院落、绿化及附属设施等用地景观 |
| 2 | 农村居住景观 | 指城市周边的村落、农民自建房等,包括居住范围内的农舍、牲畜棚圈、仓库场院、道路、水渠、宅旁绿地等用地景观 | |
| 3 | 城市绿地景观 | 指城市内以人工为主的各类绿地、公园、广场等公共开放空间用地景观 | |
| 4 | 道路景观 | 指城市道路、交通设施、公共停车场等用地,不包括居住用地、工业用地等内部的道路、停车场等用地景观 | |
| 5 | 其他建设景观 | 指城市内除居住、城市绿地、道路景观以外的所有公共管理与服务景观、公用设施景观、商业服务景观、工业景观等 | |
| 半人工半自然景观 | 6 | 农业景观 | 指城市边缘区已开发或尚未开发的耕地、园地等农业用地景观 |
| 自然景观 | 7 | 林地景观 | 指城市内自然生长的林地 |
| 8 | 水体景观 | 指自然河流、小溪、池塘等 |
表4 2009—2017年上杭县城区单一景观动态度Tab.4 Change of landscape type and area in Shanghang County in 2009-2017 |
| 景观类型 | 代码 | 2009 /hm² | 2013 /hm² | 2017 /hm² | 2009—2013 变化/hm² | 2009—2013 单一动态度/% | 2013—2017 变化/hm² | 2013—2017 单一动态度/% | 2009—2017 变化/hm² | 2009—2017 单一动态度/% |
|---|---|---|---|---|---|---|---|---|---|---|
| 城市居住 | 1 | 313.64 | 332.56 | 364.27 | 18.92 | 1.51 | 31.71 | 2.38 | 50.63 | 4.04 |
| 农村居住 | 2 | 211.55 | 220.22 | 215.37 | 8.67 | 1.02 | -4.85 | -0.55 | 3.82 | 0.45 |
| 城市绿地 | 4 | 307.27 | 379.33 | 384.97 | 72.07 | 5.86 | 5.64 | 0.37 | 77.7 | 6.32 |
| 道路 | 8 | 128.95 | 176.67 | 206.40 | 47.72 | 9.25 | 29.74 | 4.21 | 77.45 | 15.02 |
| 其他建设 | 3 | 287.25 | 344.26 | 369.87 | 57.01 | 4.96 | 25.61 | 1.86 | 82.62 | 7.19 |
| 农业 | 5 | 887.09 | 742.69 | 652.47 | -144.40 | -4.07 | -90.22 | -3.04 | -234.62 | -6.61 |
| 林地 | 6 | 367.10 | 347.31 | 327.42 | -19.80 | -1.35 | -19.89 | -1.43 | -39.68 | -2.70 |
| 水体 | 7 | 381.60 | 341.41 | 363.67 | -40.19 | -2.63 | 22.26 | 1.63 | -17.93 | -1.17 |
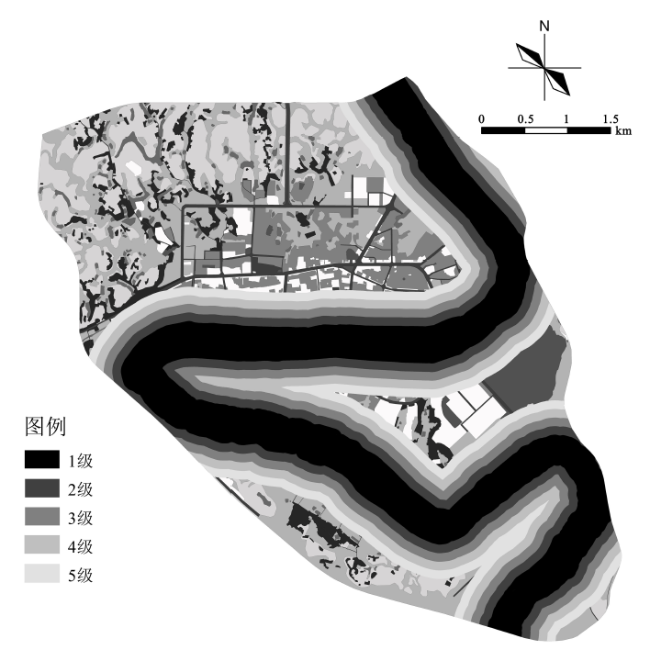
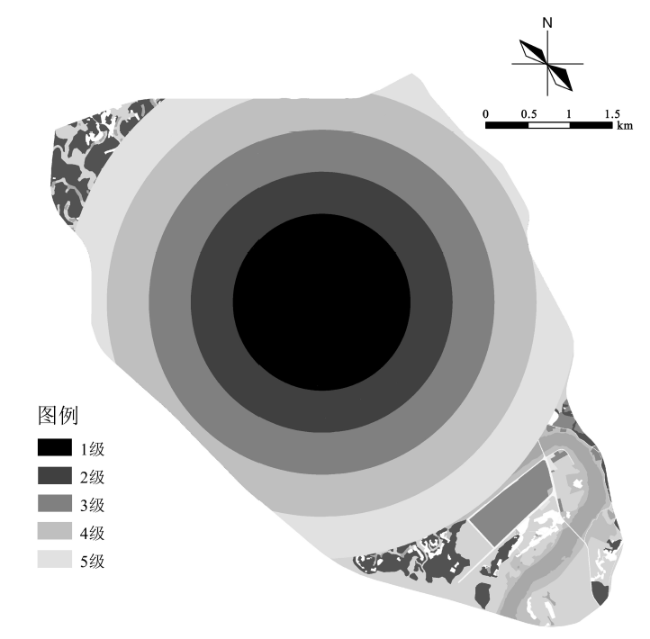
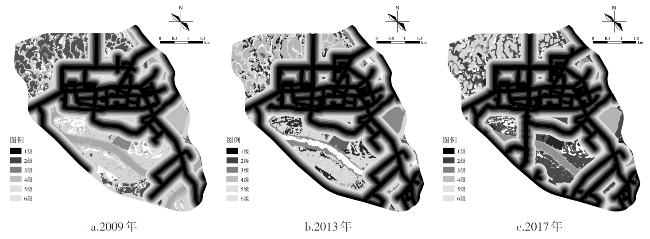
表2 转换适宜性图集约束性条件Tab.2 Conversion of suitability atlas constraints |
| 景观类型 | 汀江水系 缓冲级别 | 行政中心 缓冲级别 | 主要道路 缓冲级别 |
|---|---|---|---|
| 城市居住景观 | 2~5 | 1~3 | 1~4 |
| 农村居住景观 | - | 3~5 | - |
| 城市绿地景观 | 1 | 1~5 | - |
| 道路景观 | - | - | - |
| 其他建设景观 | 2~5 | 1~4 | 1~4 |
| 农业景观 | 1~5 | 3~5 | 1~6 |
| 林地景观 | - | - | - |
| 水体景观 | 1 | 2~5 | - |
表3 Kappa系数检验系列组Tab.3 Kappa coefficient test series group |
| 名称 | 公式 | 意义 |
|---|---|---|
| Kstandard | 以有中等保持数量的能力,没有保持空间区位的能力的 作为期望值,评价综合信息变化 | |
| Kno | 以既没有保持数量的能力,又没有保持空间区位的能力的 作为期望值,评价综合信息变化 | |
| Klocation | 以有中等保持数量的能力,没有保持空间区位的能力的 作为期望值,以既有中等保持数量的能力,又有完全保持空间区位的能力的 作为真实值,评价空间区位信息变化 | |
| KlocationStrata | 以既没有保持数量的能力,又没有保持空间区位的能力的 作为期望值,以既有中等保持数量的能力,又有完全保持空间层/区的能力的 作为真实值,评价空间区位信息变化 |
表5 2017—2021年景观类型面积转移矩阵/hm²Tab.5 Landscape type area transfer matrix in 2017-2021 |
| 2017 | 2021 | ||||||||||
|---|---|---|---|---|---|---|---|---|---|---|---|
| 城居 | 农居 | 城市绿地 | 道路 | 其他建设 | 农业 | 林地 | 水体 | 转出 | 总计 | 比例/% | |
| 城居 | 326.11 | 0.05 | 10.09 | 23.52 | 3.41 | 1.08 | 0.01 | 0.01 | 38.16 | 364.27 | 12.63 |
| 农居 | 3.45 | 179.29 | 7.79 | 11.24 | 3.89 | 9.60 | 0.11 | 0.01 | 36.08 | 215.37 | 7.47 |
| 城市绿地 | 4.26 | 0.13 | 340.85 | 5.24 | 12.39 | 2.52 | 0.04 | 19.55 | 44.13 | 384.97 | 13.35 |
| 道路 | 0.02 | 0.01 | 0.28 | 205.66 | 0.29 | 0.14 | 0.00 | 0.01 | 0.74 | 206.40 | 7.16 |
| 其他建设 | 23.48 | 0.45 | 9.68 | 5.31 | 327.16 | 3.74 | 0.03 | 0.02 | 42.71 | 369.87 | 12.82 |
| 农业 | 37.83 | 5.32 | 36.57 | 14.55 | 25.92 | 527.61 | 4.27 | 0.39 | 124.86 | 652.47 | 22.62 |
| 林地 | 1.10 | 5.03 | 0.88 | 4.23 | 2.71 | 7.97 | 305.50 | 0.00 | 21.92 | 327.42 | 11.35 |
| 水体 | 3.15 | 0.57 | 9.47 | 2.83 | 3.34 | 2.69 | 2.80 | 338.83 | 24.84 | 363.67 | 12.61 |
| 转入 | 73.28 | 11.56 | 74.76 | 66.93 | 51.93 | 27.75 | 7.25 | 19.98 | 333.44 | ||
| 总计 | 399.39 | 190.85 | 415.61 | 272.59 | 379.10 | 555.36 | 312.74 | 358.82 | 2 884.45 | ||
| 比例/% | 13.85 | 6.62 | 14.41 | 9.45 | 13.14 | 19.25 | 10.84 | 12.44 | 100 | ||
表6 2021—2025年景观类型面积转移矩阵(单位hm²)Tab.6 Landscape type area transfer matrix in 2021-2025 |
| 2021 | 2025 | ||||||||||
|---|---|---|---|---|---|---|---|---|---|---|---|
| 城居 | 农居 | 城市绿地 | 道路 | 其他建设 | 农业 | 林地 | 水体 | 转出 | 总计 | 比例/% | |
| 城居 | 359.54 | 0.01 | 0.02 | 36.12 | 0.06 | 3.64 | 0.00 | 0.00 | 39.85 | 399.39 | 13.85 |
| 农居 | 0.15 | 165.99 | 4.34 | 17.45 | 0.02 | 2.88 | 0.02 | 0.00 | 24.86 | 190.85 | 6.62 |
| 城市绿地 | 11.45 | 0.03 | 381.20 | 4.87 | 17.64 | 0.38 | 0.00 | 0.03 | 34.40 | 415.61 | 14.41 |
| 道路 | 0.04 | 0.02 | 0.01 | 272.40 | 0.04 | 0.02 | 0.00 | 0.05 | 0.18 | 272.59 | 9.45 |
| 其他建设 | 37.70 | 0.82 | 10.92 | 5.40 | 322.67 | 1.58 | 0.02 | 0.00 | 56.43 | 379.10 | 13.14 |
| 农业 | 16.10 | 5.89 | 18.57 | 12.74 | 10.36 | 490.62 | 1.08 | 0.00 | 64.74 | 555.36 | 19.25 |
| 林地 | 0.11 | 14.8 | 0.08 | 8.61 | 0.30 | 2.87 | 285.96 | 0.00 | 26.78 | 312.74 | 10.84 |
| 水体 | 2.10 | 1.67 | 0.01 | 2.74 | 0.59 | 0.01 | 7.84 | 343.87 | 14.95 | 358.82 | 12.44 |
| 转入 | 67.65 | 23.25 | 33.95 | 87.93 | 29.01 | 11.37 | 8.96 | 0.08 | 262.20 | ||
| 总计 | 427.19 | 189.24 | 415.15 | 360.33 | 351.68 | 501.99 | 294.93 | 343.95 | 2 884.45 | ||
| 比例/% | 14.81 | 6.56 | 14.39 | 12.49 | 12.19 | 17.40 | 10.22 | 11.92 | 100 | ||
表7 2009—2025年研究区景观水平指数Tab.7 Landscape level index of the research area in 2017-2025 |
| 年份 | IJI | SHEI | AI(%) | SHDI |
|---|---|---|---|---|
| 2009 | 86.42 | 0.93 | 98.91 | 1.93 |
| 2013 | 87.05 | 0.96 | 98.87 | 1.99 |
| 2017 | 87.50 | 0.97 | 98.86 | 2.02 |
| 2021 | 87.59 | 0.98 | 98.22 | 2.04 |
| 2025 | 87.64 | 0.98 | 98.46 | 2.05 |
| [1] |
院旺. 制定智慧城市发展规划的策略研究[J]. 价值工程, 2017, 36(34):207-208.
|
| [2] |
王健斐. 浅谈当前土地规划过程中存在的问题与强化对策[J]. 建材与装饰, 2017(49):62-63.
|
| [3] |
刘勇, 苏超, 徐小明. 太原市高新开发区土地利用优化配置研究[J]. 中国土地科学, 2013, 27(10):16-23,2.
|
| [4] |
|
| [5] |
|
| [6] |
张玉林. 中国的城市化与生态环境问题——“2018中国人文社会科学环境论坛”研讨述评[J]. 南京工业大学学报:社会科学版, 2019, 18(1):1-10,111.
|
| [7] |
苏洁琼, 王烜. 气候变化对湿地景观格局的影响研究综述[J]. 环境科学与技术, 2012, 35(4):74-81.
|
| [8] |
胡希军. 城市化主导的景观结构演变机制研究[D]. 长沙: 中南林业科技大学, 2006.
|
| [9] |
张冉, 王义民, 畅建霞, 等. 基于水资源分区的黄河流域土地利用变化对人类活动的响应[J]. 自然资源学报, 2019, 34(2):274-287.
|
| [10] |
朱会义, 李秀彬. 关于区域土地利用变化指数模型方法的讨论[J]. 地理学报, 2003(5):643-650.
|
| [11] |
李孝永, 匡文慧. 京津冀1980—2015年城市土地利用变化时空轨迹及未来情景模拟[J]. 经济地理, 2019, 39(3):187-194,200.
|
| [12] |
|
| [13] |
王秀兰, 包玉海. 土地利用动态变化研究方法探讨[J]. 地理科学进展, 1999(1):83-89.
|
| [14] |
张远景. 哈尔滨中心城区生态网络分析及其景观生态格局优化研究[D]. 哈尔滨: 东北农业大学, 2015.
|
| [15] |
马慧娟, 高小红, 谷晓天. 随机森林方法支持的复杂地形区土地利用/土地覆被分类研究[J]. 地球信息科学学报, 2019, 21(3):359-371.
|
| [16] |
Robert Gilmore Pontius,Marco Millones. Death to Kappa:birth of quantity disagreement and allocation disagreement for accuracy assessment[J]. International Journal of Remote Sensing, 2011, 32(15):4407-4 429.
|
/
| 〈 |
|
〉 |