
Policy-Driven,Spatial-Spillover and Revitalization of the Central Soviet Area: A Quasi-Natural Experiment of Counties Data from Jiangxi,Fujian and Guangdong
Received date: 2020-02-05
Revised date: 2020-07-04
Online published: 2025-04-21
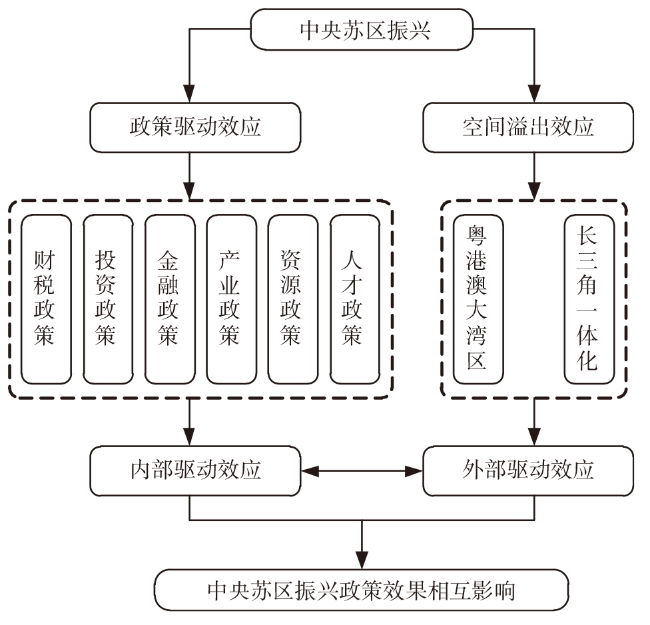
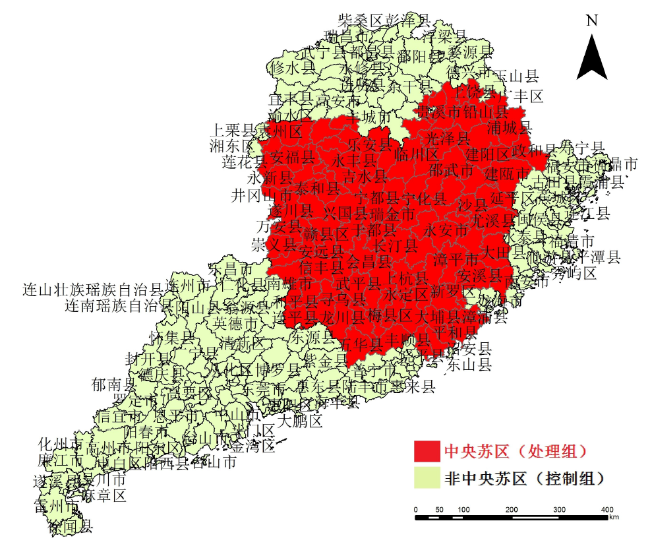
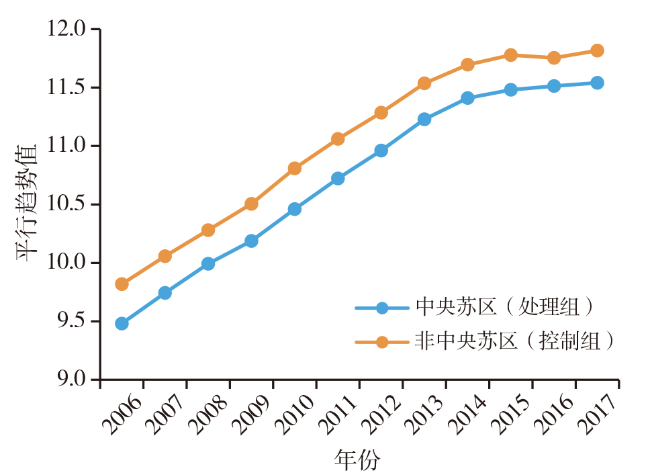
"Gratitude for the source of benefit" means that we shouldn't forget the people of old revolutionary base areas and support the development and revitalization of the central Soviet area. Based on the quasi-natural experimental environment formed by the Central Soviet Area revitalization policy in 2013,this article made a double difference test in the Central Soviet Area (City and District) of Jiangxi,Fujian,Guangdong,it was found that the revitalization of the Central Soviet Area was the result of the policy-driven effect,the spatial spillover effect of the Guangdong-Hong Kong-Macao Bay area and the Yangtze River Delta integration. Further using Difference-in-Difference-in-Difference model to control the total spillover effect,it showed that the revitalization of the Central Soviet Area was mainly the result of the spatial spillover effect; and policy driven effect promote the revitalization of the Central Soviet Area through industrial policy and talent policy. In addition,the policy-driven effect had a significant revitalization effect on the Central Soviet Area of Guangdong,while the Central Soviet Area in Jiangxi and Fujian relied mainly on the spatial spillover effect. Therefore,this article put forward four policy recommendations: strengthening the national regional development strategy and regional spillover; speeding up the docking of the national strategy the Central Soviet Area,optimizing the environment for the Central Soviet Area to undertake; formulating industrial development plans reasonably,and improving the quality of basic education; fully grasping comparative advantages of the Central Soviet Area and paying attention to precise policy implementation.
XIE Hanjin , LI Jun , LI Xin . Policy-Driven,Spatial-Spillover and Revitalization of the Central Soviet Area: A Quasi-Natural Experiment of Counties Data from Jiangxi,Fujian and Guangdong[J]. Economic geography, 2020 , 40(10) : 41 -49 . DOI: 10.15957/j.cnki.jjdl.2020.10.005
表1 主要变量描述性统计值Tab.1 Descriptive statistical value of main variable |
| 变量 | 指标含义 | 观察值 | 平均值 | 标准差 | 最小值 | 最大值 |
|---|---|---|---|---|---|---|
| lnRevenue | 地方公共财政预算收入对数 | 2 460 | 10.890 | 1.033 | 8.002 | 14.568 |
| lnExpenditure | 地方公共财政支出对数 | 2 460 | 11.881 | 0.832 | 9.524 | 14.203 |
| lnLoans | 年末金融机构各项贷款余额对数 | 2 460 | 12.922 | 1.048 | 8.672 | 16.452 |
| lnDeposits | 居民储蓄存款余额对数 | 2 460 | 13.229 | 0.893 | 10.592 | 15.967 |
| lnFirst | 第一产业增加值对数 | 2 460 | 12.036 | 0.745 | 9.807 | 14.145 |
| lnSecond | 第二产业增加值对数 | 2 460 | 12.903 | 1.026 | 9.600 | 16.297 |
| lnMiddle | 普通中学在校学生数对数 | 2 460 | 10.115 | 0.782 | 7.653 | 12.320 |
| lnPrimary | 小学在校学生数对数 | 2 460 | 10.447 | 0.791 | 6.028 | 12.758 |
| lnArea | 行政区域面积对数 | 2 460 | 7.491 | 0.533 | 4.719 | 8.643 |
| lnHospital | 医疗卫生机构床位数对数 | 2 460 | 6.940 | 0.675 | 4.812 | 9.040 |
| YRD | 长三角一体化空间溢出效应 | 2 460 | 3.393 | 2.750 | 0.061 | 9.334 |
| GHKM | 粤港澳大湾区空间溢出效应 | 2 460 | 7.799 | 2.655 | 2.365 | 11.475 |
| Effects | 总溢出效应 | 2 460 | 11.192 | 0.361 | 10.500 | 11.933 |
表2 基准回归结果Tab.2 Baseline regression result |
| 模型变量 | DID(1) lnRevenue | DID(2) lnRevenue | DID(3) lnRevenue | DID(4) lnRevenue | DID(5) lnRevenue | PSM-DID(6) lnRevenue |
|---|---|---|---|---|---|---|
| Treat·Post | 0.043(0.047) | 0.002(0.037) | 0.826(1.266) | -0.261***(0.086) | 0.105**(0.052) | 0.632(1.270) |
| Treat·Post·Effects | -0.071(0.111) | -0.055(0.111) | ||||
| Effects | 3.915***(0.476) | 3.963***(0.471) | 4.202***(0.492) | |||
| Treat·Post·YRD | -0.028***(0.010) | |||||
| YRD | 0.956***(0.103) | |||||
| Treat·Post·GHKM | 0.033***(0.105) | |||||
| GHKM | -1.203***(0.128) | |||||
| lnExpenditure | 0.373***(0.049) | 0.371***(0.049) | 0.359***(0.048) | 0.358***(0.048) | 0.372***(0.057) | |
| lnLoans | 0.138***(0.036) | 0.136***(0.036) | 0.148***(0.035) | 0.147***(0.035) | 0.172***(0.041) | |
| lnDeposits | 0.049*(0.028) | 0.049*(0.028) | 0.020(0.024) | 0.024(0.025) | 0.044(0.029) | |
| lnFirst | -0.107**(0.050) | -0.106**(0.050) | -0.107**(0.048) | -0.106**(0.049) | -0.140**(0.054) | |
| lnSecond | 0.199***(0.042) | 0.200***(0.042) | 0.187***(0.040) | 0.189***(0.040) | 0.193***(0.044) | |
| lnMiddle | 0.260***(0.048) | 0.261***(0.048) | 0.221**(0.047) | 0.229***(0.047) | 0.242***(0.051) | |
| lnPrimary | 0.030(0.031) | 0.030(0.031) | 0.014(0.030) | 0.015(0.030) | 0.026(0.044) | |
| lnArea | 0.208**(0.091) | 0.205**(0.091) | 0.198**(0.088) | 0.200**(0.089) | 0.190*(0.107) | |
| LnHospital | -0.009(0.049) | -0.008(0.049) | -0.003(0.046) | -0.003(0.046 | -0.007(0.054) | |
| 观测值 | 2 460 | 2 460 | 2 460 | 2 460 | 2 460 | 2 262 |
| R2 | 0.906 | 0.935 | 0.935 | 0.940 | 0.939 | 0.937 |
| 地区固定效应 | YES | YES | YES | YES | YES | YES |
| 时间固定效应 | YES | YES | YES | YES | YES | YES |
表3 三重差分模型结果Tab.3 Result of DDD model |
| 变量 | 第1级 | 第2级 | 第3级 | 第4级 | 第5级 | 第6级 | 第7级 | 第8级 | 第9级 | 第10级 | 第11级第12级 | 江西 | 福建 | 广东 |
|---|---|---|---|---|---|---|---|---|---|---|---|---|---|---|
| Treat1i·Postt·Treat2i | -0.169*(0.088) | -0.135*(0.080) | -0.159**(0.072) | -0.310***(0.072) | -0.356***(0.071) | -0.411***(0.069) | -0.425***(0.071) | -0.428***(0.072) | -0.312***(0.079) | -0.202*(0.117) | Omitted | -0.297***(0.060) | -0.200***(0.073) | 0.515***(0.089) |
| Treat1i·Postt | 0.020(0.039) | 0.036(0.042) | 0.066(0.046) | 0.140***(0.049) | 0.178***(0.050) | 0.210***(0.052) | 0.223***(0.058) | 0.223***(0.061) | 0.182***(0.068) | 0.146(0.111) | 0.002(0.037) | 0.075(0.048) | 0.074*(0.041) | -0.214***(0.038) |
| Treat2i·Postt | 0.147**(0.060) | 0.210***(0.062) | 0.248***(0.060) | 0.358***(0.054) | 0.389***(0.054) | 0.382***(0.054) | 0.413***(0.052) | 0.447***(0.049) | 0.336***(0.056) | 0.211***(0.064) | -3.585***(0.523) | 0.443***(0.046) | 0.021(0.061) | -0.429***(0.051) |
| 控制变量 | Control | Control | Control | Control | Control | Control | Control | Control | Control | Control | Control | Control | Control | Control |
| 观测值 | 2 460 | 2 460 | 2 460 | 2 460 | 2 460 | 2 460 | 2 460 | 2 460 | 2 460 | 2 460 | 2 460 | 2 460 | 2 460 | 2 460 |
| R2 | 0.936 | 0.937 | 0.938 | 0.940 | 0.941 | 0.942 | 0.942 | 0.944 | 0.941 | 0.937 | 0.935 | 0.943 | 0.937 | 0.943 |
| 地区固定效应 | YES | YES | YES | YES | YES | YES | YES | YES | YES | YES | YES | YES | YES | YES |
| 时间固定效应 | YES | YES | YES | YES | YES | YES | YES | YES | YES | YES | YES | YES | YES | YES |
表4 政策驱动机制检验Tab.4 Test of the policy-driven mechanism |
| 变量 | lnExpenditure | lnLoans | lnSecond | lnMiddle | lnPrimary | lnArea |
|---|---|---|---|---|---|---|
| Treat1i·Postt·Treat2i | -0.225***(0.039) | -0.124**(0.062) | 0.321**(0.149) | 0.010(0.056) | 0.165**(0.072) | -0.016*(0.009) |
| 控制变量 | Control | Control | Control | Control | Control | Control |
| 观测值 | 2 460 | 2 460 | 2 460 | 2 460 | 2 460 | 2 460 |
| R2 | 0.965 | 0.933 | 0.907 | 0.367 | 0.287 | 0.016 |
| 地区固定效应 | YES | YES | YES | YES | YES | YES |
| 时间固定效应 | YES | YES | YES | YES | YES | YES |
表5 稳健性检验Tab.5 Robustness test |
| 变量 | 提前1年 | 提前2年 | 提前3年 | 随机1次 | 随机2次 | 随机3次 |
|---|---|---|---|---|---|---|
| Treat1i·Postt·Treat2i | -0.149(0.118) | -0.075(0.119) | -0.015(0.132) | 0.021(0.117) | -0.069(0.093) | -0.106(0.084) |
| 控制变量 | Control | Control | Control | Control | Control | Control |
| 观测值 | 2 460 | 2 460 | 2 460 | 2 460 | 2 460 | 2 460 |
| 地区固定效应 | YES | YES | YES | YES | YES | YES |
| 时间固定效应 | YES | YES | YES | YES | YES | YES |
| [1] |
王景新, 郭海霞, 张羽. “苏区模范乡”建设初心与振兴之路——毛泽东《才溪乡调查》中的8村回访[J]. 西北农林科技大学学报:社会科学版, 2019, 19(4):16-27.
|
| [2] |
李质忠. 才溪中央苏区六个模范[Z]. 毛泽东才溪乡调查史料汇编, 2018.
|
| [3] |
“中国统计史研究”课题组. 毛泽东在中央苏区时期的调查研究[J]. 调研世界, 2019(11):3-13.
|
| [4] |
孙悦, 钟小明. 讲政治学理论扎基层——毛泽东端正苏区干部作风的经验启示[J]. 毛泽东邓小平理论研究, 2019(3):49-54,108.
|
| [5] |
肖文燕. 中央苏区合作社经济的策略、绩效与启示[J]. 江西财经大学学报, 2018(6):104-113.
|
| [6] |
邱小云, 彭迪云. 苏区振兴视角下产业转移、产业结构升级和经济增长——来自于赣州市的经验证据[J]. 福建论坛:人文社会科学版, 2018(2):160-165.
|
| [7] |
邱小云, 彭迪云. 原中央苏区振兴发展定位对产业转移意愿的影响研究——以赣南为例[J]. 学术论坛, 2014, 37(4):48-53.
|
| [8] |
冯裕强. 毛泽东在中央苏区的文化扶贫实践及其现实意义——基于对《毛泽东农村调查文集》的研究[J]. 毛泽东邓小平理论研究, 2018(3):80-85,108.
|
| [9] |
刘瑞明, 赵仁杰. 西部大开发:增长驱动还是政策陷阱——基于PSM-DID方法的研究[J]. 中国工业经济, 2015(6):32-43.
|
| [10] |
徐璋勇, 葛鹏飞. 国家区域发展战略与资本错配——基于西部大开发的准自然实验[J] .产业经济研究, 2019(4):12-22.
|
| [11] |
于井远, 王金秀. 区域性优惠政策有效缩小了城乡收入差距吗?——基于西部大开发的准自然实验分析[J]. 经济问题探索, 2019(8):53-65.
|
| [12] |
袁航, 朱承亮. 西部大开发推动产业结构转型升级了吗?——基于PSM-DID方法的检验[J]. 中国软科学, 2018(6):67-81.
|
| [13] |
卢飞, 刘明辉, 孙元元. “两个比照”政策是否促进了中部崛起[J]. 财贸经济, 2019, 40(1):114-127.
|
| [14] |
|
| [15] |
罗鸣令, 范子英, 陈晨. 区域性税收优惠政策的再分配效应——来自西部大开发的证据[J]. 中国工业经济, 2019(2):61-79.
|
| [16] |
毕秀晶, 宁越敏. 长三角大都市区空间溢出与城市群集聚扩散的空间计量分析[J]. 经济地理, 2013, 33(1):46-53.
|
| [17] |
罗胤晨, 谷人旭, 王春萌, 等. 县域工业集聚的空间效应分析及其影响因素——基于长江三角洲地区的实证研究[J]. 经济地理, 2015, 35(12):120-128.
|
| [18] |
朱道才, 任以胜, 徐慧敏, 等. 长江经济带空间溢出效应时空分异[J]. 经济地理, 2016, 36(6):26-33.
|
| [19] |
何天祥. 环长株潭城市群技术进步及空间溢出效应研究[J]. 经济地理, 2014, 34(5):109-115.
|
| [20] |
龙玉, 赵海龙, 张新德, 等. 时空压缩下的风险投资——高铁通车与风险投资区域变化[J]. 经济研究, 2017, 52(4):195-208.
|
| [21] |
卢盛峰, 王靖, 陈思霞. 行政中心的经济收益——来自中国政府驻地迁移的证据[J]. 中国工业经济, 2019(11):24-41.
|
| [22] |
赵建吉, 王艳华, 王珏, 等. 省直管县改革背景下地级市空间溢出效应对县域产业结构的影响[J]. 地理学报, 2020(1):1-16.
|
| [23] |
|
| [24] |
李婧, 谭清美, 白俊红. 中国区域创新生产的空间计量分析——基于静态与动态空间面板模型的实证研究[J]. 管理世界, 2010(7):43-55,65.
|
| [25] |
|
| [26] |
谭秀杰, 周茂荣. 21世纪“海上丝绸之路”贸易潜力及其影响因素——基于随机前沿引力模型的实证研究[J]. 国际贸易问题, 2015(2):3-12.
|
| [27] |
|
| [28] |
周迪, 王明哲. 改革迸活力:国家扶贫改革试验区政策的经济效应研究[J]. 中国农村观察, 2019(6):127-144.
|
| [29] |
任胜钢, 郑晶晶, 刘东华, 等. 排污权交易机制是否提高了企业全要素生产率——来自中国上市公司的证据[J]. 中国工业经济, 2019(5):5-23.
|
| [30] |
齐绍洲, 林屾, 崔静波. 环境权益交易市场能否诱发绿色创新?——基于我国上市公司绿色专利数据的证据[J]. 经济研究, 2018, 53(12):129-143.
|
| [31] |
袁华锡, 刘耀彬. 金融集聚与绿色发展——基于水平与效率的双维视角[J]. 科研管理, 2019, 40(12):126-143.
|
/
| 〈 |
|
〉 |