
Influence of "Two-Child Policy" on the Coupling Coordination Degree Between China's Population Structure and Industrial Structure
Received date: 2020-03-15
Revised date: 2020-08-31
Online published: 2025-04-21
This paper measures the population structure index and industrial structure index by establishing the index system of population structure and industrial structure. The coupling coordination model is used to analyze the interdependence and coordination between population structure and industrial structure.From the perspective of "two-child policy", the panel data model is used to analyze the influence of "two-child policy" on the coordination degree between population structure and industrial structure.The results were as followed: 1)From 2000 to 2017, China's population structure and industrial structure are quite different in different regions. The overall level of Beijing, Shanghai and Tianjin is relatively high, while other regions are still at a low level. 2)From 2000 to 2017, the population structure and industrial structure of eastern China were in the middle coordination stage, while the central and western China were in the primary coordination stage, and the coordination degree of western China was lower than that of central China. 3) From 2000 to 2015, the coupling coordination degree of the eastern and central regions increased slowly, but declined from 2016, with large regional differences. In 2017, Guizhou and Guangxi were on the verge of coordination, and 20 provinces and regions were barely coordinated. 4)The influence of "two-child policy" on the coupling coordination degree of China's population structure and industrial structure has regional heterogeneity.In the country, east, central and West,the "two-child policy" had a significant negative effect to the coupling coordination degree, that is, it reduced the coupling coordination degree between the population structure and industrial structure, but the western region was the least affected. 5)The fertility policy can be adjusted according to local conditions to improve regional population structure and pay attention to the balanced development of regional population structure and industrial structure. Promoting the matching of birth policy and industrial policy is conducive to the coordinated development of population structure and industrial structure. At the same time, it is considered whether to implement the "comprehensive three-child policy" to increase the fertility rate and cope with population aging and abrupt demographic changes.
WU Dingyu , TANG Dan , ZHANG Zhijue . Influence of "Two-Child Policy" on the Coupling Coordination Degree Between China's Population Structure and Industrial Structure[J]. Economic geography, 2020 , 40(10) : 32 -40 . DOI: 10.15957/j.cnki.jjdl.2020.10.004
表1 人口结构与产业结构的指标权重Tab.1 The index weight of population structure and industrial structure |
| 目标系统 | 一级指标 | 二级指标 | 指标类型 | 权重 |
|---|---|---|---|---|
| 人口结构( ) | 人口年龄结构 | 人口抚养比 | 负向指标 | 0.0929 |
| 0~14岁人口占总人口数比重 | 负向指标 | 0.0851 | ||
| 15~64岁人口占总人口数比重 | 正向指标 | 0.1402 | ||
| 65岁以上人口占总人口数比重 | 负向指标 | 0.0970 | ||
| 人口空间结构 | 城市化率 | 正向指标 | 0.1792 | |
| 人口文化结构 | 人均受教育年限(年/人) | 正向指标 | 0.0716 | |
| 大专及以上学历人口所占比重 | 正向指标 | 0.3340 | ||
| 产业结构( ) | 产值结构 | 第一产业增加值/GDP | 负向指标 | 0.0459 |
| 第二产业增加值/GDP | 正向指标 | 0.0630 | ||
| 第三产业增加值/GDP | 正向指标 | 0.1662 | ||
| 就业结构 | 第一产业就业人数/总就业人数 | 负向指标 | 0.0880 | |
| 第二产业就业人数/总就业人数 | 正向指标 | 0.1409 | ||
| 第三产业就业人数/总就业人数 | 正向指标 | 0.1020 | ||
| 高级化 | 第三产业增加值/第二产业增加值 | 正向指标 | 0.3543 | |
| 合理化 | 泰尔指数 | 负向指标 | 0.0397 |
表2 我国东、中、西部地区人口结构综合指数(Y1)和产业结构综合指数(Y2)Tab.2 Comprehensive index of population structure and industrial structure in eastern, central and western China |
| 年份 | 东部地区 | 中部地区 | 西部地区 | ||||||||
|---|---|---|---|---|---|---|---|---|---|---|---|
| - | - | - | |||||||||
| 2000 | 0.3143 | 0.5050 | -0.1906 | 0.2426 | 0.3638 | -0.1212 | 0.1692 | 0.3101 | -0.1409 | ||
| 2001 | 0.3246 | 0.5113 | -0.1868 | 0.2667 | 0.3693 | -0.1026 | 0.1899 | 0.3051 | -0.1152 | ||
| 2002 | 0.5247 | 0.5213 | 0.0034 | 0.4872 | 0.3770 | 0.1102 | 0.4021 | 0.3157 | 0.0864 | ||
| 2003 | 0.5317 | 0.5288 | 0.0029 | 0.5169 | 0.3873 | 0.1296 | 0.4154 | 0.3220 | 0.0934 | ||
| 2004 | 0.5500 | 0.5367 | 0.0133 | 0.5284 | 0.3960 | 0.1324 | 0.4291 | 0.3254 | 0.1037 | ||
| 2005 | 0.5630 | 0.5498 | 0.0132 | 0.4993 | 0.4031 | 0.0962 | 0.4055 | 0.3300 | 0.0755 | ||
| 2006 | 0.5795 | 0.5605 | 0.0190 | 0.5205 | 0.4110 | 0.1095 | 0.4225 | 0.3354 | 0.0871 | ||
| 2007 | 0.5881 | 0.5741 | 0.0140 | 0.5280 | 0.4205 | 0.1075 | 0.4283 | 0.3444 | 0.0839 | ||
| 2008 | 0.5872 | 0.5806 | 0.0066 | 0.5373 | 0.4232 | 0.1141 | 0.4353 | 0.3501 | 0.0852 | ||
| 2009 | 0.6014 | 0.5923 | 0.0091 | 0.5422 | 0.4351 | 0.1071 | 0.4572 | 0.3699 | 0.0873 | ||
| 2010 | 0.6097 | 0.6010 | 0.0087 | 0.5558 | 0.4342 | 0.1216 | 0.4757 | 0.3628 | 0.1129 | ||
| 2011 | 0.6307 | 0.6087 | 0.0220 | 0.5648 | 0.4386 | 0.1262 | 0.5064 | 0.3717 | 0.1347 | ||
| 2012 | 0.6379 | 0.6171 | 0.0208 | 0.5753 | 0.4532 | 0.1221 | 0.5022 | 0.3741 | 0.1281 | ||
| 2013 | 0.6408 | 0.6325 | 0.0083 | 0.5793 | 0.4703 | 0.1090 | 0.5098 | 0.3953 | 0.1145 | ||
| 2014 | 0.6342 | 0.6379 | -0.0037 | 0.5850 | 0.4832 | 0.1018 | 0.5139 | 0.4086 | 0.1053 | ||
| 2015 | 0.6358 | 0.6476 | -0.0118 | 0.5767 | 0.5016 | 0.0751 | 0.5180 | 0.4255 | 0.0925 | ||
| 2016 | 0.4855 | 0.6551 | -0.1696 | 0.3962 | 0.5147 | -0.1185 | 0.3613 | 0.4361 | -0.0748 | ||
| 2017 | 0.4934 | 0.6626 | -0.1692 | 0.3817 | 0.5251 | -0.1434 | 0.3609 | 0.4530 | -0.0921 | ||
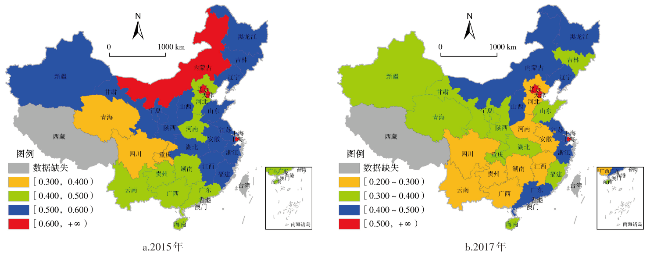
图1 2015、2017年人口结构综合指数水平空间分布Fig.1 Spatial differences on comprehensive index of population structure in 2015 and 2017 |
表3 人口结构与产业结构耦合协调度Tab.2 Degree of coupling and coordination between population structure and industrial structure |
| 年份 | 东部地区 | 中部地区 | 西部地区 | |||||
|---|---|---|---|---|---|---|---|---|
| 耦合(C) | 协调(D) | 耦合(C) | 协调(D) | 耦合(C) | 协调(D) | |||
| 2000 | 0.9726 | 0.6312 | 0.9798 | 0.5451 | 0.9558 | 0.4786 | ||
| 2001 | 0.9747 | 0.6383 | 0.9869 | 0.5602 | 0.9725 | 0.4906 | ||
| 2002 | 1.0000 | 0.7232 | 0.9918 | 0.6547 | 0.9927 | 0.5969 | ||
| 2003 | 1.0000 | 0.7282 | 0.9897 | 0.6689 | 0.9919 | 0.6048 | ||
| 2004 | 0.9999 | 0.7371 | 0.9897 | 0.6763 | 0.9905 | 0.6113 | ||
| 2005 | 0.9999 | 0.7459 | 0.9943 | 0.6698 | 0.9947 | 0.6048 | ||
| 2006 | 0.9999 | 0.7549 | 0.9931 | 0.6801 | 0.9934 | 0.6135 | ||
| 2007 | 0.9999 | 0.7623 | 0.9936 | 0.6864 | 0.9941 | 0.6197 | ||
| 2008 | 1.0000 | 0.7641 | 0.9929 | 0.6905 | 0.9941 | 0.6248 | ||
| 2009 | 1.0000 | 0.7725 | 0.9940 | 0.6969 | 0.9944 | 0.6413 | ||
| 2010 | 1.0000 | 0.7781 | 0.9924 | 0.7009 | 0.9909 | 0.6445 | ||
| 2011 | 0.9998 | 0.7872 | 0.9921 | 0.7055 | 0.9882 | 0.6587 | ||
| 2012 | 0.9999 | 0.7921 | 0.9929 | 0.7146 | 0.9893 | 0.6584 | ||
| 2013 | 1.0000 | 0.7979 | 0.9946 | 0.7225 | 0.9920 | 0.6700 | ||
| 2014 | 1.0000 | 0.7975 | 0.9954 | 0.7292 | 0.9935 | 0.6769 | ||
| 2015 | 1.0000 | 0.8010 | 0.9976 | 0.7334 | 0.9952 | 0.6852 | ||
| 2016 | 0.9889 | 0.7510 | 0.9915 | 0.6720 | 0.9956 | 0.6300 | ||
| 2017 | 0.9892 | 0.7561 | 0.9874 | 0.6691 | 0.9936 | 0.6359 | ||
表4 二孩政策对人口结构和产业结构耦合协调性的影响结果Tab.4 The impact of the two-child policy on the coordination of population structure and industrial structure |
| 变量 | 全国 | 东部 | 中部 | 西部 |
|---|---|---|---|---|
| D1 | 0.00698(0.00742) | -0.0166*(0.00947) | 0.00340(0.0143) | 0.0209(0.0174) |
| D2 | -0.0903***(0.00763) | -0.0976***(0.0113) | -0.0981***(0.0174) | -0.0669***(0.0217) |
| PGDP | 0.0279*(0.0164) | 0.0573**(0.0234) | -0.115***(0.0341) | -0.0049(0.0317) |
| EC | -0.00150(0.00223) | -0.00926(0.0437) | -0.0421(0.0659) | 0.00308(0.00368) |
| GEC | 0.0190(0.0177) | 0.0736***(0.0216) | 0.00506(0.0379) | 0.0230(0.0367) |
| PR&D | 0.0472***(0.0116) | 0.0796***(0.0184) | 0.0887***(0.0250) | 0.0215(0.0237) |
| INS | 0.189***(0.0261) | 0.157***(0.0363) | 0.516***(0.0508) | 0.269***(0.0480) |
| FDI | 0.0325***(0.00506) | 0.0136*(0.00746) | 0.0430***(0.00900) | 0.0483***(0.0114) |
| INV | -0.00667(0.0148) | -0.00144(0.0187) | 0.0348(0.0248) | 0.0176(0.0279) |
| Constant | -1.347***(0.112) | -1.193***(0.173) | -0.793***(0.218) | -1.552***(0.239) |
| Observations | 540 | 198 | 144 | 198 |
| Number of pro | 30 | 11 | 8 | 11 |
| R-squared | 0.667 | 0.814 | 0.799 | 0.680 |
注:***p<0.01,**p<0.05,*p<0.1,括号内数据为统计量的标准误差。 |
| [1] |
|
| [2] |
汪伟. 经济增长、 人口结构变化与中国高储蓄[J]. 经济学(季刊), 2010, 9(1):29-52.
|
| [3] |
周战超. 中国人口老龄化问题研究[J]. 经济社会体制比较, 2007(1):121-125.
|
| [4] |
李新运, 徐瑶玉, 吴学锰. “单独二孩”政策对我国人口自然变动的影响预测[J]. 经济与管理评论, 2014, 30(5):47-53.
|
| [5] |
风笑天. “单独二孩”生育政策调整的社会影响前瞻[J]. 国家行政学院学报, 2014(5):57-62.
|
| [6] |
邓爽, 刘杰, 贺雪娇. 我国实施“全面二孩”生育政策的利弊分析[J]. 产业与科技论坛, 2016, 15(4):7-8.
|
| [7] |
翟振武, 张现苓, 靳永爱. 立即全面放开二胎政策的人口学后果分析[J]. 人口研究, 2014, 38(2):3-17.
|
| [8] |
陈彦斌, 郭豫媚, 姚一旻. 人口老龄化对中国高储蓄的影响[J] .金融研究, 2014(1):71-84.
|
| [9] |
|
| [10] |
蔡昉, 王美艳. 中国人力资本现状管窥——人口红利消失后如何开发增长新源泉[J]. 人民论坛·学术前沿, 2012(4):56-65,71.
|
| [11] |
童玉芬. 人口老龄化过程中我国劳动力供给变化特点及面临的挑战[J]. 人口研究, 2014, 38(2):52-60.
|
| [12] |
陈敦贤. 中国人口老龄化与产业结构调整[J]. 中南财经政法大学学报, 2002(3):60-63,113.
|
| [13] |
程开明. 城市化与经济增长的互动机制及理论模型述评[J]. 经济评论, 2007(4):144-151.
|
| [14] |
江小涓, 李辉. 服务业与中国经济:相关性和加快增长的潜力[J]. 经济研究, 2004(1):4-15.
|
| [15] |
陈立泰, 侯娟娟. 服务业集聚与城市化的互动关系:1997—2009[J]. 西北人口, 2012(3):86-90.
|
| [16] |
|
| [17] |
舒燕飞. 我国城市化发展水平及东西部差异[J]. 城市问题, 2009(2):45-50.
|
| [18] |
李诚固, 韩守庆, 郑文升. 城市产业结构升级的城市化响应研究[J]. 城市规划, 2004(4):31-36.
|
| [19] |
陈立俊, 王克强. 中国城市化发展与产业结构关系的实证分析[J]. 中国人口·资源与环境, 2010, 20(S1):17-20.
|
| [20] |
陈立泰, 刘艺. 中国产业结构变迁对城市化发展的影响——基于省级面板数据的实证研究[J]. 经济问题探索, 2013(8):61-66.
|
| [21] |
李志翠, 朱琳, 张学东. 产业结构升级对中国城市化进程的影响——基于1978—2010年数据的检验[J]. 城市发展研究, 2013, 20(10):35-40.
|
| [22] |
|
| [23] |
靳卫东. 人力资本与产业结构转化的动态匹配效应——就业、增长和收入分配问题的评述[J]. 经济评论, 2010(6):137-142.
|
| [24] |
方大春, 张凡. 人口结构与产业结构耦合协调关系研究[J]. 当代经济管理, 2016, 38(9):54-60.
|
| [25] |
范洪敏, 穆怀中. 中国人口结构与产业结构耦合分析[J]. 经济地理, 2015, 35(12):11-17.
|
| [26] |
周海生, 战炤磊. 人口结构和产业结构的互动影响与协调思路——以南京市为例[J]. 技术经济与管理研究, 2013(2):107-110.
|
| [27] |
何海林, 涂建军, 孙祥龙, 等. 中国人口结构与经济结构耦合的关联分析[J]. 西南大学学报:自然科学版, 2013, 35(10):140-145.
|
| [28] |
曹绪奇, 王蒲生. 深圳产业结构与人口结构相关性分析——同上海的对比[J]. 经济与社会发展, 2009, 7(4):79-82.
|
| [29] |
梁树广, 吕晓, 张延辉. 人口结构与产业机构转型升级耦合演进的时空特征——基于中国时间序列与31个省份面板数据的灰色关联分析[J]. 经济体制改革, 2019(2):54-61.
|
| [30] |
晏月平, 廖爱娣. 人口结构与产业结构协调发展的研究综述[J]. 渤海大学学报:哲学社会科学版, 2015(37):62-66.
|
| [31] |
方大春, 张凡. 人口结构与产业结构耦合的经济效应实证分析[J]. 兰州财经大学学报, 2017, 33(2):1-10.
|
| [32] |
黄木易, 程志光. 区域城市化与社会经济耦合协调发展度的时空特征分析——以安徽省为例[J]. 经济地理, 2012, 32(2):77-81.
|
| [33] |
高远东, 张卫国, 阳琴. 中国产业结构高级化的影响因素研究[J]. 经济地理, 2015, 35(6):98-103,110.
|
| [34] |
张军, 吴桂英, 张吉鹏. 中国省际物质资本存量估算:1952—2000[J]. 经济研究, 2004(10):35-44.
|
/
| 〈 |
|
〉 |