
Spatio-Temporal Evolution of Rural Development Capacity of Jianghan Plain from the Perspective of Regional Major Function
Received date: 2018-04-12
Revised date: 2018-10-27
Online published: 2025-04-20
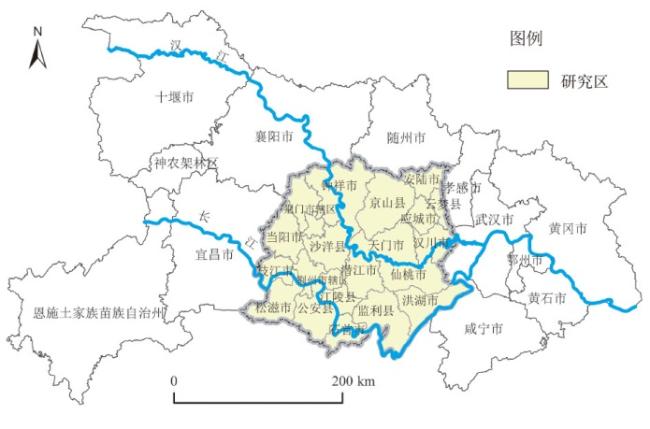
The rural development is facing severe challenges in the background of socio-economic transformation. Promoting the rural development capacity is the foundation for rural revitalization and plays a more essential role in rural sustainable development of the main agricultural production regions. Taking Jianghan Plain as research area, this article divides the rural development capacity into exogenous driving capacity and endogenous response capacity, constructs its evaluation index system which is composed of urbanization, industrialization, marketization and globalization, and analyzes its spatial and temporal evolution from 2005 to 2014. The results show that: 1) As a whole, the rural development capacity of Jianghan Plain shows the growth trend from 2005 to 2014 and obvious spatial agglomeration and differentiation between its west and east. 2) The major component of the rural development capacity in Jianghan Plain is exogenous driving capacity which is mostly derived by urbanization. 3) On the base of the ratio of endogenous response capacity to exogenous driving capacity, regional development of Jianghan Plain has been classified into three types, including exogenous driving area, endogenous driving area and balance area. Furthermore, at present, the primarily type in Jianghan Plain is the exogenous driving area. At the same time, the counties show good potential for achieving higher rural development capacity. Eventually, these results can provide theoretical guidance for the achievement of rural revitalization and the basis for formulating the policy for the rural sustainable development of Jianghan Plain.
ZHUO Rongrong , YU Bin , ZENG Juxin , GUO Xinwei , LI Ruirui . Spatio-Temporal Evolution of Rural Development Capacity of Jianghan Plain from the Perspective of Regional Major Function[J]. Economic geography, 2019 , 39(5) : 171 -180 . DOI: 10.15957/j.cnki.jjdl.2019.05.020
表1 农产品主产区乡村发展能力指标选择及评价体系Tab.1 The index system for the assessment of rural development capacity in main agricultural production regions |
| 系统层 | 子系统层 | 指标层 | 指标性质 | 指标释义 |
|---|---|---|---|---|
| 乡村发 展能力 | 外源驱 动能力 | 城镇人口数量 | + | 城镇人口占比=城镇人口数/县域常住人口总数 |
| 城镇人口占比 | + | |||
| 第二产业增加值 | + | 第二产业增加值占比=第二产业增加值/GDP | ||
| 第二产业增加值占比 | + | |||
| 实际利用外资 | + | 实际利用外资占比=实际利用外资总额/农业固定资产投资总额 | ||
| 实际利用外资占比 | + | |||
| 第三产业从业人员数量 | + | 第三产业从业人员占比=第三产业从业人员数/年末全社会从业人员总数 | ||
| 第三产业从业人员占比 | + | |||
| 内生响 应能力 | 农村耕地面积 | + | 农村人均耕地面积=农村耕地面积/农村常住人口总数 | |
| 农村人均耕地面积 | + | |||
| 农业机械总动力 | + | 地均农业机械动力=农业机械总动力/农村耕地面积 | ||
| 地均农业机械动力 | + | |||
| 农产品出口额 | + | 农产品出口额占比=农产品出口额/农业总产值 | ||
| 农产品出口额占比 | ||||
| 农林牧渔服务业增加值占比(%) | + | 农林牧渔服务业增加值占比=农林牧渔服务业增加值/第一产业增加值 | ||
| 农村居民人均消费性支出(元) | + |
表2 2005—2014年江汉平原分县市乡村发展能力指数及变化Tab.2 The changes of rural development capacity in counties of Jianghan Plain from 2005 to 2014 |
| 2005 | 2006 | 2007 | 2008 | 2009 | 2010 | 2011 | 2012 | 2013 | 2014 | |
|---|---|---|---|---|---|---|---|---|---|---|
| 江陵县 | 0.121 | 0.129 | 0.141 | 0.166 | 0.185 | 0.263 | 0.286 | 0.321 | 0.321 | 0.339 |
| 安陆市 | 0.170 | 0.189 | 0.204 | 0.221 | 0.238 | 0.300 | 0.333 | 0.353 | 0.373 | 0.395 |
| 云梦县 | 0.151 | 0.170 | 0.190 | 0.206 | 0.221 | 0.291 | 0.322 | 0.346 | 0.370 | 0.401 |
| 应城市 | 0.255 | 0.259 | 0.275 | 0.277 | 0.300 | 0.355 | 0.366 | 0.389 | 0.405 | 0.438 |
| 石首市 | 0.224 | 0.251 | 0.262 | 0.302 | 0.312 | 0.357 | 0.389 | 0.392 | 0.417 | 0.440 |
| 洪湖市 | 0.219 | 0.224 | 0.254 | 0.283 | 0.269 | 0.342 | 0.380 | 0.405 | 0.437 | 0.460 |
| 当阳市 | 0.218 | 0.235 | 0.275 | 0.281 | 0.286 | 0.368 | 0.387 | 0.425 | 0.448 | 0.483 |
| 沙洋县 | 0.174 | 0.196 | 0.217 | 0.274 | 0.269 | 0.356 | 0.378 | 0.439 | 0.463 | 0.496 |
| 公安县 | 0.227 | 0.241 | 0.270 | 0.288 | 0.298 | 0.373 | 0.406 | 0.449 | 0.478 | 0.506 |
| 松滋市 | 0.174 | 0.192 | 0.250 | 0.272 | 0.284 | 0.348 | 0.381 | 0.422 | 0.471 | 0.515 |
| 枝江市 | 0.256 | 0.279 | 0.297 | 0.316 | 0.336 | 0.397 | 0.409 | 0.443 | 0.488 | 0.525 |
| 监利县 | 0.305 | 0.325 | 0.336 | 0.367 | 0.387 | 0.458 | 0.494 | 0.522 | 0.558 | 0.592 |
| 汉川市 | 0.280 | 0.331 | 0.356 | 0.394 | 0.429 | 0.476 | 0.499 | 0.531 | 0.564 | 0.596 |
| 潜江市 | 0.355 | 0.374 | 0.399 | 0.454 | 0.427 | 0.496 | 0.570 | 0.574 | 0.611 | 0.650 |
| 京山县 | 0.268 | 0.302 | 0.337 | 0.396 | 0.438 | 0.504 | 0.537 | 0.567 | 0.613 | 0.658 |
| 天门市 | 0.382 | 0.395 | 0.425 | 0.476 | 0.530 | 0.603 | 0.627 | 0.660 | 0.690 | 0.715 |
| 钟祥市 | 0.339 | 0.361 | 0.428 | 0.448 | 0.478 | 0.590 | 0.639 | 0.666 | 0.692 | 0.726 |
| 仙桃市 | 0.391 | 0.415 | 0.444 | 0.477 | 0.516 | 0.556 | 0.623 | 0.661 | 0.714 | 0.749 |
| 平均值 | 0.250 | 0.270 | 0.298 | 0.328 | 0.345 | 0.413 | 0.446 | 0.476 | 0.506 | 0.538 |
| 标准差 | 0.080 | 0.083 | 0.087 | 0.095 | 0.103 | 0.104 | 0.112 | 0.112 | 0.119 | 0.123 |
| 变异系数 | 0.318 | 0.306 | 0.294 | 0.289 | 0.300 | 0.251 | 0.251 | 0.235 | 0.235 | 0.228 |
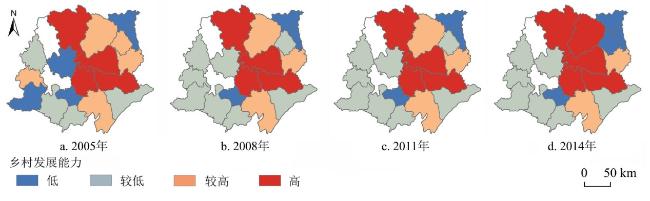
表3 2005—2014年江汉平原乡村发展能力分级县市数量及变化Tab.3 The changes of the classifications of rural development capacity in counties of Jianghan Plain from 2005 to 2014 |
| 乡村发展能力 | 2005 | 2008 | 2011 | 2014 | ||||
|---|---|---|---|---|---|---|---|---|
| 数量/个 | 占比/% | 数量/个 | 占比/% | 数量/个 | 占比/% | 数量/个 | 占比/% | |
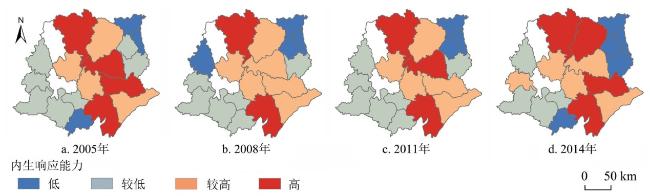
| 高 | 4 | 22 | 4 | 22 | 4 | 22 | 5 | 28 |
| 较高 | 5 | 28 | 3 | 17 | 3 | 17 | 2 | 11 |
| 较低 | 4 | 22 | 8 | 44 | 8 | 44 | 7 | 39 |
| 低 | 5 | 28 | 3 | 17 | 3 | 17 | 4 | 22 |
| 合计 | 18 | 100 | 18 | 100 | 18 | 100 | 18 | 100 |
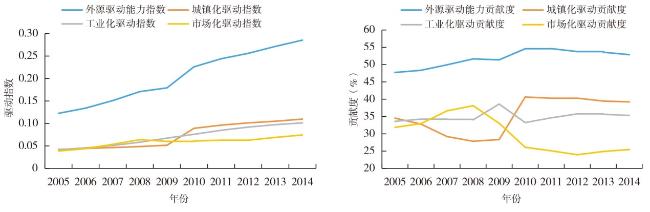
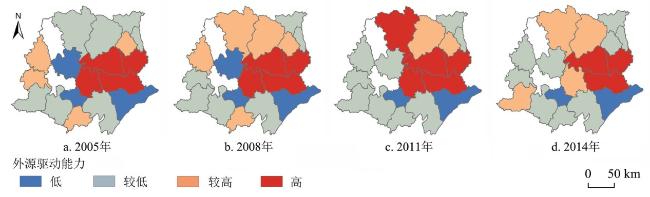
图3 江汉平原乡村外源驱动能力及其组分贡献度变化曲线Fig.3 The trends of driving index and contribution degree in exogenous driving capacity of Jianghan Plain and its components |
表4 2005—2014年间江汉平原乡村外源驱动能力各指标贡献度(单位:%)Tab.4 Contribution degree of exogenous driver capacity in rural development capacity of Jianghan Plain from 2005 to 2014 |
| 2005 | 2006 | 2007 | 2008 | 2009 | 2010 | 2011 | 2012 | 2013 | 2014 | |
|---|---|---|---|---|---|---|---|---|---|---|
| 城镇人口数量 | 0.103 | 0.153 | 0.199 | 0.153 | 0.143 | 0.090 | 0.160 | 0.193 | 0.116 | 0.140 |
| 城镇人口占比 | 0.240 | 0.186 | 0.220 | 0.252 | 0.210 | 0.188 | 0.190 | 0.188 | 0.267 | 0.211 |
| 第二产业增加值 | 0.069 | 0.082 | 0.098 | 0.050 | 0.118 | 0.069 | 0.073 | 0.129 | 0.086 | 0.116 |
| 第二产业增加值占比 | 0.256 | 0.265 | 0.201 | 0.220 | 0.272 | 0.331 | 0.240 | 0.201 | 0.309 | 0.284 |
| 第三产业从业人员数量 | 0.136 | 0.182 | 0.173 | 0.181 | 0.129 | 0.132 | 0.139 | 0.190 | 0.102 | 0.119 |
| 第三产从业人员占比 | 0.196 | 0.132 | 0.109 | 0.143 | 0.128 | 0.191 | 0.198 | 0.100 | 0.120 | 0.130 |
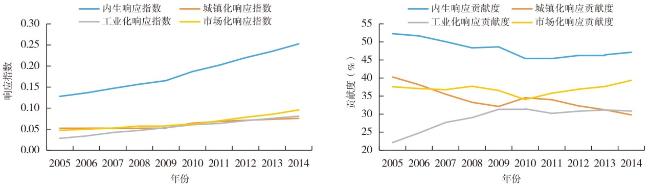
图5 江汉平原乡村内生响应能力及其组分变化曲线Fig.5 The trends of response index and contribution degree in endogenous response capacity of Jianghan Plain and its components |
表5 2005—2014年间江汉平原乡村内生响应能力各指标贡献度(单位:%)Tab.5 Contribution degree of endogenous response capacity in rural development capacity of Jianghan Plain from 2005 to 2014 |
| 2005 | 2006 | 2007 | 2008 | 2009 | 2010 | 2011 | 2012 | 2013 | 2014 | |
|---|---|---|---|---|---|---|---|---|---|---|
| 农村耕地面积 | 0.150 | 0.218 | 0.249 | 0.199 | 0.102 | 0.121 | 0.206 | 0.152 | 0.034 | 0.089 |
| 农村人均耕地面积 | 0.315 | 0.202 | 0.207 | 0.287 | 0.148 | 0.185 | 0.186 | 0.114 | 0.139 | 0.110 |
| 农业机械总动力 | 0.076 | 0.120 | 0.149 | 0.120 | 0.136 | 0.093 | 0.134 | 0.192 | 0.051 | 0.176 |
| 地均农业机械动力 | 0.155 | 0.126 | 0.114 | 0.087 | 0.195 | 0.153 | 0.127 | 0.192 | 0.294 | 0.267 |
| 农林牧渔服务业增加值占比 | 0.092 | 0.181 | 0.172 | 0.201 | 0.311 | 0.301 | 0.209 | 0.245 | 0.206 | 0.202 |
| 农村居民人均消费性支出 | 0.212 | 0.153 | 0.110 | 0.107 | 0.108 | 0.147 | 0.138 | 0.104 | 0.276 | 0.156 |
表6 2005—2014年间江汉平原乡村发展能力均衡度指数Tab.6 Equilibrium index of the rural development capacity in Jianghan Plain from 2005 to 2014 |
| 2005 | 2006 | 2007 | 2008 | 2009 | 2010 | 2011 | 2012 | 2013 | 2014 | |
|---|---|---|---|---|---|---|---|---|---|---|
| 安陆市 | 0.621 | 0.650 | 0.665 | 0.632 | 0.604 | 0.536 | 0.549 | 0.573 | 0.593 | 0.622 |
| 当阳市 | 0.703 | 0.719 | 0.733 | 0.614 | 0.550 | 0.664 | 0.677 | 0.684 | 0.706 | 0.750 |
| 公安县 | 1.187 | 1.212 | 1.045 | 1.017 | 1.249 | 0.968 | 0.889 | 0.925 | 0.921 | 0.935 |
| 汉川市 | 0.448 | 0.445 | 0.463 | 0.434 | 0.421 | 0.407 | 0.437 | 0.454 | 0.464 | 0.481 |
| 洪湖市 | 3.333 | 3.101 | 2.231 | 1.866 | 2.640 | 1.883 | 1.585 | 1.567 | 1.528 | 1.502 |
| 监利县 | 1.564 | 1.441 | 1.481 | 1.506 | 1.452 | 1.303 | 1.296 | 1.334 | 1.348 | 1.347 |
| 江陵县 | 9.544 | 7.487 | 4.906 | 3.711 | 3.378 | 2.477 | 2.390 | 2.372 | 2.240 | 2.272 |
| 京山县 | 1.505 | 1.430 | 1.300 | 1.179 | 1.123 | 0.973 | 0.927 | 0.962 | 0.977 | 0.974 |
| 潜江市 | 0.784 | 0.814 | 0.865 | 0.728 | 0.915 | 0.828 | 0.728 | 0.801 | 0.844 | 0.899 |
| 沙洋县 | 2.953 | 2.455 | 2.313 | 2.076 | 2.136 | 1.322 | 1.295 | 1.313 | 1.255 | 1.237 |
| 石首市 | 0.551 | 0.638 | 0.653 | 0.626 | 0.634 | 0.600 | 0.650 | 0.723 | 0.728 | 0.756 |
| 松滋市 | 1.485 | 1.465 | 0.868 | 0.873 | 0.840 | 0.704 | 0.691 | 0.734 | 0.740 | 0.733 |
| 天门市 | 0.914 | 0.887 | 0.888 | 0.815 | 0.791 | 0.726 | 0.765 | 0.772 | 0.804 | 0.798 |
| 仙桃市 | 0.823 | 0.821 | 0.752 | 0.741 | 0.761 | 0.708 | 0.746 | 0.732 | 0.752 | 0.753 |
| 应城市 | 0.656 | 0.588 | 0.598 | 0.557 | 0.533 | 0.507 | 0.478 | 0.533 | 0.563 | 0.655 |
| 云梦县 | 0.404 | 0.369 | 0.392 | 0.391 | 0.398 | 0.370 | 0.418 | 0.435 | 0.462 | 0.520 |
| 枝江市 | 0.937 | 0.899 | 0.903 | 0.888 | 0.819 | 0.774 | 0.905 | 0.936 | 0.873 | 0.931 |
| 钟祥市 | 1.791 | 1.737 | 1.677 | 1.600 | 1.451 | 1.135 | 1.124 | 1.151 | 1.140 | 1.114 |
| 平均值 | 1.678 | 1.509 | 1.263 | 1.125 | 1.150 | 0.938 | 0.919 | 0.945 | 0.941 | 0.960 |
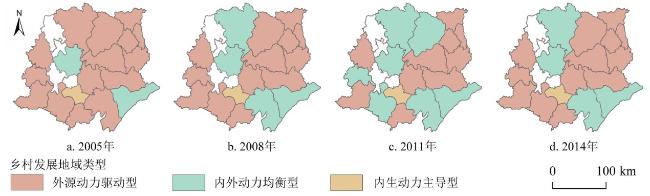
表7 江汉平原乡村发展能力与乡村发展地域类型县市数量统计Tab.7 Statistical analysis of regional development type with different level of rural development capacity |
| 乡村发展能力 | 2005 | 2008 | 2011 | 2014 | ||||||||
|---|---|---|---|---|---|---|---|---|---|---|---|---|
| End | Exo | Equ | End | Exo | Equ | End | Exo | Equ | End | Exo | Equ | |
| 高 | 0 | 4 | 0 | 0 | 3 | 1 | 0 | 3 | 1 | 0 | 4 | 1 |
| 较高 | 0 | 5 | 0 | 0 | 2 | 1 | 0 | 1 | 2 | 0 | 1 | 1 |
| 较低 | 0 | 3 | 1 | 0 | 6 | 2 | 0 | 4 | 4 | 0 | 5 | 2 |
| 低 | 1 | 3 | 1 | 1 | 2 | 0 | 1 | 2 | 0 | 1 | 3 | 0 |
| 合计 | 1 | 15 | 2 | 1 | 13 | 4 | 1 | 10 | 7 | 1 | 13 | 4 |
注:End表示“内生动力主导型”,Exo表示“外源动力驱动型”,Equ表示“内外动力均衡型”。 |
| [1] |
|
| [2] |
李智, 张小林. 中国地理学对乡村发展的多元视角研究及思考[J]. 人文地理, 2017, 32(5):1-8.
|
| [3] |
|
| [4] |
|
| [5] |
|
| [6] |
|
| [7] |
|
| [8] |
|
| [9] |
|
| [10] |
余斌, 卢燕, 曾菊新, 等. 乡村生活空间研究进展及展望[J]. 地理科学, 2017, 37(3):375-385.
|
| [11] |
龙花楼, 李婷婷, 邹健. 我国乡村转型发展动力机制与优化对策的典型分析[J]. 经济地理, 2011, 31(12):2080-2085.
|
| [12] |
张京祥, 申明锐, 赵晨. 超越线性转型的乡村复兴——基于南京市高淳区两个典型村庄的比较[J]. 经济地理, 2015, 35(3):1-8.
|
| [13] |
龙花楼, 李裕瑞, 刘彦随. 中国空心化村庄演化特征及其动力机制[J]. 地理学报, 2009, 64(10):1203-1213.
|
| [14] |
乔家君, 刘嘉俊, 谢淼. 欠发达农区村域空心化特征及其微观机理——以兰考县三个村为例[J]. 人文地理, 2011, 26(6):98-102,160.
|
| [15] |
李平星, 陈诚, 陈江龙. 乡村地域多功能时空格局演变及影响因素研究——以江苏省为例[J]. 地理科学, 2015, 35(7):845-851.
|
| [16] |
李婷婷, 龙花楼. 基于“人口—土地—产业”视角的乡村转型发展研究——以山东省为例[J]. 经济地理, 2015, 35(10):149-155.
|
| [17] |
李裕瑞, 刘彦随, 龙花楼. 黄淮海典型地区村域转型发展的特征与机理[J]. 地理学报, 2012, 67(6):771-782.
|
| [18] |
|
| [19] |
|
| [20] |
房艳刚, 刘继生. 基于多功能理论的中国乡村发展多元化探讨——超越“现代化”发展范式[J]. 地理学报, 2015, 70(2):257-270.
|
| [21] |
张富刚, 刘彦随. 中国区域农村发展动力机制及其发展模式[J]. 地理学报, 2008, 63(2):115-122.
|
| [22] |
唐林楠, 刘玉, 潘瑜春, 等. 基于BP模型和Ward法的北京市平谷区乡村地域功能评价与分区[J]. 地理科学, 2016, 36(10):1514-1521.
|
| [23] |
|
| [24] |
张勇, 冯健. 理性、流动与家庭——村民日常生活语境下的乡村性转型[J]. 人文地理, 2016, 31(6):49-57.
|
| [25] |
刘玉, 刘彦随, 郭丽英. 基于SOFM的环渤海地区乡村地域功能分区[J]. 人文地理, 2013, 28(3):114-120.
|
| [26] |
鲁莎莎, 刘彦随, 关兴良. 农业地域功能的时空格局与演进特征——以106国道沿线典型样带区为例[J]. 中国土地科学, 2014, 28(3):67-75.
|
| [27] |
李航, 李雪铭, 田深圳, 等. 城市人居环境的时空分异特征及其机制研究——以辽宁省为例[J]. 地理研究, 2017, 36(7):1323-1338.
|
| [28] |
周礼, 蒋金亮. 长三角城市旅游竞争力综合评价及其空间分异[J]. 经济地理, 2015, 35(1):173-179.
|
| [29] |
卓蓉蓉, 余斌, 曾菊新, 等. 湖北省经济空间格局演变与经济空间战略效应[J]. 经济地理, 2018, 38(3):37-45.
|
| [30] |
李裕瑞, 刘彦随, 龙花楼. 黄淮海地区乡村发展格局与类型[J]. 地理研究, 2011, 30(9):1637-1647.
|
/
| 〈 |
|
〉 |