
Spatial and Temporal Differentiation of Carrying Capacity of Chinese Industrial Transfer in Mekong Coutries
Received date: 2018-07-12
Revised date: 2018-10-12
Online published: 2025-04-20
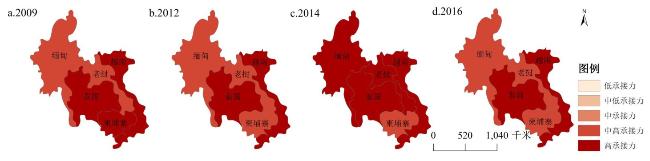
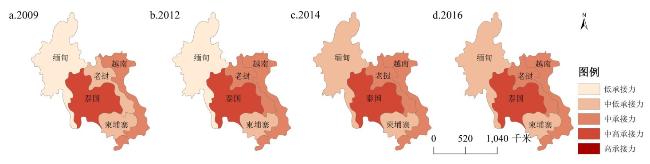
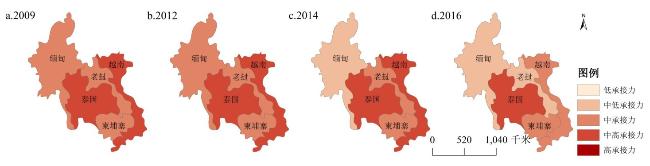
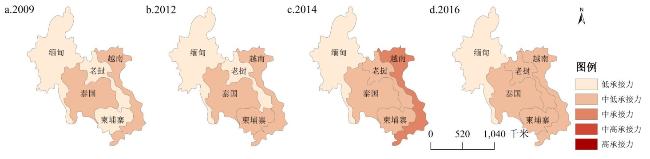
Comprehensively cognizing the spatial and temporal differentiation of carrying capacity of Chinese industrial transfer in Mekong Countries is an important prerequisite to promote Lancang River-Mekong River cooperation and build an Asian community of common destiny. This paper uses CA index to reveal the complementation characteristic of the comparative advantage between China and Mekong Countries, and indicates that Mekong Countries have the foundation to undertake the industrial transfer from China. This paper constructs the index system of the carrying capacity of Chinses industrial transfer in Mekong Countries based on four-force model, analyzes the carrying capacity of Chinese industrial transfer using global factor analysis method, and reveals its spatial and temporal differentiation variation applying GIS spatial analysis. The results show that: From the view of time dimension, the carrying capacity of Chinses industrial transfer in Mekong Countries appears rising trend with fluctuations from 2009 to 2015 and declines in 2016;From the view of spatial dimension, spatial distribution of industrial attraction capacity and industrial development capacity in Mekong Countries is in equilibrium, while the industrial supporting ability and industrial discrimination is not. Based on the difference of the competitive advantage and factor endowment between China and Mekong Countries, this paper gives some suggestions to improve the carrying capacity of industrial transfer of Mekong Countries under the Lancang River-Mekong River cooperation, including transferring different industries, promoting the construction of infrastructure, cultivating talents and constructing industrial zones.
HUA Jian , ZHANG Yaoyao . Spatial and Temporal Differentiation of Carrying Capacity of Chinese Industrial Transfer in Mekong Coutries[J]. Economic geography, 2019 , 39(5) : 10 -18 . DOI: 10.15957/j.cnki.jjdl.2019.05.002
表1 产业转移承接力指标评价体系Tab.1 Index system of carrying capacity of industrial transfer |
| 目标层 | 因素层 | 准则层 | 指标层 | 参考资料来源 |
|---|---|---|---|---|
| 产 业 转 移 承 接 力 (A) | 产业转移吸引力(A1) | 正效应指标A11 | 常住人口(A111),人均GDP(A112),就业人员占总人口比重(A113),政府效率(A114) | 赵宏波等[13]、苏华[12]、吴传清等[18]、彭薇[22] |
| 负效应指标A12 | 职工报酬占GDP比例(A121),自然资源租金占GDP百分比(A122),利润税(占商业利润的百分比)(A123),居民消费价格指数(2010=100)(A124) | 沈雪[23]、赵宏波等[13]、彭薇[22]、陈晓峰[16] | ||
| 产业转移支撑力(A2) | 正效应指标A21 | 航空、公路、铁路运输货运量(A211),人均绿地面积(A212) | 赵宏波等[13]、刘惠敏[21] | |
| 负效应指标A22 | 单位GDP能耗(A221),未通电率(A222) | 赵宏波等[13]、吴传清等[18] | ||
| 产业转移鉴别力(A3) | 正效应指标A31 | 互联网普及率(A311),每万人普通高等院校在校学生数(A312) | 赵宏波等[13]、吴传清等[18] | |
| 负效应指标A32 | 信息和通讯产品进口占总进口的比重(A321),城镇化率(A322) | 吴传清等[18]、陈晓峰[16] | ||
| 产业转移发展力(A4) | 正效应指标A41 | 公共教育支出占政府支出的比重(A411) | 李春光等[20]、赵宏波等[13]、吴传清等[18] | |
| 负效应指标A42 | 第一产业增加值占GDP比重(A421) | 吴传清等[18] |
表2 中国和湄公河五国具有国际竞争力的制造业行业分布Tab.2 International competitiveness analysis of manufacturing industries in China and Mekong countries |
| 国家 | 行业 | 细分的行业 | CA | 国家 | 行业 | 细分的行业 | CA |
|---|---|---|---|---|---|---|---|
| 柬埔寨 | 资本密集型 | 印刷业记录媒介的复印 | 34.04 | 泰国 | 资本密集型 | 印刷业记录媒介的复印 | 1.19 |
| 化学纤维制造 | 3.66 | ||||||
| 橡胶制造 | 2.98 | ||||||
| 劳动密集型 | 服装及其他纤维品制造 | 25.10 | 劳动密集型 | 食品加工制造 | 1.48 | ||
| 皮革毛皮羽绒及制品 | 4.06 | 资源密集型 | 木材及木材采运 | 1.02 | |||
| 资源密集型 | 木材及木材采运 | 1.71 | 资本技术密集型 | - | - | ||
| 资本技术密集型 | - | - | |||||
| 老挝 | 资本密集型 | 有色金属冶炼及延压加工 | 13.09 | 越南 | 资本密集型 | 家具制造 | 3.48 |
| 劳动密集型 | 饮料制造 | 2.60 | 劳动密集型 | 食品加工制造 | 1.19 | ||
| 服装及其他纤维品制造 | 5.05 | ||||||
| 皮革毛皮羽绒及制品 | 6.11 | ||||||
| 烟草加工 | 7.59 | 资源密集型 | 煤炭采选 | 1.23 | |||
| 服装及其他纤维品制造 | 2.36 | 资本技术密集型 | 电子及通信设备制造 | 1.33 | |||
| 资源密集型 | 有色金属矿采选 | 24.86 | |||||
| 木材及木材采运 | 8.12 | ||||||
| 资本技术密集型 | - | - | |||||
| 缅甸 | 资本密集型 | 非金属矿物制品 | 3.33 | 中国 | 资本密集型 | 家具制造 | 2.67 |
| 文教体育用品制造 | 2.09 | ||||||
| 金属制品 | 1.07 | ||||||
| 劳动密集型 | 食品加工制造 | 2.25 | 劳动密集型 | 纺织 | 2.00 | ||
| 服装及其他纤维品制造 | 3.00 | ||||||
| 服装及其他纤维品制造 | 3.27 | 皮革毛皮羽绒及制品 | 2.60 | ||||
| 木材加工及竹藤棕草制品 | 1.35 | ||||||
| 资源密集型 | 石油和天然气开采 | 4.05 | 资源密集型 | - | - | ||
| 木材及木材采运 | 17.99 | 资本技术密集型 | 电子及通信设备制造 | 2.33 | |||
| 资本技术密集型 | - | - |
注:“-”表示该行业CA<1。此处的制造业分类根据制造业分类的核心要素(如劳动、资源、技术、资本等)进行分类,可以反映各国资源禀赋和技术差异[8]。 |
表3 湄公河五国产业转移承接力各变量权重值Tab.3 The variance weight value of carrying capacity of industrial transfer in Mekong Countries |
| A111 | A112 | A113 | A114 | A121 | A122 | A123 | A124 | A211 | A212 | A221 | A222 | A311 | A312 | A321 | A322 | A411 | A421 |
|---|---|---|---|---|---|---|---|---|---|---|---|---|---|---|---|---|---|
| 0.0552 | 0.0692 | 0.0725 | 0.0767 | 0.0401 | 0.0133 | 0.0337 | 0.0436 | 0.0654 | 0.0251 | 0.0548 | 0.0778 | 0.0723 | 0.0700 | 0.0451 | 0.0719 | 0.0743 | 0.0390 |
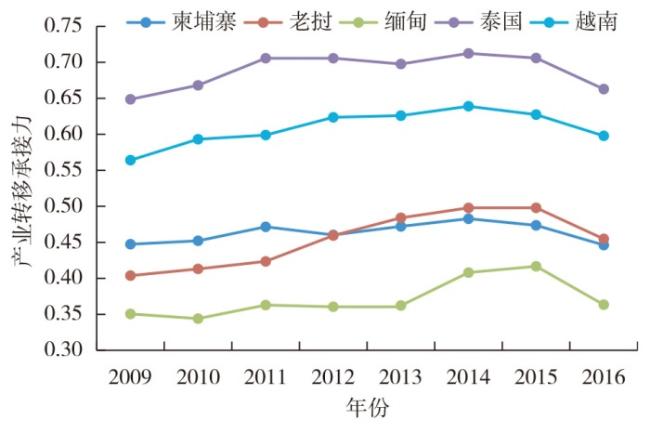
表4 湄公河五国2009—2016年产业转移承接力评价结果Tab.4 Results of carrying capacity of industrial transfer in Mekong Countries from 2009 to 2016 |
| 柬埔寨 | 老挝 | 缅甸 | 泰国 | 越南 | |
|---|---|---|---|---|---|
| 2009 | 0.447 | 0.404 | 0.351 | 0.649 | 0.564 |
| 2010 | 0.452 | 0.413 | 0.344 | 0.668 | 0.593 |
| 2011 | 0.472 | 0.424 | 0.363 | 0.706 | 0.599 |
| 2012 | 0.460 | 0.459 | 0.361 | 0.706 | 0.624 |
| 2013 | 0.472 | 0.484 | 0.362 | 0.698 | 0.626 |
| 2014 | 0.483 | 0.498 | 0.408 | 0.712 | 0.639 |
| 2015 | 0.474 | 0.498 | 0.417 | 0.706 | 0.627 |
| 2016 | 0.446 | 0.455 | 0.363 | 0.663 | 0.598 |
| [1] |
邹春萌. “一带一路”背景下中国与湄公河国家产能合作:制约因素与发展途径[J]. 云南大学学报:社会科学版, 2017, 16(4):114-121.
|
| [2] |
魏巍, 吴明, 吴鹏. 不同发展水平国家在全球价值链中位置差异分析——基于国际产业转移视角[J]. 产业经济研究, 2016(1):80-91,99.
|
| [3] |
|
| [4] |
|
| [5] |
|
| [6] |
|
| [7] |
Fujital and Gokan. On the evolution of the spatial economy with multi-unit multi-plant firms[J]. Portuguese Economic Journal, 2005(4):73-105.
|
| [8] |
徐坡岭, 那振芳. 我国制造业在“一带一路”的产业链布局问题——竞争优势互补与中间品贸易视角[J]. 东北亚论坛, 2018, 27(3):88-109,128.
|
| [9] |
滕堂伟, 胡森林, 侯路瑶. 长江经济带产业转移态势与承接的空间格局[J]. 经济地理, 2016, 36(5):92-99.
|
| [10] |
展宝卫, 等. 产业转移承接力建设概论[M]. 济南: 泰山出版社, 2006:68-74.
|
| [11] |
廖和芸. 苏北产业转移承接力研究[D]. 南京: 南京农业大学, 2009.
|
| [12] |
苏华, 胡田田, 黄麟堡. 中国各区域产业承接能力的评价[J]. 统计与决策, 2011(5):41-43.
|
| [13] |
赵宏波, 苗长虹, 冯渊博, 等. 河南省产业转移承接力时空格局与优化路径分析[J]. 经济地理, 2017, 37(12):112-120.
|
| [14] |
马涛, 李东, 杨建华, 等. 地区分工差距的度量:产业转移承接能力评价的视角[J]. 管理世界, 2009(9):168-169.
|
| [15] |
冯长春, 曹敏政, 甘霖. 皖江城市带承接产业转移的空间适宜性研究[J]. 经济地理, 2014, 34(10):90-97.
|
| [16] |
陈晓峰. 提升环长株潭城市群国际产业转移承接力研究[D]. 杭州: 浙江大学, 2016.
|
| [17] |
叶琪. 我国区域产业转移的态势与承接的竞争格局[J]. 经济地理, 2014, 34(3):91-97.
|
| [18] |
吴传清, 陈晓. 长江中上游地区产业转移承接能力研究[J]. 经济与管理, 2017, 31(5):49-57.
|
| [19] |
赵秋运, 赵磊. 新结构经济学与“一带一路”:转入国的筛选和转出产业的甄别[J]. 西部论坛, 2017, 27(6):82-92.
|
| [20] |
李春光, 徐元国, 屈时雨. 河南承接产业转移城市综合承载力的时空演变[J]. 经济地理, 2017, 37(1):134-141.
|
| [21] |
刘惠敏. 长江三角洲城市群综合承载力的时空分异研究[J]. 中国软科学, 2011(10):114-122.
|
| [22] |
彭薇. 共建“丝绸之路经济带”战略下中国与沿线国家产业转移研究——基于地缘经济的视角与引力模型的检验[J]. 经济问题探索, 2018(1):89-97.
|
| [23] |
沈雪. 河北省产业承接力研究[D]. 天津: 河北工业大学, 2013.
|
| [24] |
盛斌. 中国对外贸易政策的政治经济分析[M]. 上海: 上海三联书店, 2002.
|
/
| 〈 |
|
〉 |