
The Temporal and Spatial Pattern Evolution of Industrial High-Quality Development Index in the Yangtze River Economic Belt
Received date: 2019-10-10
Revised date: 2020-04-17
Online published: 2025-04-18
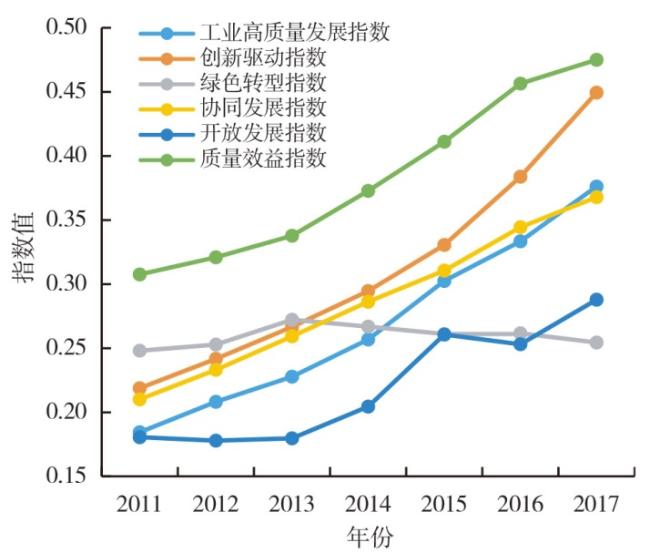
Promoting industrial high-quality development is an important support for the Yangtze River Economic Belt to become a high-quality development belt. This paper constructs an industrial high-quality development evaluation system with five dimensions of innovation-driven,green transformation,coordinated development,open development,and quality and efficiency. The entropy-Topsis analysis method is used to judge the spatiotemporal evolution of the industrial high-quality development level of the Yangtze River Economic Belt from 2011 to 2017. The research shows that: 1) The level of industrial high-quality development in the Yangtze River Economic Belt is rapidly rising,and a pattern of industrial high-quality development with Shanghai,Jiangsu,and Chongqing as the leader and coordinated development in other regions has formed. 2) The industrial development relies on the innovation and quality and efficiency. The innovation-driven,quality and efficiency index has a spatial characteristic of decreasing downstream,midstream,and upstream. The green transformation,coordinated development,and open development index are highest in the downstream region,and alternately leading in the middle and upstream. 3) From the perspective of development momentum,the industrial high-quality development in the downstream stems from innovation-driven,quality benefits,and coordinated development. Midstream region stems from innovation-driven and quality benefits. The sources of industrial high-quality development momentum in the upstream regions are more balanced. To promote the industrial high-quality development of the Yangtze River Economic Belt we should give full play to the role of innovation-driven leadership,promote the precise implementation of green transformation policies,create a new pattern of comprehensive and coordinated openness,and strengthen the goal-oriented development of quality and efficiency.
DU Yu , HUANG Cheng , WU Chuanqing . The Temporal and Spatial Pattern Evolution of Industrial High-Quality Development Index in the Yangtze River Economic Belt[J]. Economic geography, 2020 , 40(8) : 96 -103 . DOI: 10.15957/j.cnki.jjdl.2020.08.012
表1 工业高质量发展评价指标体系Tab.1 Index system of industrial high-quality development |
| 一级指标 | 二级指标 | 三级指标(单位) | 属性 |
|---|---|---|---|
| 创新驱动 | 创新投入 | 规上工业企业R&D经费内部支出/主营业务收入(%) | 正 |
| 规上工业企业R&D人员/平均用工人数(%) | 正 | ||
| 规上工业企业新产品开发经费支出/主营业务收入(%) | 正 | ||
| 创新绩效 | 规上工业企业新产品销售收入/主营业务收入(%) | 正 | |
| 规上工业企业平均新产品销售收入(万元/家) | 正 | ||
| 规上工业企业每亿元主营业务收入有效发明专利数(件) | 正 | ||
| 创新基础 | 规上工业企业中有R&D活动的企业数占比(%) | 正 | |
| 绿色转型 | 资源消耗 | 万元工业增加值能耗(t标煤/万元) | 负 |
| 万元工业增加值水耗(m3/万元) | 负 | ||
| 一般工业固体废物综合利用率(%) | 正 | ||
| 污染排放 | 单位工业增加值工业废水排放量(t/万元) | 负 | |
| 单位工业增加值工业SO2排放量(t/亿元) | 负 | ||
| 单位工业增加值工业烟粉尘排放量(t/亿元) | 负 | ||
| 环境治理 | 工业污染治理完成投资额/工业增加值(%) | 正 | |
| 协同发展 | 产业协同 | 工业化和信息化融合发展水平 | 正 |
| 工业协同发展指数 | 正 | ||
| 二三产业协同发展指数 | 正 | ||
| 区域协同 | 区际工业协同发展指数 | 负 | |
| 区域工业协同发展指数 | 负 | ||
| 企业协同 | 按规模划分规上工业企业协同发展指数 | 正 | |
| 按所有制划分规上工业企业协同发展指数 | 正 | ||
| 开放发展 | 进出口质量 | 高技术产品进出口总额/进出口总额(%) | 正 |
| 高技术产品出口总额/出口总额(%) | 正 | ||
| 高技术产品进口总额/进口总额(%) | 正 | ||
| 外资利用 | 外商投资企业平均投资总额(万元/家) | 正 | |
| 外商投资和港澳台投资工业企业平均资产总额(亿元/家) | 正 | ||
| 企业出口 | 规上工业企业新产品出口平均销售收入(万元/家) | 正 | |
| 高技术产业新产品出口平均销售收入(万元/家) | 正 | ||
| 质量效益 | 发展质量 | 不变价格规上工业企业劳动生产率(万元/人) | 正 |
| 发展动力 | 规上工业企业全要素生产率 | 正 | |
| 不变价格规上工业增加值实际增长率(%) | 正 | ||
| 发展效益 | 规上工业企业平均净利润(万元/家) | 正 | |
| 规上工业企业总利润率(%) | 正 | ||
| 规上工业企业资产负债率(%) | 负 | ||
| 规上工业企业成本费用利润率(%) | 正 |
表2 全国及各地区工业高质量发展指数(2011—2017年)Tab.2 Index of national and regional industrial high-quality development (2011-2017) |
| 地区 | 2011 | 2012 | 2013 | 2014 | 2015 | 2016 | 2017 | 平均增速/% |
|---|---|---|---|---|---|---|---|---|
| 全国 | 0.193 | 0.215 | 0.237 | 0.262 | 0.282 | 0.318 | 0.343 | 10.06 |
| 长江经济带 | 0.184 | 0.208 | 0.228 | 0.257 | 0.302 | 0.333 | 0.376 | 12.71 |
| 长江经济带以外地区 | 0.201 | 0.223 | 0.242 | 0.265 | 0.270 | 0.309 | 0.324 | 8.27 |
| 上游地区 | 0.138 | 0.158 | 0.177 | 0.196 | 0.261 | 0.275 | 0.343 | 16.41 |
| 中游地区 | 0.133 | 0.155 | 0.178 | 0.207 | 0.242 | 0.275 | 0.302 | 14.68 |
| 下游地区 | 0.267 | 0.298 | 0.316 | 0.355 | 0.389 | 0.436 | 0.465 | 9.66 |
注:下游地区包括沪苏浙皖,中游地区包括鄂湘赣,上游地区包括川渝黔滇,工业高质量发展指数为各地区的算术平均值,平均增速为几何平均增长率,下同。 |
表3 长江经济带沿线11省份工业高质量发展指数(2011—2017年)Tab.3 Index of industrial high-quality development of 11 provinces along the Yangtze River Economic Belt (2011-2017) |
| 地区 | 2011 | 2012 | 2013 | 2014 | 2015 | 2016 | 2017 | 平均增速/% |
|---|---|---|---|---|---|---|---|---|
| 上海 | 0.398 (3) | 0.417 (3) | 0.417 (3) | 0.481 (3) | 0.521 (3) | 0.586 (2) | 0.614 (1) | 7.48 |
| 江苏 | 0.316 (5) | 0.359 (5) | 0.357 (6) | 0.400 (6) | 0.433 (7) | 0.479 (5) | 0.488 (6) | 7.56 |
| 浙江 | 0.219 (8) | 0.251 (9) | 0.287 (8) | 0.308 (10) | 0.338 (9) | 0.372 (8) | 0.391 (8) | 10.09 |
| 安徽 | 0.135 (20) | 0.167 (17) | 0.201 (17) | 0.230 (15) | 0.264 (14) | 0.307 (14) | 0.366 (10) | 18.00 |
| 江西 | 0.085 (27) | 0.104 (26) | 0.137 (25) | 0.175 (21) | 0.193 (21) | 0.232 (21) | 0.236 (22) | 18.45 |
| 湖北 | 0.171 (14) | 0.189 (14) | 0.205 (16) | 0.221 (18) | 0.256 (15) | 0.313 (12) | 0.347 (13) | 12.47 |
| 湖南 | 0.142 (17) | 0.172 (16) | 0.192 (19) | 0.225 (17) | 0.278 (11) | 0.280 (17) | 0.325 (15) | 14.75 |
| 重庆 | 0.221 (6) | 0.261 (8) | 0.285 (9) | 0.331 (7) | 0.476 (4) | 0.428 (7) | 0.529 (5) | 15.61 |
| 四川 | 0.186 (12) | 0.203 (13) | 0.214 (14) | 0.237 (13) | 0.248 (16) | 0.295 (16) | 0.347 (12) | 10.96 |
| 贵州 | 0.075 (29) | 0.086 (29) | 0.097 (29) | 0.098 (30) | 0.160 (26) | 0.181 (26) | 0.270 (21) | 23.73 |
| 云南 | 0.069 (30) | 0.081 (30) | 0.114 (28) | 0.120 (29) | 0.160 (27) | 0.194 (25) | 0.226 (24) | 21.95 |
注:括号内为全国排名。 |
表4 长江经济带上中下游地区工业高质量发展分维度指数(2011—2017年)Tab.4 Dimensional index of industrial high-quality development in the Middle and Lower Reaches of the Yangtze River Economic Belt (2011-2017) |
| 维度 | 地区 | 2011 | 2012 | 2013 | 2014 | 2015 | 2016 | 2017 |
|---|---|---|---|---|---|---|---|---|
| 创新驱动 | 下游 | 0.302 | 0.355 | 0.392 | 0.435 | 0.473 | 0.538 | 0.592 |
| 中游 | 0.179 | 0.200 | 0.227 | 0.239 | 0.273 | 0.322 | 0.389 | |
| 上游 | 0.165 | 0.160 | 0.171 | 0.196 | 0.231 | 0.276 | 0.352 | |
| 绿色转型 | 下游 | 0.289 | 0.295 | 0.318 | 0.312 | 0.314 | 0.334 | 0.321 |
| 中游 | 0.219 | 0.220 | 0.236 | 0.231 | 0.226 | 0.222 | 0.226 | |
| 上游 | 0.229 | 0.235 | 0.254 | 0.249 | 0.234 | 0.220 | 0.209 | |
| 协同发展 | 下游 | 0.278 | 0.297 | 0.314 | 0.355 | 0.382 | 0.419 | 0.450 |
| 中游 | 0.176 | 0.202 | 0.235 | 0.252 | 0.273 | 0.304 | 0.316 | |
| 上游 | 0.168 | 0.193 | 0.223 | 0.243 | 0.267 | 0.300 | 0.324 | |
| 开放发展 | 下游 | 0.227 | 0.235 | 0.218 | 0.248 | 0.271 | 0.285 | 0.293 |
| 中游 | 0.115 | 0.115 | 0.115 | 0.152 | 0.183 | 0.184 | 0.185 | |
| 上游 | 0.183 | 0.168 | 0.190 | 0.201 | 0.309 | 0.273 | 0.359 | |
| 质量效益 | 下游 | 0.326 | 0.344 | 0.368 | 0.404 | 0.446 | 0.498 | 0.522 |
| 中游 | 0.319 | 0.341 | 0.371 | 0.405 | 0.447 | 0.489 | 0.478 | |
| 上游 | 0.281 | 0.283 | 0.283 | 0.317 | 0.350 | 0.391 | 0.426 |
| [1] |
维诺德·托马斯, 等. 增长的质量[M]. 北京: 中国财经出版社, 2001.
|
| [2] |
迈克尔·波特. 国家竞争优势[M]. 北京: 华夏出版社, 2003.
|
| [3] |
高培勇, 杜创, 刘霞辉, 等. 高质量发展背景下的现代化经济体系建设:一个逻辑框架[J]. 经济研究, 2019, 54(4):4-17.
|
| [4] |
芮明杰. 构建现代产业体系的战略思路、目标与路径[J]. 中国工业经济, 2018(9):24-40.
|
| [5] |
郭克莎. 工业增长质量研究[M]. 北京: 经济管理出版社, 1998.
|
| [6] |
张军, 陈诗一,
|
| [7] |
席强敏, 陈曦, 李国平. 中国城市生产性服务业模式选择研究——以工业效率提升为导向[J]. 中国工业经济, 2015(2):18-30.
|
| [8] |
余淼杰, 张睿. 中国制造业出口质量的准确衡量:挑战与解决方法[J]. 经济学(季刊), 2018(2):463-484.
|
| [9] |
江飞涛, 武鹏, 李晓萍. 中国工业经济增长动力机制转换[J]. 中国工业经济, 2014(5):5-17.
|
| [10] |
向晓梅, 吴伟萍. 改革开放40年持续性产业升级的动力机制与路径——广东迈向高质量发展之路[J]. 南方经济, 2018(7):1-18.
|
| [11] |
王慧艳, 李新运, 徐银良. 科技创新驱动我国经济高质量发展绩效评价及影响因素研究[J]. 经济学家, 2019(11):64-74.
|
| [12] |
陶长琪, 陈伟, 郭毅. 新中国成立70年中国工业化进程与经济发展[J]. 数量经济技术经济研究, 2019, 36(8):3-26.
|
| [13] |
肖德, 侯佳宁. 中国制造业升级动能转换的路径研究[J]. 理论探讨, 2019(1):88-95.
|
| [14] |
刘汉初, 樊杰, 周道静, 等. 2000年以来中国高耗能产业的空间格局演化及其成因[J]. 经济地理, 2019, 39(5):110-118.
|
| [15] |
颜建军, 徐雷, 李扬. 资源、环境双重约束下的湖南省产业生态化发展路径[J]. 经济地理, 2017, 37(6):183-189.
|
| [16] |
隋建利, 刘碧莹, 刘金全. 中国工业经济增长与工业污染的内在关联机制测度[J]. 资源科学, 2018(4):862-873.
|
| [17] |
何玉长, 潘超. 经济发展高质量重在实体经济高质量[J]. 学术月刊, 2019, 51(9):57-69.
|
| [18] |
唐晓华, 张欣珏, 李阳. 中国制造业与生产性服务业动态协调发展实证研究[J]. 经济研究, 2018, 53(3):79-93.
|
| [19] |
何颖, 齐亚伟, 徐志琴. 电子信息产业与交通运输业耦合发展的实证测度研究[J]. 管理世界, 2015(10):182-183.
|
| [20] |
杜传忠, 杨志坤. 我国信息化与工业化融合水平测度及提升路径分析[J]. 中国地质大学学报:社会科学版, 2015, 15(3):84-97,139.
|
| [21] |
罗良文, 赵凡. 工业布局优化与长江经济带高质量发展:基于区域间产业转移视角[J]. 改革, 2019(2):27-36.
|
| [22] |
张杰, 唐根年. 浙江省制造业企业时空迁移特征及驱动机理——基于县域尺度[J]. 经济地理, 2019, 39(6):118-126.
|
| [23] |
彭继增, 邓梨红, 曾荣平. 长江中上游地区承接东部地区产业转移的实证分析[J]. 经济地理, 2017, 37(1):129-133,141.
|
| [24] |
李欣泽, 陈言. 资源错配变迁与工业经济增长——基于1980—2014年中国工业部门的研究[J]. 山西财经大学学报, 2017(7):59-71.
|
| [25] |
张同斌, 马丽园, 高铁梅. 中国工业企业增长质量的分布特征变动与差异分解研究[J]. 数量经济技术经济研究, 2016, 33(8):13-29.
|
| [26] |
范林凯, 吴万宗, 余典范, 等. 中国工业产能利用率的测度、比较及动态演化——基于企业层面数据的经验研究[J]. 管理世界, 2019, 35(8):84-96.
|
| [27] |
张莉, 程可为, 赵敬陶. 土地资源配置和经济发展质量——工业用地成本与全要素生产率[J]. 财贸经济, 2019, 40(10):126-141.
|
| [28] |
马洪福, 郝寿义. 产业转型升级水平测度及其对劳动生产率的影响——以长江中游城市群26个城市为例[J]. 经济地理, 2017, 37(10):116-125.
|
| [29] |
黄平, 曾绍伦, 龙志. 西部地区工业化质量时空演变及高质量发展路径研究[J]. 中国人口·资源与环境, 2019, 29(8):50-58.
|
| [30] |
唐子惠, 毛培, 赵金龙. 中国工业产能利用率的空间特征分析[J]. 管理世界, 2018, 34(12):171-172.
|
| [31] |
陈玉龙, 石慧. 环境规制如何影响工业经济发展质量?——基于中国2004—2013年省际面板数据的强波特假说检验[J]. 公共行政评论, 2017, 10(5):4-25,215.
|
| [32] |
周平, 熊曦. 湖南省各市州工业竞争力评价及转型建议[J]. 经济地理, 2018, 38(10):136-141.
|
| [33] |
江小国, 何建波, 方蕾. 制造业高质量发展水平测度、区域差异与提升路径[J]. 上海经济研究, 2019(7):70-78.
|
| [34] |
史丹, 李鹏. 中国工业70年发展质量演进及其现状评价[J]. 中国工业经济, 2019(9):5-23.
|
| [35] |
贺正楚, 曹德, 吴艳. 中国制造业发展质量与国际竞争力的互动路径[J]. 当代财经, 2018(11):88-99.
|
| [36] |
戢晓峰, 谢世坤. 基于SEM的云南省URTT复合系统耦合协调机制研究[J]. 经济地理, 2019, 39(6):46-57.
|
/
| 〈 |
|
〉 |