
Spatial Characteristics and Driving Factors of Human Capital Based on Prefecture-Level City
Received date: 2019-10-30
Revised date: 2020-05-27
Online published: 2025-04-18
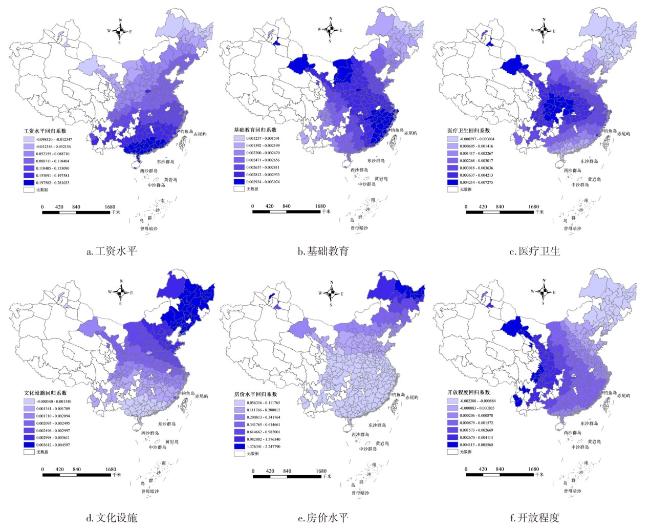
Take Chinese prefecture-level cities as spatial unit,with the help of related data of the sixth population census and urban statistical yearbook. Combine spatial autocorrelation with geographically weighted regression analytical method,to discuss special distribution characteristic and driving factor of Chinese city human capital. The result shows: the agglomeration of human capital is further enhanced, there is great distance of human capital between cities and regions,human capital presents a clustering distribution significant space positive correlation in space; Each factor shows significant spatial heterogeneity on the driving pattern of the spatial distribution of urban human capital. To shrink the human capital distance with east region,the Midwest and the northeast regions have to update public service of basic education、Medical Treatment and Public Health etc. Meanwhile to adopt more aggressive human resource policy than the East.
LI Songliang , ZENG Xiaoming , ZENG Xiangyan , LIU Muhua , CHENG Pengfei , CHEN Liang . Spatial Characteristics and Driving Factors of Human Capital Based on Prefecture-Level City[J]. Economic geography, 2020 , 40(8) : 43 -48 . DOI: 10.15957/j.cnki.jjdl.2020.08.006
表1 变量的描述性统计分析Tab.1 Descriptive statistical analysis of variables |
| 变量 | 观测值 | 平均值 | 标准差 | 最小值 | 最大值 |
|---|---|---|---|---|---|
| 人力资本(%) | 283 | 0.35 | 0.54 | 0.03 | 5.47 |
| 工资水平(万元) | 283 | 3.13 | 0.76 | 1.38 | 7.19 |
| 基础教育质量 | 283 | 10.96 | 91.50 | 0.09 | 855.3 |
| 医疗卫生水平(张) | 283 | 34.64 | 13.70 | 12.65 | 109.9 |
| 文化设施水平(册) | 283 | 47.79 | 74.87 | 2.84 | 883.4 |
| 房价水平(万元) | 283 | 0.49 | 0.53 | 0.14 | 4.42 |
| 开放程度 | 283 | 28.52 | 28.18 | 0 | 194.4 |
表2 GWR模型参数估计及检验结果Tab.2 Parameter dstimation and test results of GWR model |
| 模型参数 | 数值 |
|---|---|
| Bandwidth | 1 014 433.6067 |
| ResidualSquares | 20.3513 |
| EffectiveNumber | 26.8908 |
| Sigma | 0.2819 |
| AICc | 106.0050 |
| R2 | 0.7559 |
| R2 Adjusted | 0.7313 |
表3 GWR 模型回归系数的描述性统计分析Tab.3 Descriptive statistical analysis of regression coefficient of GWR model |
| 驱动因素 | 平均值 | 最小值 | 下四分 位值 | 中位 数值 | 上四分 位值 | 最大值 |
|---|---|---|---|---|---|---|
| 工资水平 | 0.1170 | -0.0983 | 0.0872 | 0.1100 | 0.1520 | 0.2810 |
| 基础教育质量 | 0.0027 | 0.0013 | 0.0026 | 0.0028 | 0.0029 | 0.0031 |
| 医疗卫生水平 | 0.0027 | -0.0003 | 0.0017 | 0.0032 | 0.0037 | 0.0073 |
| 文化设施水平 | 0.0023 | -0.0003 | 0.0016 | 0.0022 | 0.0029 | 0.0046 |
| 房价水平 | 0.1940 | 0.0563 | 0.0722 | 0.0867 | 0.1470 | 2.2480 |
| 开放程度 | 0.0011 | -0.0024 | 0.0003 | 0.0009 | 0.0016 | 0.0056 |
| 常数项 | -0.3514 | -0.6779 | -0.4732 | -0.3358 | -0.2359 | 0.0345 |
| [1] |
李海峥, 贾娜, 张晓蓓, 等. 中国人力资本的区域分布及发展动态[J]. 经济研究, 2013(7):49-62.
|
| [2] |
|
| [3] |
|
| [4] |
|
| [5] |
徐大丰. 我国城市的经济增长趋同吗?[J]. 数量经济技术经济研究, 2009(5):30-41.
|
| [6] |
胡永远. 人力资本积累与地区经济增长的联动关系分析[J]. 中国人口·资源与环境, 2011(12):153-157.
|
| [7] |
蔡昉, 王德文, 都阳. 劳动力市场扭曲对区域差距的影响[J]. 中国社会科学, 2001(2):4-14,204.
|
| [8] |
陈钊, 陆铭, 金煜. 中国人力资本和教育发展的区域差异:对于面板数据的估算[J]. 世界经济, 2004(12):25-31,77.
|
| [9] |
姚先国, 张海峰. 教育、人力资本与地区经济差异[J]. 经济研究, 2008(5):47-57.
|
| [10] |
严立刚, 曾小明. 东部产业为何难以向中西部转移——基于人力资本空间差异的解释[J]. 经济地理, 2020, 40(1):125-131.
|
| [11] |
李天健, 侯景新. 中国人力资本的空间集聚与分布差异[J]. 世界经济文汇, 2015(3):104-117.
|
| [12] |
黄犚. 我国人力资本分布与流动的研究——基于“五普”与“六普”的比较分析[J]. 西北人口, 2013(6):80-84,94.
|
| [13] |
黄乾, 李修彪. 我国省域人力资本的收敛性分析——基于三种测算方法的比较[J]. 人口与经济, 2015(4):94-106.
|
| [14] |
曹方. 中国人力资本空间分布差异的度量与分解[J]. 西北人口, 2008(4):7-11.
|
| [15] |
|
| [16] |
刘乃全, 耿文才. 上海市人口空间分布格局的演变及其影响因素分析——基于空间面板模型的实证研究[J]. 财经研究, 2015(2):99-110.
|
/
| 〈 |
|
〉 |