
Pattern and Driving Force of Regional Innovation and Regional Financial Coupling Coordination in the Yangtze River Economic Belt
Received date: 2019-02-03
Revised date: 2019-06-28
Online published: 2025-04-18
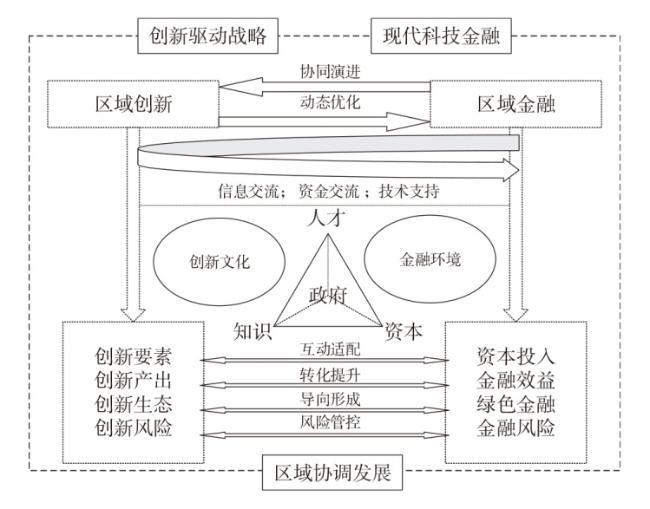
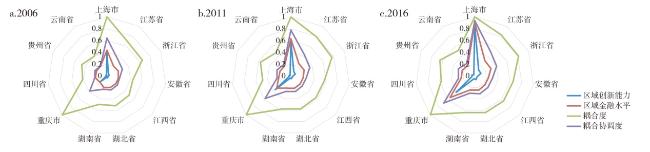
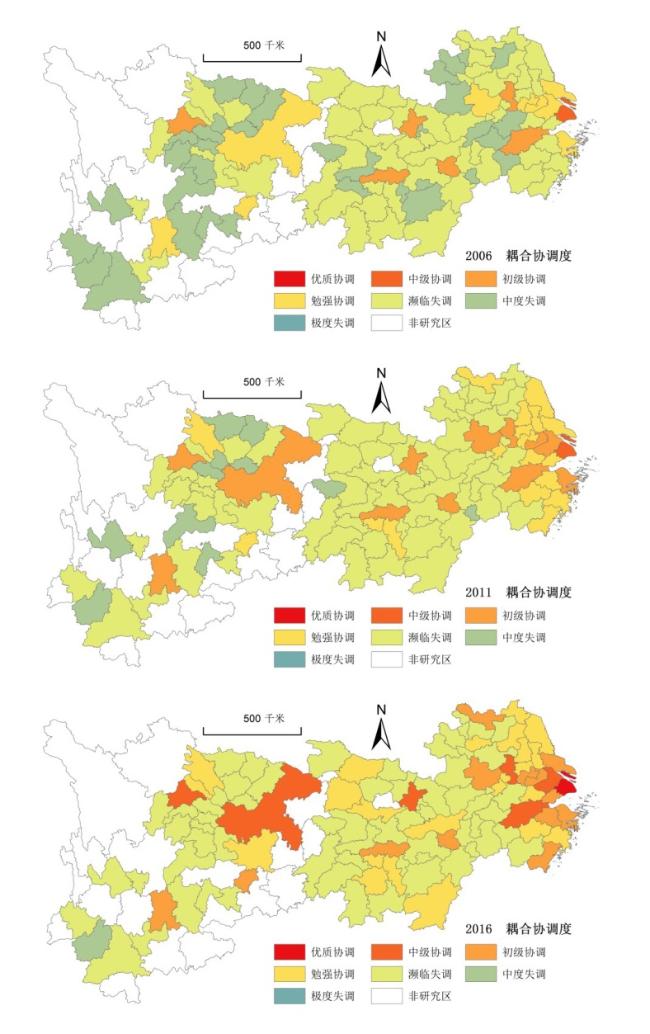
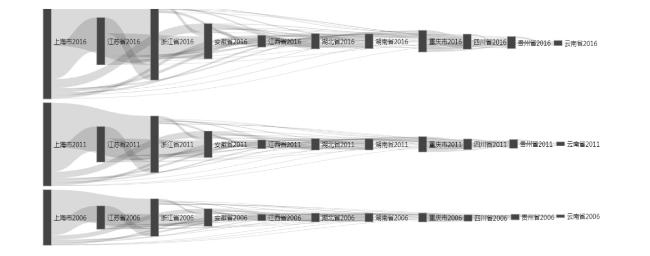
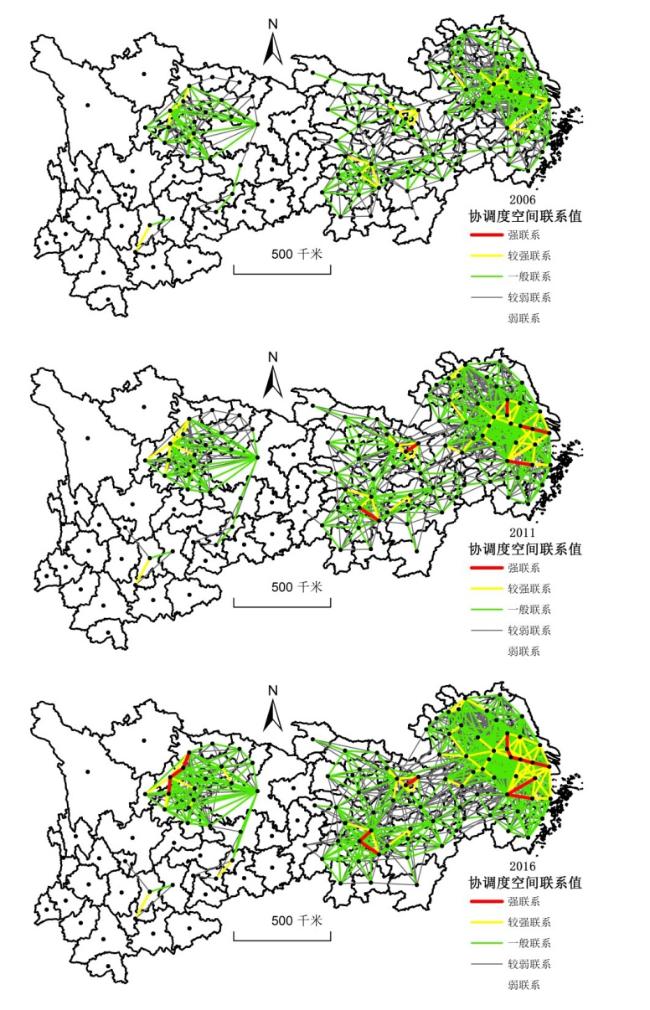
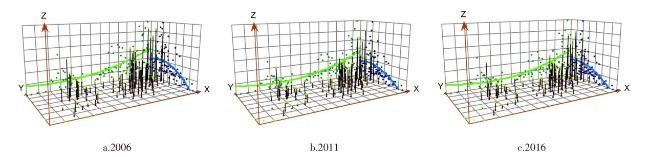
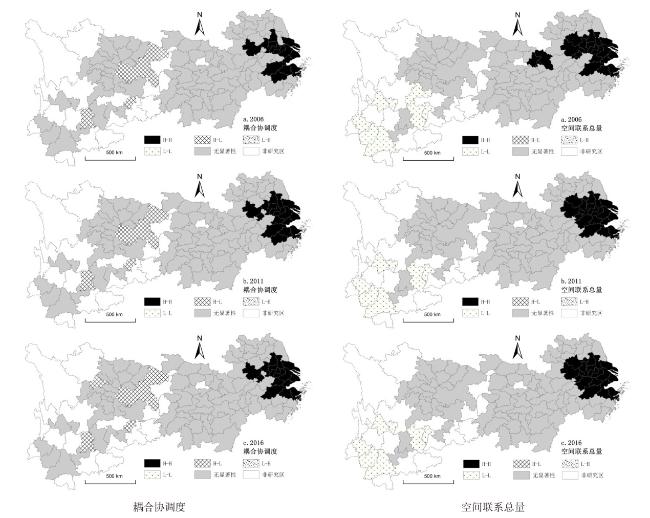
This paper analyzes the spatial linkage characteristics of coupling coordination between regional innovation and regional finance in the Yangtze River Economic Belt by using coupled coordination model, gravity model and trend surface analysis. Based on the spatial Durbin model, it explores the driving factors of coupling and coordination spatial relationship pattern. It is found that: 1) The degree of coupling and coordination between regional innovation and regional finance is gradually improved, and the spatial multi-core model is transformed into a group mode, which presents a high agglomeration feature in space, but the imbalance between the regional innovation and regional finance is still obvious. 2) At the provincial level, the spatial distribution of total amount of spatial linkage shows the imbalance distribution trend which is high in the lower reach and low in the middle and upper reaches; at the prefecture level, the development of spatial linkage networks forms "three groups", and the trend of complication and synergy is obvious. 3) The multi-dimensional proximity effect is obvious. The coupling and coordination of regional innovation and regional finance has a comparative advantage under the information channel. Besides, the basic driving force (industrial basis), the core driving force (government-driven, industry-driven, intellectual-driven) and the external driving force (location advantage, open advantage) have driven the formation of coupling coordination and spatial linkage.
LIU Chengjun , ZHOU Jianping , JIANG Jianhua , WANG Zhouyuanye . Pattern and Driving Force of Regional Innovation and Regional Financial Coupling Coordination in the Yangtze River Economic Belt[J]. Economic geography, 2019 , 39(10) : 94 -103 . DOI: 10.15957/j.cnki.jjdl.2019.10.013
表1 区域创新与区域金融综合评价指标体系Tab.1 The comprehensive evaluation index systemof regional innovation and regional finance |
| 目标层 | 准则层 | 指标层 |
|---|---|---|
| 区域创新 | 创新投入要素 | 财政科学技术支出(元)、科学研究从业人数(人)、当年实际使用外资金额(万美元)、全社会用电量(万kW·h)、普通高等学生人数(人) |
| 创新产出水平 | 城市创新指数(%)、授权专利数(个) | |
| 创新环境要素 | 每百人图书馆藏书量(册百人)、互联网用户数(户)、普通高等学校(个) | |
| 区域金融 | 金融基础规模 | 工业总产值(元)、地区生产总值(元)、固定资产投入(元)、年末户籍人口数(人)、社会消费品零售总额(元) |
| 金融效益水平 | 上市公司数量(个)、年末金融机构贷款余额(元)、年末金融机构存款余额(元)、第三产业占GDP的比重(%) | |
| 绿色金融考量 | 工业废水排放量(t)、工业SO2排放量(t)、工业烟(粉)尘排放量(t) |
表2 空间自相关结果Tab.2 Spatial autocorrelation result |
| 时间 | 耦合协调度的Moran's I指数 | 空间联系总量的Moran's I指数 | |||||
|---|---|---|---|---|---|---|---|
| 邻接权重 | 地理权重 | 信息权重 | 邻接权重 | 地理权重 | 信息权重 | ||
| 2006 | 0.128*** | 0.057*** | 0.327*** | 0.589*** | 0.230*** | 0.184*** | |
| 2007 | 0.139*** | 0.068*** | 0.343*** | 0.597*** | 0.238*** | 0.192*** | |
| 2008 | 0.168*** | 0.080*** | 0.333*** | 0.609*** | 0.243*** | 0.186*** | |
| 2009 | 0.162*** | 0.076*** | 0.340*** | 0.609*** | 0.244*** | 0.190*** | |
| 2010 | 0.169*** | 0.082*** | 0.335*** | 0.619*** | 0.250*** | 0.188*** | |
| 2011 | 0.175*** | 0.087*** | 0.340*** | 0.617*** | 0.252*** | 0.188*** | |
| 2012 | 0.170*** | 0.086*** | 0.345*** | 0.618*** | 0.253*** | 0.192*** | |
| 2013 | 0.173*** | 0.087*** | 0.348*** | 0.626*** | 0.256*** | 0.193*** | |
| 2014 | 0.168*** | 0.083*** | 0.346*** | 0.619*** | 0.253*** | 0.199*** | |
| 2015 | 0.160*** | 0.081*** | 0.342*** | 0.619*** | 0.254*** | 0.200*** | |
| 2016 | 0.153*** | 0.075*** | 0.334*** | 0.607*** | 0.248*** | 0.202*** | |
| 均值 | 0.160*** | 0.078*** | 0.339*** | 0.612*** | 0.247*** | 0.192*** | |
表3 驱动力因素选取Tab.3 Driving factors |
| 一级指标 | 二级指标 | 解释变量 | 变量说明 |
|---|---|---|---|
| 基础驱动力 | 工业基础 | IND | 区域工业总产值(万元) |
| 功能基础 | FUN | 固定资产投资总额(万元) | |
| 核心驱动力 | 智力驱动 | HUM | 金融业与科研事业从业人员总和(万人) |
| 产业驱动 | SER | 第三产业占GDP比重(%) | |
| 政府驱动 | GOV | 地方财政支出(万元) | |
| 外在驱动力 | 开放优势 | OPE | 当年实际使用外资金额(万美元) |
| 区位优势 | COR | 核心城市影响 |
表4 耦合协调度与空间联系格局形成的驱动因素回归结果Tab.4 Regression results of factors influencing the formation of coupling coordination degree and spatial linkage pattern |
| 解释变量 | 耦合协调度 | 空间联系总量 | |||||
|---|---|---|---|---|---|---|---|
| 邻接权重 | 地理权重 | 信息权重 | 邻接权重 | 地理权重 | 信息权重 | ||
| ln(IND) | 0.042***(6.702) | 0.027***(4.824) | 0.038***(6.577) | 0.047***(7.282) | 0.031***(5.708) | 0.045***(7.668) | |
| ln(FUN) | -0.016**(-2.121) | -0.008(-1.258) | -0.029***(-4.761) | -0.021***(-2.844) | -0.011*(-1.755) | -0.038***(-6.08) | |
| ln(HUM) | 0.074***(8.123) | 0.061***(7.312) | 0.075***(8.53) | 0.056***(5.964) | 0.053***(6.536) | 0.061***(6.819) | |
| ln(SER) | 0.106***(4.85) | 0.096***(5.105) | 0.124***(6.535) | 0.113***(5.047) | 0.104***(5.754) | 0.146***(7.579) | |
| ln(GOV) | 0.005(1.185) | 0.008*(1.85) | 0.012***(2.922) | 0.007*(1.604) | 0.008***(1.949) | 0.014***(3.452) | |
| ln(OPEN) | 0.02***(9.157) | 0.019***(10.127) | 0.018***(9.434) | 0.02***(8.828) | 0.019***(10.32) | 0.017***(8.751) | |
| ln(COR) | 0.383***(7.42) | 0.271***(5.721) | 0.324***(9.498) | 0.549***(12.353) | 0.377***(9.722) | 0.600***(20.497) | |
| W ln(IND) | 0.076***(8.162) | 0.159***(4.684) | 0.012(0.854) | 0.094***(9.857) | 0.145***(4.601) | 0.012(0.838) | |
| W ln(FUN) | -0.057***(-5.535) | -0.130***(-4.921) | -0.017(-1.283) | -0.076***(-7.252) | -0.136***(-5.523) | -0.018(-1.287) | |
| W ln(HUM) | 0.062***(3.56) | 0.159***(2.652) | 0.148***(5.755) | 0.005(0.287) | 0.104*(1.694) | 0.113***(4.362) | |
| W ln(SER) | 0.043(1.488) | -0.017(-0.286) | -0.092***(-2.796) | 0.021(0.708) | -0.074(-1.286) | -0.138***(-4.163) | |
| W ln(GOV) | 0.002(0.427) | 0.001(0.042) | -0.011**(-2.112) | 0.002(0.468) | 0.001(0.139) | -0.013**(-2.443) | |
| W ln(OPEN) | 0.004(1.282) | -0.015(-1.147) | 0.008(1.62) | 0.006*(1.716) | -0.019(-1.51) | 0.013**(2.373) | |
| W ln(COR) | 0.136**(2.167) | 0.036(0.244) | 0.025(0.368) | 0.462***(8.108) | 0.192(1.555) | 0.109*(1.801) | |
| W dep.var | -0.236***(-5.8) | 0.535***(6.489) | 0.113**(2.091) | -0.236***(-5.883) | 0.608***(8.966) | 0.133**(2.49) | |
| R2 | 0.988 | 0.990 | 0.989 | 0.998 | 0.999 | 0.998 | |
| log-likelihood | - | 3 319.797 | 3 267.022 | - | 3 359.798 | 3 251.622 | |
| Huausman | 固定效应 | 固定效应 | 固定效应 | 固定效应 | 固定效应 | 固定效应 | |
| [1] |
魏敏, 李书昊. 新时代中国经济高质量发展水平的测度研究[J]. 数量经济技术经济研究, 2018, 35(11):3-20.
|
| [2] |
任保平. 创新中国特色社会主义发展经济学阐释新时代中国高质量的发展[J]. 天津社会科学, 2018(2):12-18.
|
| [3] |
|
| [4] |
|
| [5] |
易信, 刘凤良. 金融发展,技术创新与产业结构转型——多部门内生增长理论分析框架[J]. 管理世界, 2015(10):24-39,90.
|
| [6] |
张玉喜, 赵丽丽. 中国科技金融投入对科技创新的作用效果——基于静态和动态面板数据模型的实证研究[J]. 科学学研究, 2015, 33(2):177-184,214.
|
| [7] |
陆远权, 郑威, 李晓龙. 中国金融业空间集聚与区域创新绩效[J]. 经济地理, 2016, 36(11):93-99,108.
|
| [8] |
景光正, 李平, 许家云. 金融结构,双向FDI与技术进步[J]. 金融研究, 2017(7):62-77.
|
| [9] |
|
| [10] |
|
| [11] |
王龑, 史永东. 科技金融反哺银行业的异质性研究——来自区域性银行的经验证据[J]. 科学学研究, 2017, 35(12):1 821-1 831.
|
| [12] |
张辉, 刘鹏, 于涛, 等. 金融空间分布、异质性与产业布局[J]. 中国工业经济, 2016(12):40-57.
|
| [13] |
李二玲, 崔之珍. 中国区域创新能力与经济发展水平的耦合协调分析[J]. 地理科学, 2018, 38(9):11 412-1 421.
|
| [14] |
徐维祥, 张凌燕, 刘程军, 等. 城市功能与区域创新耦合协调的空间联系研究——以长江经济带107个城市为实证[J]. 地理科学, 2017, 37(11):1 659-1 667.
|
| [15] |
刘承良, 殷美元, 黄丽. 基于多中心性分析的中国交通网络互补性的空间格局[J]. 经济地理, 2018, 38(10):21-28.
|
| [16] |
胡杨, 李郇. 多维邻近性对产学研合作创新的影响——广州市高新技术企业的案例分析[J]. 地理研究, 2017, 36(4):695-706.
|
| [17] |
贺灿飞, 金璐璐, 刘颖. 多维邻近性对中国出口产品空间演化的影响[J]. 地理研究, 2017, 36(9):1 613-1 626.
|
| [18] |
蒋建华, 刘程军, 刘刚, 等. 我国区域信息产业的空间格局及其演化研究[J]. 中国科技论坛, 2014(2):92-97.
|
| [19] |
张玉喜, 张倩. 区域科技金融生态系统的动态综合评价[J]. 科学学研究, 2018, 36(11):1 963-1 974.
|
| [20] |
孟科学, 严清华. 绿色金融与企业生态创新投入结构优化[J]. 科学学研究, 2017, 35(12):1 886-1 895.
|
| [21] |
|
| [22] |
谭俊涛, 张平宇, 李静. 中国区域创新绩效时空演变特征及其影响因素研究[J]. 地理科学, 2016, 36(1):39-46.
|
| [23] |
苏屹, 安晓丽, 王心焕, 等. 人力资本投入对区域创新绩效的影响研究——基于知识产权保护制度门限回归[J]. 科学学研究, 2017, 35(5):771-781.
|
| [24] |
徐维祥, 张凌燕, 杨蕾, 等. 多维邻近下新型城镇化的时空分异特征和驱动机制——以长江经济带为实证[J]. 经济地理, 2017, 37(9):70-79.
|
| [25] |
赵庆. 产业结构优化升级能否促进技术创新效率?[J]. 科学学研究, 2018, 36(2):239-248.
|
| [26] |
徐晓舟, 阮珂. 产业结构,金融发展与省域创新绩效[J]. 科研管理, 2016, 37(4):53-60.
|
/
| 〈 |
|
〉 |