
Regional Differences in the Impact of Early Childhood Migration on Adult Income
Received date: 2019-04-29
Revised date: 2019-08-17
Online published: 2025-04-18
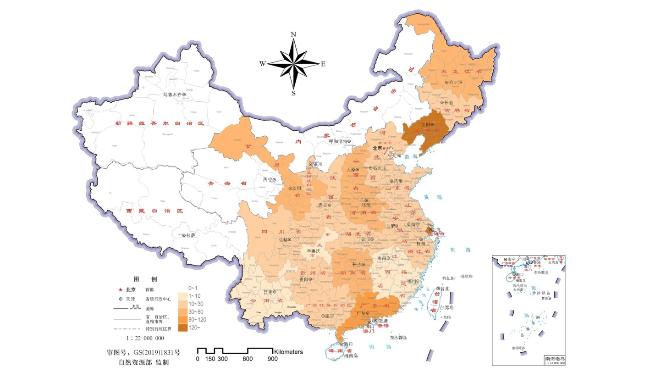
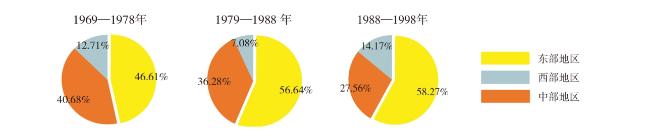
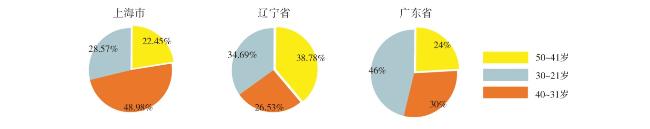
Based on the microscopic survey data of the China Family Tracking Survey (CFPS), a combination of macro and micro analysis. The spatial characteristics of the distribution of young migrants are analyzed from the provincial level and the regional differences in the impact of migration on adult income were compared. The main conclusions include: 1) The overall distribution of the young migrant population is: the western region <the central region <the eastern region, with Shanghai, Liaoning and Guangdong provinces accounting for the highest proportion; 2) The young migrants continue to gather in the eastern region, and the proportion of distribution in the central region has been shrinking, and there is a "central collapse"; 3) Under the influence of human capital and social capital, only the migration to a "good" environment would have a positive effect on adult income.The return on human capital investment in the eastern region is 3.7 percentage points higher than that in the central and western regions;The return on human capital investment in urban areas is 2.9 percentage points higher than in rural areas.Through the mechanism analysis, it is found that the positive effect of juvenile migration on human capital is an important channel that affects adult income.
HAN Lei , LIU Fang , HOU Xinshuo . Regional Differences in the Impact of Early Childhood Migration on Adult Income[J]. Economic geography, 2019 , 39(10) : 36 -42 . DOI: 10.15957/j.cnki.jjdl.2019.10.006
表1 分区域估计幼年迁徙对成年收入的影响Tab.1 Estimation of the impact of juvenile migration on adult income by region |
| (1) | (2) | ||||
|---|---|---|---|---|---|
| 东部地区 | 中西部地区 | 城市地区 | 农村地区 | ||
| 迁徙虚拟变量 | 0.250** | 0.142 | 0.213** | 0.104 | |
| (0.117) | (0.158) | (0.107) | (0.203) | ||
| 常数项 | 9.311*** | 8.440*** | 8.644*** | 9.353*** | |
| (0.646) | (0.627) | (0.597) | (0.694) | ||
| 个人控制变量 | √ | √ | √ | √ | |
| 样本数 | 856 | 837 | 1 065 | 628 | |
表2 人力资本投资回报率差异比较Tab.2 Comparison of the return on investment ratio of human capital |
| (1) | (2) | ||||
|---|---|---|---|---|---|
| 东部地区 | 中西部地区 | 城市地区 | 农村地区 | ||
| 受教育年限 | 0.078*** | 0.041*** | 0.069*** | 0.040*** | |
| (0.008) | (0.007) | (0.007) | (0.010) | ||
| 常数项 | 8.585*** | 7.931*** | 8.114*** | 8.715*** | |
| (0.625) | (0.627) | (0.583) | (0.693) | ||
| 个人控制变量 | √ | √ | √ | √ | |
| 样本数 | 856 | 837 | 1 065 | 628 | |
表3 幼年迁徙对人力资本影响的差异比较Tab.3 Comparison of the impact of juvenile migration on human capital |
| (1) | (2) | ||||
|---|---|---|---|---|---|
| 东部地区 | 中西部地区 | 城市地区 | 农村地区 | ||
| 迁徙虚拟变量 | 1.999*** | 1.575*** | 1.807*** | -0.205 | |
| (0.425) | (0.574) | (0.347) | (0.761) | ||
| 常数项 | 11.967*** | 11.117*** | 11.509*** | 11.975*** | |
| (0.543) | (0.525) | (0.492) | (0.520) | ||
| 个人控制变量 | √ | √ | √ | √ | |
| 样本数 | 856 | 837 | 1 065 | 628 | |
表4 幼年迁徙对社会资本影响的差异比较Tab.4 Comparison of the impact of juvenile migration on social capital |
| (1) | (2) | ||||
|---|---|---|---|---|---|
| 东部地区 | 中西部地区 | 城市地区 | 农村地区 | ||
| 迁徙虚拟变量 | -0.010 | -0.058*** | -0.028* | -0.038** | |
| (0.022) | (0.010) | (0.017) | (0.017) | ||
| 常数项 | 0.093*** | 0.134*** | 0.116*** | 0.111*** | |
| (0.022) | (0.022) | (0.020) | (0.025) | ||
| 个人控制变量 | √ | √ | √ | √ | |
| 样本数 | 856 | 837 | 1 065 | 628 | |
表5 机制分析Tab.5 Mechanism analysis |
| (1) lninco | (2) lninco | (3) lninco | |
|---|---|---|---|
| 迁徙虚拟变量 | 0.103 | 0.097 | 0.086 |
| (0.091) | (0.091) | (0.090) | |
| 受教育年限 | 0.059*** | 0.056*** | 0.053*** |
| (0.006) | (0.007) | (0.006) | |
| 城乡变量 | 0.103** | 0.103** | 0.090* |
| (0.047) | (0.047) | (0.047) | |
| 常数项 | 8.007*** | 7.945*** | 7.799*** |
| (0.481) | (0.483) | (0.484) | |
| 个人控制变量 | √ | √ | √ |
| 父母受教育年限 | × | √ | √ |
| 地区变量 | × | × | √ |
| 样本数 | 1 693 | 1 693 | 1 693 |
表6 稳健性检验Tab.6 Robustness test |
| 变量 | 模型(1) logit模型/ 替换被解 释变量 (train) | 模型(2) ordered logistic模型/变换被解释变量 (educ) | 模型(3) 稳健OLS 模型/增加 控制变量 | 模型(4) logit模型/ 替换被解 释变量 (work-hep) |
|---|---|---|---|---|
| 迁徙虚拟变量 | 0.602** | 0.447*** | 0.786*** | -0.471* |
| (0.258) | (0.156) | (0.280) | (0.272) | |
| 城乡变量 | 0.385*** | 0.804*** | 1.370*** | 0.152 |
| (0.149) | (0.105) | (0.166) | (0.129) | |
| 家庭收入(对数) | 0.836*** | |||
| (0.102) | ||||
| 常数项 | 7.046*** | -1.508 | -0.818*** | |
| (0.777) | (1.159) | (0.295) | ||
| 父母受教育年限 | √ | √ | √ | × |
| 个人控制变量 | √ | √ | √ | √ |
| 地区变量 | √ | √ | √ | √ |
| 样本数 | 1 768 | 1 753 | 1 703 | 1 236 |
| [1] |
王桂新. 中国经济体制改革以来省际人口人口迁移区域模式及其变化[J]. 人口与经济, 2000(3):8-16.
|
| [2] |
刘望保, 汪丽娜, 陈忠暖. 中国省际人口迁移流场及其空间差异[J]. 经济地理, 2012, 32(2):8-13.
|
| [3] |
俞路. 20世纪90年代中国迁移人口分布格局及其空间极化效应[D]. 上海: 华东师范大学, 2006.
|
| [4] |
冯章献, 张瑜, 魏冶, 等. 基于百度迁徙数据的长春市春运人口流动时空格局与动力机制[J]. 经济地理, 2019, 39(5):101-109.
|
| [5] |
Deming, David J. The Growing Importance of Social Skills inthe Labor Market. Quarterly Journal of Economics[J]. 2017, 132(4):1 593-1 640.
|
| [6] |
|
| [7] |
|
| [8] |
孙三百, 黄薇, 洪俊杰. 劳动力自由迁徙为何如此重要?——基于代际收入流动的视角[J]. 经济研究, 2012, 47(5):147-159.
|
| [9] |
李扬, 刘慧, 汤青. 1985—2010年中国省际人口迁移时空格局特征[J]. 地理研究, 2015, 34(6):1 135-1 148.
|
| [10] |
刘新荣. 东北地区人口变动及对经济发展的影响[D]. 长春: 吉林大学, 2011.
|
| [11] |
于婷婷. 东北地区人口迁移与区域经济发展研究[D]. 长春: 东北师范大学, 2017.
|
| [12] |
|
| [13] |
|
| [14] |
|
/
| 〈 |
|
〉 |