
Driving Factors and Mechanism of Rural Tourist Destination Development:Evidence from Changsha City
Received date: 2019-01-10
Revised date: 2019-04-05
Online published: 2025-04-18
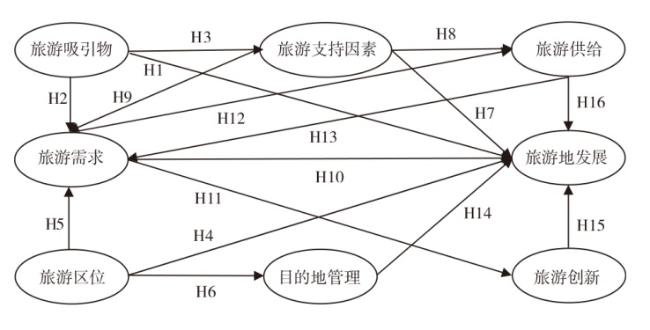
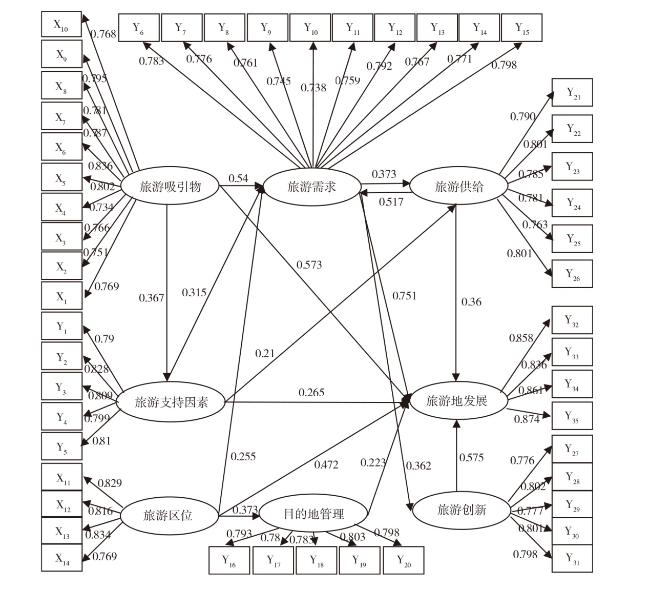
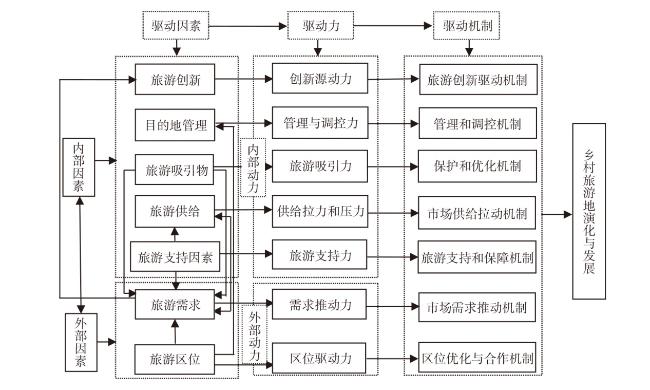
Taking three typical rural tourism destinations as a case and based on eight latent variables (tourism attraction, tourism location, tourism support, tourism demand, destination management, tourism supply, tourism innovation and tourist destination development), this paper builds a structural hypothesis model of rural tourism destination development and applies SEM to explore its driving factors and mechanism. The results are shown as follows: 1) Except of tourism destination and tourism innovation. It all has a direct and indirect positive impacts on tourist destination development. Tourism demand and tourism attraction respectively has the greatest direct and indirect impact, destination management and tourism location respectively has the smallest direct and indirect impacts, tourism demand and destination management respectively has the largest and smallest total effect. 2) Among the two-dimensional influencing factors, core attraction, resource location and traffic location, institutional support, the amount of tourism demand, tourism public service system, tourism supply structure and tourism marketing innovation have more significant positive impacts on the development of rural tourism. 3) The interaction of driving forces and the transformation of dominant forces promote the development of rural tourism destination.
CHEN Zhijun , XU Feixiong . Driving Factors and Mechanism of Rural Tourist Destination Development:Evidence from Changsha City[J]. Economic geography, 2019 , 39(10) : 231 -239 . DOI: 10.15957/j.cnki.jjdl.2019.10.028
表1 量表信度和效度分析结果Tab.1 The analysis results of scale reliability and validity |
| 量表类别 | Cronbach’s Alpha | 项数 | KMO 测度 | Bartlett’s 球形度检验 | ||
|---|---|---|---|---|---|---|
| 卡方检验 | df | Sig. | ||||
| 总量表 | .986 | 49 | .987 | 33 465.646 | 1 176 | .000 |
| 旅游吸引物 | .936 | 10 | .958 | 4 875.539 | 45 | .000 |
| 旅游区位 | .903 | 4 | .849 | 1 885.940 | 6 | .000 |
| 旅游支持因素 | .902 | 5 | .893 | 2 198.027 | 10 | .000 |
| 旅游需求 | .928 | 10 | .961 | 4 360.318 | 45 | .000 |
| 目的地管理 | .901 | 5 | .893 | 2 168.743 | 10 | .000 |
| 旅游供给 | .902 | 6 | .909 | 2 491.657 | 15 | .000 |
| 旅游创新 | .901 | 5 | .893 | 2 173.656 | 10 | .000 |
| 旅游地发展 | .912 | 4 | .856 | 2 020.754 | 6 | .000 |
表2 初始假设模型与修正模型拟合度比较Tab.2 The goodness of fit test between hypothetical model and revised model |
| 拟合指数 | 绝对拟合指标 | 增值拟合指标 | 精简拟合指标 | ||||||||
|---|---|---|---|---|---|---|---|---|---|---|---|
| X2/df | GFI | RMSEA | AGFI | NFI | CFI | IFI | AIC | CAIC | |||
| 理想数值 | 1~3 | >0.90 | <0.10 | >0.90 | >0.90 | >0.90 | >0.90 | 越小越好 | 越小越好 | ||
| 模型M1 | 4.366 | 0.783 | 0.078 | 0.762 | 0.825 | 0.859 | 0.859 | 5 089.924 | 5 669.888 | ||
| 模型M2 | 2.280 | 0.883 | 0.048 | 0.897 | 0.909 | 0.947 | 0.947 | 2 761.544 | 3 368.112 | ||
表3 结构模型验证性因子分析结果Tab.3 Result of confirmatory factor analysis |
| 假设关系 | 影响路径 | 标准化参数估计 | T值(C.R.) | 显著性(P) | 验证结果 |
|---|---|---|---|---|---|
| H1 | 旅游吸引物→旅游地发展 | 0.573 | 5.925 | *** | 正向影响显著 |
| H2 | 旅游吸引物→旅游需求 | 0.540 | 5.617 | *** | 正向影响显著 |
| H3 | 旅游吸引物→旅游支持因素 | 0.367 | 3.739 | *** | 正向影响显著 |
| H4 | 旅游区位→旅游地发展 | 0.472 | 6.735 | *** | 正向影响显著 |
| H5 | 旅游区位→旅游需求 | 0.255 | 3.479 | *** | 正向影响显著 |
| H6 | 旅游区位→目的地管理 | 0.373 | 3.868 | *** | 正向影响显著 |
| H7 | 旅游支持因素→旅游地发展 | 0.265 | 2.419 | *** | 正向影响显著 |
| H8 | 旅游支持因素→旅游供给 | 0.210 | 2.176 | *** | 正向影响显著 |
| H9 | 旅游支持因素→旅游需求 | 0.315 | 3.205 | *** | 正向影响显著 |
| H10 | 旅游需求→旅游地发展 | 0.751 | 7.241 | *** | 正向影响显著 |
| H11 | 旅游需求→旅游创新 | 0.362 | 3.486 | *** | 正向影响显著 |
| H12 | 旅游需求→旅游供给 | 0.373 | 3.868 | *** | 正向影响显著 |
| H13 | 旅游供给→旅游需求 | 0.517 | 5.521 | *** | 正向影响显著 |
| H14 | 目的地管理→旅游地发展 | 0.223 | 2.482 | *** | 正向影响显著 |
| H15 | 旅游供给→旅游地发展 | 0.360 | 3.419 | *** | 正向影响显著 |
| H16 | 旅游创新→旅游地发展 | 0.575 | 5.965 | *** | 正向影响显著 |
表4 变量的直接效应、间接效应和总效应Tab.4 Direct effect, indirect effect and total effect |
| 影响路径 | 直接效应 | 间接效应 | 总效应 |
|---|---|---|---|
| 旅游吸引物→旅游地发展 | 0.573 | 0.503 | 1.076 |
| 旅游区位→旅游地发展 | 0.472 | 0.275 | 0.747 |
| 旅游支持因素→旅游地发展 | 0.265 | 0.312 | 0.577 |
| 旅游需求→旅游地发展 | 0.751 | 0.342 | 1.093 |
| 目的地管理→旅游地发展 | 0.223 | - | 0.223 |
| 旅游供给→旅游地发展 | 0.360 | 0.388 | 0.748 |
| 旅游创新→旅游地发展 | 0.575 | - | 0.575 |
| [1] |
|
| [2] |
韩非, 蔡建明, 刘军萍. 大都市郊区乡村旅游地发展的驱动力分析——以北京市为例[J]. 干旱区资源与环境, 2010, 24(11):195-200.
|
| [3] |
吴琼莉. 中国乡村旅游发展动力系统研究——以浙江县安吉县为例[D]. 杭州: 浙江工商大学, 2008.
|
| [4] |
赵铭. 乡村旅游发展动力系统研究——以黑龙江省为例[D]. 哈尔滨: 东北农业大学, 2015.
|
| [5] |
|
| [6] |
|
| [7] |
张金华, 林秀梅. 基于面板协整模型分析的旅游需求影响因素研究——以日本入华旅游为例[J]. 工业技术经济, 2012(7):36-40.
|
| [8] |
张敦富. 区域经济学原理[M]. 北京: 中国轻工业出版社, 1999.
|
| [9] |
喻胜华, 杨薇. 基于结构方程的区域旅游产业竞争力评价模型[J]. 大连理工大学学报:社会科学版, 2011, 31(4):44-47.
|
| [10] |
孟娟. 基于结构方程的山西城市旅游竞争力评价研究[D]. 太原: 山西财经大学, 2011.
|
| [11] |
邹统钎, 王欣, 等. 旅游目的地管理[M]. 北京: 北京师范大学出版社, 2012.
|
| [12] |
保继刚, 楚义芳. 旅游地理学—修订版[M]. 北京: 高等教育出版社, 1999.
|
| [13] |
王淑新, 王学定. 供需视角下的中国旅游经济发展——一个面板数据的实证分析[J]. 经济问题探索, 2014(1):184-190.
|
| [14] |
ChokriOuerfelli. Co-inergration analysis of quarterly Europentourism demand in Tunisia[J]. Tourism Management, 2008, 29(1):127-137.
|
| [15] |
刘静, 刘耀龙, 段锦. 基于5A景区最大承载量和游客接待量的旅游供需关系模型研究[J]. 科技通报, 2017, 33(7):264-268.
|
| [16] |
|
| [17] |
田里. 旅游经济学(第二版)[M]. 北京: 高等教育出版社, 2006:86.
|
| [18] |
|
| [19] |
|
| [20] |
|
| [21] |
宋慧林, 宋海岩. 中国旅游创新与旅游经济增长关系研究——基于空间面板数据模型[J]. 旅游科学, 2011, 25(2):23-29.
|
| [22] |
|
| [23] |
葛学峰, 武春友. 乡村旅游偏好差异测量研究:基于离散选择模型[J]. 旅游学刊, 2010, 25(1):48-52.
|
| [24] |
迈克尔·波特. 国家竞争优势[M]. 北京: 华夏出版社, 2002:116-120.
|
| [25] |
王莹, 许晓晓. 社区视角下乡村旅游发展的影响因子——基于杭州的调研[J]. 经济地理, 2015, 35(3):203-208.
|
| [26] |
苏勤, 钱树伟. 世界遗产地旅游者地方感影响关系及机理分析——以苏州古典园林为例[J]. 地理学报, 2012, 67(8):1 137-1 148.
|
/
| 〈 |
|
〉 |