
Spatial Pattern and Dynamic Distribution of Tourism Resources in European Union,1992-2016
Received date: 2019-01-03
Revised date: 2019-03-25
Online published: 2025-04-18
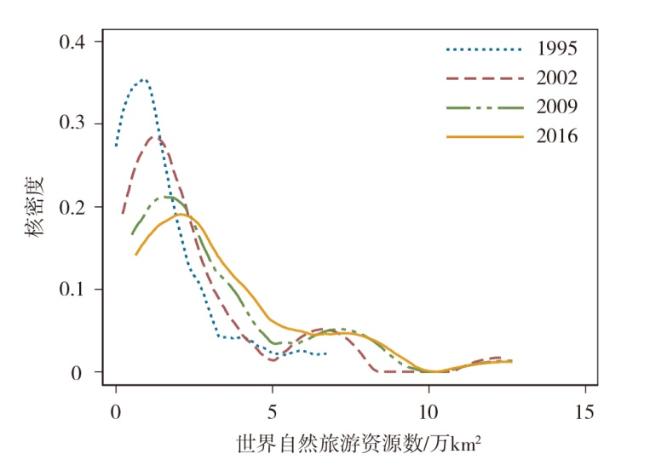
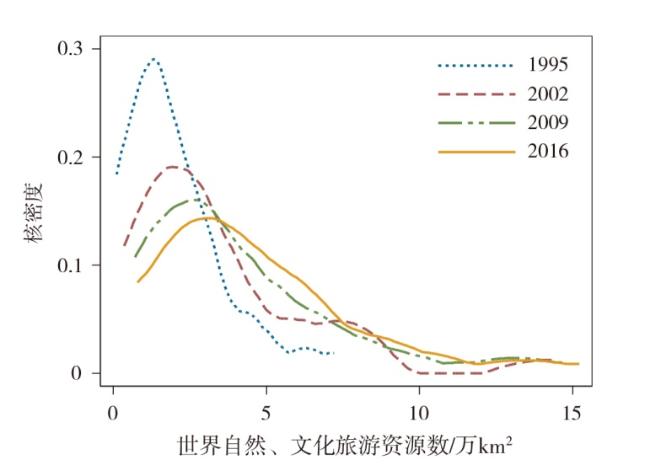
The spatial pattern and dynamic distribution of tourism resources have become one of the important issues in tourism research because it is the basis of scientific evaluation and sustainable development of tourism resources. This paper applies ArcGIS10.3 and Stata14 to analyze spatial pattern and dynamic distribution of tourism resources in European Union from 1992 to 2016. The results showed that: 1) European Union's international tourism resources are divided into four regions: Northern Europe, Western Europe, Central/Eastern Europe, and Southern/Medit. Europe, which constitute three zones: the coastal areas of the North Sea coast, Danube Basin and Mediterranean coast. Beihai coast. The natural tourist resources of the European Union are distributed along the coast and the great rivers. The EU's cultural tourism resources are enriched in all sub cultures. 2) Kernel Density Estimation shows that the development and protection of international tourism resources in the European Union generally grow faster and tend to be balanced, in which the number of cultural tourism resources increased significantly in 2002 than in 1995, the distribution of natural tourism resources tends to be balanced and multi-polarized. 3) The heterogeneity and integrity of tourism resources determine the necessity of transnational cooperation, development and protection of tourism resources Schengen visa policy promotes exploiting of tourism resources and the development of tourism economy in the European Union. The level of economic development, accessibility, cultural differences and security considerations influences the development of international tourism.
XIE Wujie , HE Jianmin . Spatial Pattern and Dynamic Distribution of Tourism Resources in European Union,1992-2016[J]. Economic geography, 2019 , 39(10) : 193 -203 . DOI: 10.15957/j.cnki.jjdl.2019.10.024
表1 欧盟国际旅游到达和国际旅游收入Tab.1 International tourist arrivals and tourism receipts by generating region |
| 国际旅游到达 (万人次) | 国际旅游收入 (亿美元) | 人均收入 (美元) (2016) | ||||
|---|---|---|---|---|---|---|
| 2015 | 2016 | 2015 | 2016 | |||
| 世界 | 118 900 | 123 500 | 11 960 | 12 200 | 990 | |
| 欧洲 | 60 370 | 61 620 | 4 496 | 4 473 | 730 | |
| 欧盟-28 | 47 780 | 50 010 | 3 721 | 3 766 | 750 | |
| 亚洲太平洋 | 28 400 | 30 840 | 3 494 | 3 667 | 1 190 | |
| 美洲 | 19 260 | 19 930 | 3 056 | 3 132 | 1 570 | |
| 非洲 | 5 340 | 5 780 | 348 | 348 | 600 | |
| 中东 | 5 560 | 5 360 | 576 | 576 | 1 080 | |
资料来源:UNWTO Tourism Highlights 2017 edition。 |
表2 国际入境游客人数和国际入境旅游收入排名(国别)Tab.2 International tourist arrivals/international tourism receipts by country |
| 排名 | 国际入境游客人数 | 排名 | 国际入境旅游收入 | |||||||
|---|---|---|---|---|---|---|---|---|---|---|
| 总量(万人次) | 变化率(%) | 总量(亿美元) | 变化率(%) | |||||||
| 2015 | 2016 | 2015/2014 | 2016/2015 | 2015 | 2016 | 2015/2014 | 2016/2015 | |||
| 1法国 | 8 450 | 8 260 | 0.9 | -2.2 | 1美国 | 2 054 | 2 059 | 7.0 | 0.3 | |
| 2美国 | 7 750 | 7 560 | 3.3 | -2.4 | 2西班牙 | 565 | 603 | -13.3 | 6.9 | |
| 3西班牙 | 6 850 | 7 560 | 5.5 | 10.3 | 3泰国 | 449 | 499 | 16.9 | 11.0 | |
| 4中国 | 5 690 | 5 930 | 2.3 | 4.2 | 4中国 | 450 | 444 | 2.1 | -1.2 | |
| 5意大利 | 5 070 | 5 240 | 4.4 | 3.2 | 5法国 | 449 | 425 | -22.9 | -5.3 | |
| 6英国 | 3 440 | 3 580 | 5.6 | 4.0 | 6意大利 | 394 | 402 | -13.3 | 2.0 | |
| 7德国 | 3 500 | 3 560 | 6.0 | 1.7 | 7英国 | 455 | 396 | -2.3 | -12.9 | |
| 8墨西哥 | 3 210 | 3 500 | 9.4 | 8.9 | 8德国 | 369 | 374 | -14.8 | 1.4 | |
| 9泰国 | 2 990 | 3 260 | 20.6 | 8.9 | 9中国香港 | 362 | 329 | -5.8 | -9.1 | |
| 10土耳其 | 3 950 | -0.8 | 10澳大利亚 | 289 | 324 | -8.2 | 12.3 | |||
资料来源:世界旅游组织数据库。 |
表3 欧盟国际旅游资源数量与构成(2016)Tab.3 Quantity and composition of EU’s international tourism resources in 2016 |
| 自然旅游资源 | 合计 | 文化旅游资源 | 合计 | |||
|---|---|---|---|---|---|---|
| 人与生物圈保护区 | 国际重要湿地 | 世界自然遗产 | 世界文化遗产 | |||
| EU-28数量(处) | 176 | 814 | 34 | 1 024 | 338 | 1 362 |
| 全球数量(处) | 669 | 2 271 | 238 | 3 178 | 849 | 4 027 |
| 占比(%) | 26.3 | 35.8 | 14.3 | 32.2 | 39.8 | 33.8 |
资料来源:依据联合国教育、科学及文化组织(UNESCO)数据整理;鉴于世界自然文化双遗产数量较少,重复统计对旅游资源分布影响较小,因此在世界自然遗产和世界文化遗产中各计数一次。 |
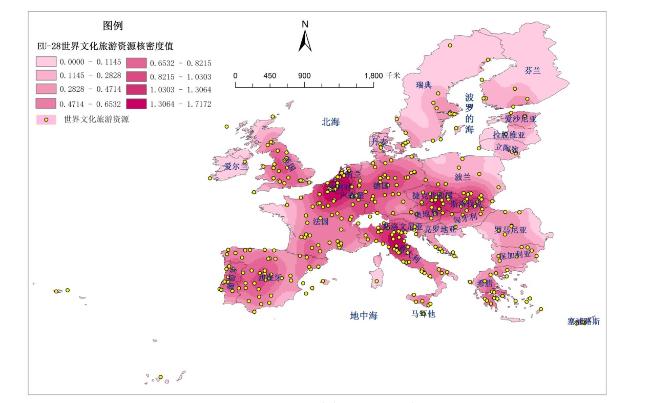
图1 欧盟文化旅游资源核密度分布Fig.1 Kernel density estimation of cultural tourism resources in EU |
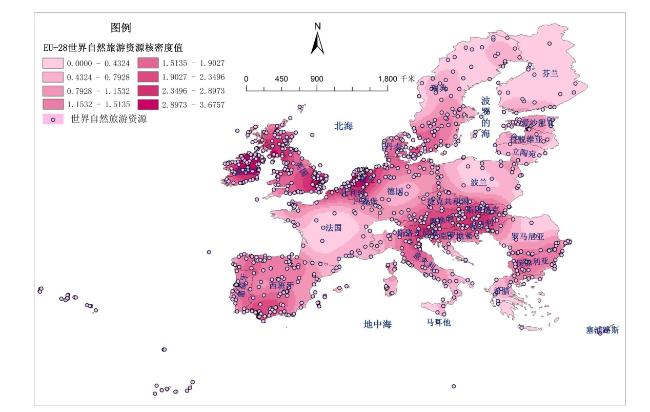
图2 欧盟自然旅游资源核密度分布Fig.2 Kernel density estimation of natural tourism resources in EU |
表4 欧盟国家发展进程与分组Tab.4 Development process and grouping of EU countries |
| 国家 | 加入欧盟时间 | 加入欧元区时间 | 加入申根区时间 | IMF分类(发达/新兴) | |
|---|---|---|---|---|---|
| 北欧 | 丹麦 | 1973 | 2001 | 发达 | |
| 芬兰 | 1995 | 2002 | 2001 | 发达 | |
| 爱尔兰 | 1973 | 2002 | 发达 | ||
| 瑞典 | 1995 | 2001 | 发达 | ||
| 英国 | 1973 | 发达 | |||
| 西欧 | 奥地利 | 1995 | 2002 | 1997 | 发达 |
| 比利时 | 1958 | 2002 | 1995 | 发达 | |
| 法国 | 1958 | 2002 | 1995 | 发达 | |
| 德国 | 1958 | 2002 | 1995 | 发达 | |
| 卢森堡 | 1958 | 2002 | 1995 | 发达 | |
| 荷兰 | 1958 | 2002 | 1995 | 发达 | |
| 中/东欧 | 保加利亚 | 2007 | 新兴经济体 | ||
| 捷克 | 2004 | 2007 | 发达 | ||
| 爱沙尼亚 | 2004 | 2011 | 2007 | 发达 | |
| 匈牙利 | 2004 | 2007 | 新兴经济体 | ||
| 拉脱维亚 | 2004 | 2014 | 2007 | 发达 | |
| 立陶宛 | 2004 | 2015 | 2007 | 发达 | |
| 波兰 | 2004 | 2007 | 新兴经济体 | ||
| 罗马尼亚 | 2007 | 新兴经济体 | |||
| 斯洛伐克 | 2004 | 2009 | 2007 | 发达 | |
| 南/地中海欧洲 | 克罗地亚 | 2013 | 新兴经济体 | ||
| 塞浦路斯 | 2004 | 2008 | 发达 | ||
| 希腊 | 1981 | 2002 | 2000 | 发达 | |
| 意大利 | 1958 | 2002 | 1997 | 发达 | |
| 马耳他 | 2004 | 2008 | 2007 | 发达 | |
| 葡萄牙 | 1986 | 2002 | 1995 | 发达 | |
| 斯洛文尼亚 | 2004 | 2007 | 2007 | 发达 | |
| 西班牙 | 1986 | 2002 | 1995 | 发达 |
资料来源:《European Union Tourism Trends》。 |
| [1] |
|
| [2] |
|
| [3] |
|
| [4] |
|
| [5] |
|
| [6] |
|
| [7] |
|
| [8] |
|
| [9] |
|
| [10] |
|
| [11] |
|
| [12] |
汪德根. 呼伦贝尔—阿尔山旅游区旅游资源空间结构研究[J]. 干旱区地理, 2008(3):456-463.
|
| [13] |
王录仓, 杨志鹏, 武荣伟, 等. 甘肃黄河三峡景区旅游资源空间结构研究[J]. 干旱区研究, 2016, 33(1):215-222.
|
| [14] |
吴清, 李细归, 吴黎, 等. 湖北武陵山区旅游资源空间格局及开发研究[J]. 湖南师范大学自然科学学报, 2017, 40(2):17-24.
|
| [15] |
向宝惠, 张爱平. 黄河源区旅游资源空间特征分析与开发对策研究[J]. 西北师范大学学报:自然科学版, 2017, 53(5):121-127.
|
| [16] |
魏少琴, 贾铁飞. 杭州市旅游资源空间分析及其整合[J]. 旅游科学, 2005(6):21-26.
|
| [17] |
李中轩, 吴国玺. 洛阳市旅游资源的空间结构及其演化模式[J]. 地域研究与开发, 2012, 31(4):107-109.
|
| [18] |
程海峰, 胡文海. 池州市A级旅游景区空间结构[J]. 地理科学, 2014, 34(10):1 275-1 280.
|
| [19] |
左昕昕, 靳鹤龄, 严江平. 兰州市旅游资源空间结构研究[J]. 干旱区资源与环境, 2007(11):151-156.
|
| [20] |
李亚娟, 陈田, 王婧. 黔东南州旅游吸引物空间结构研究[J]. 资源科学, 2013, 35(4):858-867.
|
| [21] |
敬峰瑞, 孙虎, 袁超. 成都市旅游资源吸引力空间结构特征[J]. 资源科学, 2017, 39(2):303-313.
|
| [22] |
章锦河, 赵勇. 皖南旅游资源空间结构分析[J]. 地理与地理信息科学, 2004(1):99-103.
|
| [23] |
黄远水, 陈钢华, 伍弦. 福建省旅游景区空间结构研究——基于国家3A级以上旅游景区的统计分析[J]. 经济地理, 2010, 30(7):1 195-1 199.
|
| [24] |
程胜龙, 陈思源, 马交国, 等. 甘肃旅游资源类型及其空间结构研究[J]. 人文地理, 2008(4):105-111.
|
| [25] |
吴清, 李细归, 吴黎, 等. 湖南省A级旅游景区分布格局及空间相关性分析[J]. 经济地理, 2017, 37(2):193-200.
|
| [26] |
许辉, 杨洁明, 喻晓玲. 新疆优质旅游资源空间格局及影响机制[J]. 地域研究与开发, 2016, 35(1):96-101.
|
| [27] |
卞显红. 长江三角洲国家AAAA级旅游区空间结构[J]. 经济地理, 2007(1):157-160.
|
| [28] |
王洪桥, 袁家冬, 孟祥君. 东北地区A级旅游景区空间分布特征及影响因素[J]. 地理科学, 2017, 37(6):895-903.
|
| [29] |
吴春涛, 李隆杰, 何小禾, 等. 长江经济带旅游景区空间格局及演变[J]. 资源科学, 2018, 40(6):1 196-1 208.
|
| [30] |
王灵恩, 何露, 成升魁, 等. 澜沧江流域旅游资源空间分异与发展模式探讨[J]. 资源科学, 2012, 34(7):1 266-1 276.
|
| [31] |
吴必虎, 唐子颖. 旅游吸引物空间结构分析——以中国首批国家4A级旅游区(点)为例[J]. 人文地理, 2003(1):1-5.
|
| [32] |
熊杰, 章锦河, 周臖, 等. 中国红色旅游景点的时空分布特征[J]. 地域研究与开发, 2018, 37(2):83-88.
|
| [33] |
瓦哈甫·哈力克, 辛龙, 等. 旅游资源诅咒时空分异及驱动力研究——基于省际面板数据的GWR模型分析[J]. 生态经济, 2019, 35(2):160-167.
|
| [34] |
郭鹏, 董锁成, 李泽红, 等. 丝绸之路经济带旅游业格局与国际旅游合作模式研究[J]. 资源科学, 2014, 36(12):2 459-2 467.
|
| [35] |
周李, 吴殿廷, 李泽红, 等. 中蒙俄经济走廊自然旅游资源格局及影响因素研究[J]. 资源科学, 2018, 40(11):2 168-2 176.
|
| [36] |
|
| [37] |
UNWTO. UNWTO tourism highlights (2017 edition)[M]. Ma-drid:UNWTO. 2017:06-06.
|
| [38] |
|
| [39] |
|
| [40] |
李志勇. 客源国概况[M]. 成都: 四川大学出版社, 2002.
|
/
| 〈 |
|
〉 |