
Evaluation on the Effect of Industrial Poverty Alleviation in China's Main Potato Producing Areas under Price Fluctuations
Received date: 2018-08-29
Revised date: 2019-03-08
Online published: 2025-04-18
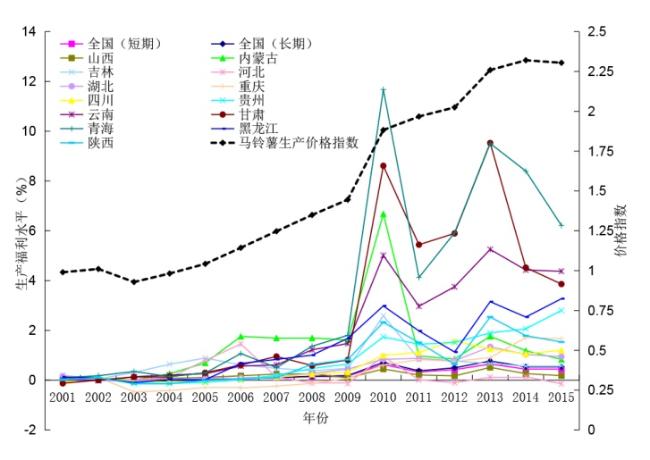
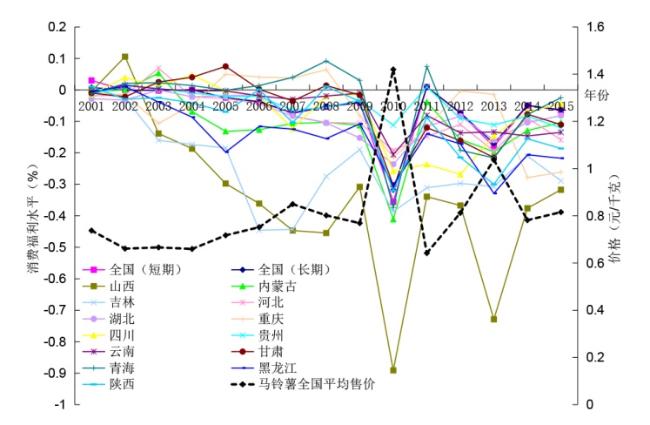
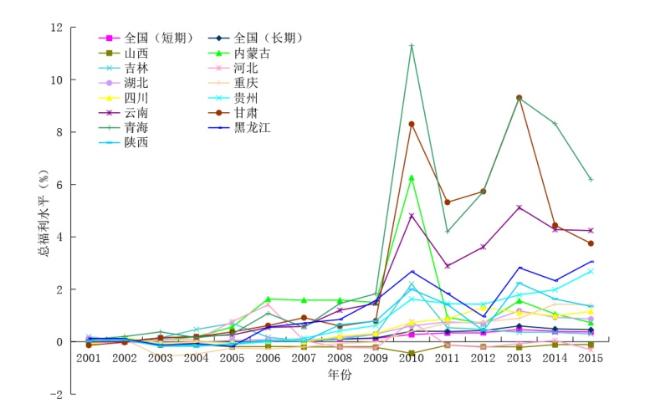
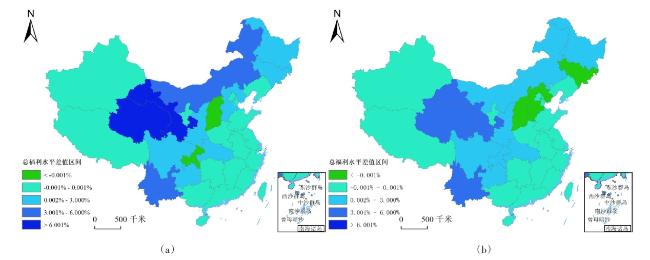
Based on the panel data in the main production area and the national data of the potato from 2001 to 2015, this paper calculates farmers' production welfare effect, consumption welfare effect and general welfare effect of potato price fluctuation. It is used to evaluate the poverty reduction effect of potato industry. The research results show that: 1) The impact of potato production price fluctuation on the increase of the farmers' production welfare is greater the impact of potato sale price fluctuation on the decrease of farmers' consumption welfare, the trend of farmers' general welfare is similar to the production welfare. 2) There are differences in farmers' total welfare among the provinces in the main producing areas, which are mainly determined by the influencing factors of farmers' production welfare. The potato production price is the main factor that affects farmers' production welfare. The support policy for potato industry causes the increase of the production price and the total welfare of farmers, the poverty reduction effect is significant. 3) With the increasing demand for potatoes, the impact of price fluctuations on farmers' total welfare will gradually increase. In addition, the proportion of labor costs in production costs has been increasing in recent years. As a result, the potential to improve the farmers' total welfare by raising production prices will gradually decrease, and the poverty reduction effect will also gradually decrease.
LI Jingdong , SONG Zhouying , LI Xiande , WANG Shihai . Evaluation on the Effect of Industrial Poverty Alleviation in China's Main Potato Producing Areas under Price Fluctuations[J]. Economic geography, 2019 , 39(10) : 162 -171 . DOI: 10.15957/j.cnki.jjdl.2019.10.021
表1 主产省面板数据单位根检验结果Tab.1 The unit root test of provincial panel data |
| 变量 | LLC检验 | IPS检验 | ADF-Fisher检验 | PP-Fisher检验 | 结论 | |
|---|---|---|---|---|---|---|
| 供给模型 | lnPOTQ | -4.486(0.000) | -2.799(0.003) | 41.880(0.007) | 44.985(0.003) | 平稳 |
| lnSAR | -3.336(0.000) | -0.437(0.331) | 24.265(0.333) | 35.949(0.031) | 不平稳 | |
| ΔlnSAR | -11.053(0.000) | -5.915(0.000) | 70.545(0.000) | 126.650(0.000) | 平稳 | |
| lnCFIN | -3.846(0.000) | -1.686(0.046) | 35.402(0.035) | 45.995(0.002) | 平稳 | |
| lnDISA | -7.695(0.000) | -3.997(0.000) | 53.148(0.000) | 59.330(0.000) | 平稳 | |
| lnEXF | -5.365(0.000) | -2.887(0.002) | 42.622(0.005) | 41.885(0.007) | 平稳 | |
| lnAPLY | -2.392(0.008) | -0.171(0.432) | 19.422(0.619) | 20.250(0.567) | 不平稳 | |
| ΔlnAPLY | -11.299(0.000) | -9.384(0.000) | 117.605(0.000) | 193.403(0.000) | 平稳 | |
| 消费模型 | lnADPOT | -11.520(0.000) | -7.002(0.000) | 74.861(0.000) | 99.765(0.000) | 平稳 |
| lnAINC | -11.359(0.000) | -6.309(0.000) | 71.819(0.000) | 106.001(0.000) | 平稳 | |
| lnAPN | -5.627(0.000) | -2.029(0.021) | 37.339(0.022) | 55.372(0.000) | 平稳 |
注:“Δ”表示一阶差分序列;括号内为各序列对应检验方式的P值;检验过程中按SIC准则来确定变量的滞后阶数。 |
表2 LnSAR和LnAPLY序列的协整检验Tab.2 Cointegration test based on the data of LnSAR and LnAPLY |
| 检验方法 | 检验假设 | 统计量名称 | 统计量值(P值) |
|---|---|---|---|
| Pedroni检验 | H0:无协整关系 | Panel v-Statistic | 6.17(0.000) |
| H1:有协整关系 (同质面板) | Panel rho-Statistic | -2.101(0.018) | |
| Panel PP-Statistic | -4.301(0.000) | ||
| Panel ADF-Statistic | -3.882(0.000) | ||
| H0:无协整关系 | Group rho-Statistic | -0.082(0.467) | |
| H1:有协整关系 (异质面板) | Group PP-Statistic | -2.660(0.004) | |
| Group ADF-Statistic | -2.494(0.006) | ||
| Kao检验 | H0:无协整关系 | ADF | -6.389(0.000) |
| Johansen面板协整检验 | H0:0个协整向量 | Fisher联合迹统计量 | 149.7(0.000) |
| H0:至少1个协整向量 | Fisher联合迹统计量 | 131.6(0.000) |
表3 马铃薯供给模型和消费模型的截面系数省际差异Tab.3 Interprovincial differences in the cross section coefficient of the potato supply model and the consumption model |
| 马铃薯供给模型的截面系数省际差异 | 马铃薯消费模型的截面系数省际差异 | |||||||||
|---|---|---|---|---|---|---|---|---|---|---|
| 省份 | t统计量 | P值 | 省份 | t统计量 | P值 | |||||
| 河北 | -1.153 | 0.242 | 3.667*** | 0.000 | 河北 | -5.652 | -0.241 | -4.118*** | 0.000 | |
| 山西 | -2.392 | 0.139 | 3.431*** | 0.000 | 山西 | -4.937 | -0.368 | -1.912* | 0.058 | |
| 内蒙古 | -1.407 | 0.361 | 2.679*** | 0.008 | 内蒙古 | -5.558 | -0.189 | -2.106** | 0.037 | |
| 吉林 | -1.688 | 0.582 | 2.868*** | 0.005 | 吉林 | -5.205 | -0.278 | -1.428 | 0.156 | |
| 黑龙江 | -2.009 | 0.299 | 3.101*** | 0.000 | 黑龙江 | -4.663 | -0.442 | -2.331** | 0.021 | |
| 湖北 | -1.773 | 0.475 | 1.877* | 0.062 | 湖北 | -5.772 | -0.098 | -0.482 | 0.630 | |
| 重庆 | -1.746 | 0.292 | 0.775 | 0.439 | 重庆 | -5.348 | -0.293 | -4.387*** | 0.000 | |
| 四川 | -1.250 | 0.251 | 1.832* | 0.068 | 四川 | -5.257 | -0.591 | -2.802*** | 0.006 | |
| 贵州 | -1.810 | 0.273 | 2.091** | 0.038 | 贵州 | -5.988 | -0.354 | -1.295 | 0.197 | |
| 云南 | -1.443 | 0.335 | 2.244** | 0.026 | 云南 | -5.701 | -0.511 | -2.033** | 0.044 | |
| 陕西 | -1.639 | 0.152 | 0.683 | 0.495 | 陕西 | -5.318 | -0.427 | -3.107*** | 0.002 | |
| 甘肃 | -1.291 | 0.555 | 5.368*** | 0.000 | 甘肃 | -5.191 | -0.579 | -3.161*** | 0.002 | |
| 青海 | -2.141 | 0.264 | 1.820* | 0.071 | 青海 | -5.251 | -0.409 | -2.302** | 0.023 | |
注: 、 表示个体固定效应; 、 分别为 和 的系数;*、**、***分别表示在10%、5%、1%水平上显著。 |
| [1] |
卢肖平. 马铃薯主粮化战略的意义、瓶颈与政策建议[J]. 华中农业大学学报:社会科学版, 2015(3):1-7.
|
| [2] |
陈忠言. 中国农村开发式扶贫机制解析——以沪滇合作为例[J]. 经济问题探索, 2015(2):90-94.
|
| [3] |
申红兴. 青海藏区产业减贫的主体及路径分析[J]. 青海社会科学, 2015(5):172-178.
|
| [4] |
申云, 彭小兵. 链式融资模式与精准扶贫效果——基于准实验研究[J]. 财经研究, 2016, 42(9):4-15.
|
| [5] |
李志萌, 张宜红. 革命老区产业扶贫模式、存在问题及破解路径——以赣南老区为例[J]. 江西社会科学, 2016(7):61-67.
|
| [6] |
范东君. 精准扶贫视角下我国产业扶贫现状、模式与对策探析——基于湖南省湘西州的分析[J]. 中共四川省委党校学报, 2016(4):74-78.
|
| [7] |
汪三贵, 张雁, 杨龙, 等. 连片特困地区扶贫项目到户问题研究——基于乌蒙山片区三省六县的调研[J]. 中州学刊, 2015(3):68-72.
|
| [8] |
陈秋华, 纪金雄. 乡村旅游精准扶贫实现路径研究[J]. 福建论坛(人文社会科学版), 2016(5):196-200.
|
| [9] |
张琳, 童翔宇, 杨毅. 湘鄂渝黔边民族地区精准扶贫效益评价及增进策略——基于结构方程模型的实证分析[J]. 贵州民族研究, 2017(1):177-180.
|
| [10] |
陈清华, 董晓林, 朱敏杰. 村级互助资金扶贫效果分析——基于宁夏地区的调查数据[J]. 农业技术经济, 2017(2):51-60.
|
| [11] |
李烨. 中国乡村旅游业扶贫效率研究[J]. 农村经济, 2017(5):72-78.
|
| [12] |
陈成文, 陈建平, 陶纪坤. 产业扶贫:国外经验及其政策启示[J]. 经济地理, 2018, 38(1):127-134.
|
| [13] |
王立剑, 叶小刚, 陈杰. 精准识别视角下产业扶贫效果评估[J]. 中国人口·资源与环境, 2018(1):113-123.
|
| [14] |
陈聪, 程李梅. 产业扶贫目标下连片贫困地区公共品有效供给研究[J]. 农业经济问题, 2017(10):44-51.
|
| [15] |
马铃, 万广华. 为什么贫困农户种植业收入低下[J]. 农业技术经济, 2012(5):4-13.
|
| [16] |
罗其友, 刘洋, 高明杰, 等. 中国马铃薯产业现状与前景[J]. 农业展望, 2015, 11(3):35-40.
|
| [17] |
蔡海龙. 我国马铃薯价格波动的原因探析[J]. 价格理论与实践, 2013(9):64-65.
|
| [18] |
李京栋, 李先德, 王士海. 主粮化背景下马铃薯价格波动的金融化因素分析[J]. 华中农业大学学报:社会科学版, 2017(4):13-21.
|
| [19] |
王芳兰. 对马铃薯产业化发展与精准扶贫的认识[J]. 农业科技与信息, 2016(14):4-4.
|
| [20] |
彭忠华. 发展贵州马铃薯产业,助推精准扶贫[C]. 马铃薯产业与精准扶贫2017, 2017:34-38.
|
| [21] |
杨照, 张正尧. 产业精准扶贫评价体系构建及研究——基于14个贫困县的调查[J]. 中国农业资源与区划, 2018, 39(3):179-184.
|
| [22] |
|
| [23] |
余永定, 李军. 中国居民消费函数的理论与验证[J]. 中国社会科学, 2000(1):123-133.
|
| [24] |
杨军, 程申, 杨博琼, 等. 日韩粮食消费结构变化特征及对我国未来农产品需求的启示[J]. 中国软科学, 2013(1):24-31.
|
| [25] |
易晓峰, 罗其友. 基于三阶段DEA的中国马铃薯主产区生产效率分析[J]. 中国农学通报, 2015(3):270-276.
|
| [26] |
钟鑫, 蒋和平, 张忠明. 我国马铃薯主产区比较优势及发展趋势研究[J]. 中国农业科技导报, 2016(2):1-8.
|
| [27] |
李志平, 郭景山, 宁怀宝. 2016年内蒙古马铃薯产业现状、存在问题及发展建议[C]. 马铃薯产业与精准扶贫2017, 2017:96-100.
|
| [28] |
王平, 屈会娟, 沈学善, 等. 四川省发展马铃薯产业助力精准扶贫[C]. 马铃薯产业与精准扶贫2017, 2017:127-131.
|
/
| 〈 |
|
〉 |