
Vehicle Structure and Eco-Efficiency:Based on the Dynamic Spatial Durbin Model
Received date: 2019-04-15
Revised date: 2019-09-04
Online published: 2025-04-18
This paper adopts super-efficiency SBM model to calculate the regional eco-efficiency value of 30 provinces in China from 2004 to 2015, and then test the impact of vehicle structure on eco-efficiency based on dynamic spatial Durbin model. The study shows that the passenger traffic structure represented by the proportion of public transport significantly reduces the eco-efficiency of local province and neighboring provinces, but with the further improvement of the structure, this inhibitory effect will gradually weaken and finally become a promoting effect. The influence of freight transport structure represented by highway transportation proportion on eco-efficiency depends on local economic development degree and urbanization level. Grouping comparison shows that in developed eastern provinces, freight transport structure shows negative externality effect on eco- efficiency, and the higher the urbanization level, the stronger the negative effect. However, in less developed provinces in central and western China, the freight transport structure improves the eco-efficiency of neighboring provinces, and the improvement of urbanization level will expand this positive effect. Therefore, it is necessary for the central government to implement ecological performance assessment and guide local governments to accelerate the development of public transportation. Meanwhile, it is necessary to implement differentiated management for different regions and promote the coordinated development of regional economy and ecological environment by improving regional vehicle structure.
LIN Shushen , LUO Nengsheng , YANG Jun . Vehicle Structure and Eco-Efficiency:Based on the Dynamic Spatial Durbin Model[J]. Economic geography, 2019 , 39(12) : 21 -30 . DOI: 10.15957/j.cnki.jjdl.2019.12.003
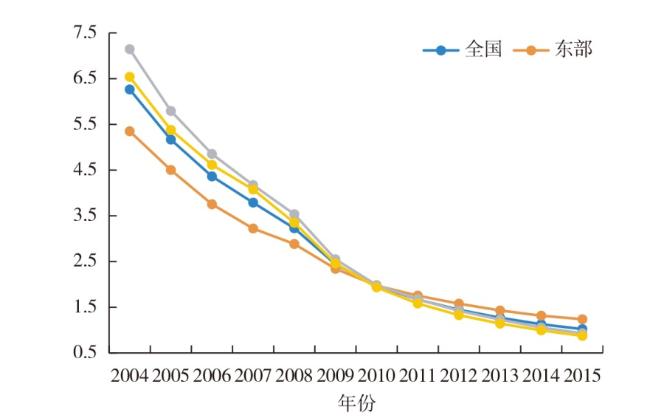
图1 2004—2015年公共车辆占比变化趋势Fig.1 The change trend of the proportion of public vehicles in 2004-2015 |
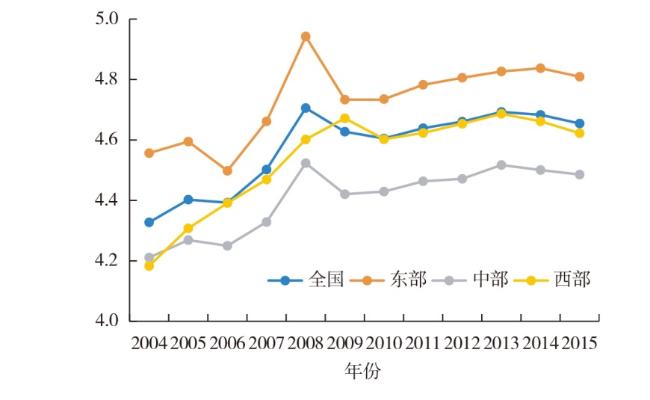
图2 2004—2015年公众乘车偏好变化趋势Fig.2 The change trend of public transportation preference in 2004-2015 |
表1 空间面板模型的适用性检验Tab.1 Applicability test of space panel model |
| 检验统计量 | 统计值 |
|---|---|
| 16.7852***(0.000) | |
| 12.3069***(0.000) | |
| 9.1465***(0.002) | |
| 4.6682**(0.031) | |
| 空间固定效应 | 539.7389***(0.000) |
| 94.7235***(0.000) | |
| 83.3326***(0.000) | |
| 100.6470***(0.000) | |
| 86.6533***(0.000) | |
| 时间固定效应 | 66.6360***(0.000) |
表2 交通结构与生态效率的实证结果Tab.2 Empirical results of the impact of vehicle structure on eco-efficiency |
| 交通客运结构 | 交通货运结构 | 交互影响 | ||||||
|---|---|---|---|---|---|---|---|---|
| 地理距离矩阵(W1) | 地理邻近矩阵(W2) | 地理距离矩阵(W1) | 地理邻近矩阵(W2) | 地理距离矩阵(W1) | 地理邻近矩阵(W2) | |||
| 0.6698***(0.047) | 0.7660***(0.047) | 0.6613***(0.046) | 0.7451***(0.047) | 0.6816***(0.046) | 0.7529***(0.046) | |||
| -0.0415**(0.017) | -0.0379**(0.018) | |||||||
| -0.0274**(0.015) | -0.0322**(0.016) | |||||||
| 0.0072**(0.004) | 0.0069*(0.004) | |||||||
| 0.0003(0.001) | 0.0005(0.001) | 0.0015(0.002) | 0.0021(0.002) | |||||
| -0.5204***(0.191) | -0.6641***(0.207) | -0.4323**(0.193) | -0.5769***(0.199) | -0.4862(0.327) | -0.4479(0.336) | |||
| -0.0013(0.004) | -0.0023(0.004) | |||||||
| -0.1177**(0.059) | -0.0803*(0.045) | |||||||
| -0.0857(0.054) | -0.0734*(0.039) | |||||||
| 0.0215*(0.012) | 0.0173*(0.009) | |||||||
| -0.0014(0.001) | 0.0004(0.001) | 0.0223***(0.007) | 0.0132***(0.004) | |||||
| 0.2241(0.502) | 0.1189(0.440) | 2.5480***(0.800) | 1.4683**(0.637) | |||||
| -0.0414***(0.011) | -0.0248***(0.008) | |||||||
| 控制变量 | yes | yes | yes | yes | yes | yes | ||
| 0.3411***(0.091) | 0.3318***(0.074) | 0.3531***(0.092) | 0.3055***(0.073) | 0.3693***(0.091) | 0.2974***(0.073) | |||
注:***、**和*分别表示在1%、5%和10%的统计水平上显著,括号内为标准误,下同。 |
表3 区域分析实证结果Tab.3 Empirical results of regional analysis |
| 交通客运结构 | 交通货运结构 | 交互影响 | |||||||||
|---|---|---|---|---|---|---|---|---|---|---|---|
| 东部 | 中部 | 西部 | 东部 | 中部 | 西部 | 东部 | 中部 | 西部 | |||
| 1.1604***(0.108) | 0.4863***(0.079) | 0.5654***(0.079) | 1.0788***(0.102) | 0.5538***(0.081) | 0.5820***(0.074) | 0.8373***(0.102) | 0.5496***(0.080) | 0.4627***(0.072) | |||
| -0.1693**(0.072) | 0.0592(0.070) | -0.0389(0.042) | |||||||||
| -0.0525(0.043) | 0.0117(0.055) | -0.0450(0.032) | |||||||||
| 0.0281*(0.015) | -0.0152(0.016) | 0.0061(0.008) | |||||||||
| -0.0004 (0.002) | 0.0009 (0.001) | 0.0008 (0.001) | 0.0131* (0.007) | 0.0029 (0.006) | -0.0137*** (0.005) | ||||||
| 0.8460* (0.473) | 0.6865** (0.344) | -1.6655** (0.757) | 1.9681** (0.863) | 0.9387 (0.883) | -3.4040*** (0.939) | ||||||
| -0.0228** (0.011) | -0.0042 (0.012) | 0.0299*** (0.010) | |||||||||
| 0.1295 (0.160) | 0.0163 (0.181) | -0.0826 (0.168) | |||||||||
| 0.0856 (0.100) | 0.0007 (0.142) | -0.0951 (0.108) | |||||||||
| -0.0342 (0.033) | 0.0007 (0.042) | 0.0205 (0.035) | |||||||||
| -0.0074** (0.004) | 0.0028** (0.001) | 0.0034 (0.003) | -0.0272 (0.020) | 0.0103 (0.014) | 0.0183 (0.019) | ||||||
| 0.8795 (1.010) | 2.0298*** (0.589) | 1.2058 (2.695) | -0.8535 (2.075) | 3.0576 (1.962) | 4.3700 (3.803) | ||||||
| 0.0247 (0.026) | 0.0154 (0.028) | -0.0392 (0.045) | |||||||||
| 控制变量 | yes | yes | yes | yes | yes | yes | yes | yes | yes | ||
| 0.2315** (0.100) | 0.0882 (0.159) | 0.4135** (0.173) | 0.4442*** (0.101) | 0.5001*** (0.144) | 0.2941* (0.172) | 0.3713*** (0.100) | 0.5136*** (0.144) | 0.3203* (0.167) | |||
| [1] |
|
| [2] |
European Environment Agency(EEA). Beyond transport policy:exploring and managing the external drivers of transport demand,Illustrative case studies from Europe[J]. Eea Technical Report, 2008.
|
| [3] |
|
| [4] |
|
| [5] |
|
| [6] |
|
| [7] |
|
| [8] |
|
| [9] |
|
| [10] |
|
| [11] |
|
| [12] |
|
| [13] |
周峤. 雾霾天气的成因[J]. 中国人口·资源与环境, 2015, 25(S1):211-212.
|
| [14] |
穆献中, 龚飞鸿. 交通运输对国民经济的需求影响研究[J]. 数量经济技术经济研究, 2003(9):122-126.
|
| [15] |
刘海隆, 包安明, 陈曦, 等. 新疆交通可达性对区域经济的影响分析[J]. 地理学报, 2008(4):428-436.
|
| [16] |
陈博文, 陆玉麒, 柯文前, 等. 江苏交通可达性与区域经济发展水平关系测度——基于空间计量视角[J]. 地理研究, 2015, 34(12):2 283-2 294.
|
| [17] |
于江霞. 中国公路交通与经济发展空间差异及相关性分析[J]. 交通运输系统工程与信息, 2015, 15(1):11-16.
|
| [18] |
周耀东, 张佳仪. 城市轨道交通经济效应实证研究——以北京市为例[J]. 城市问题, 2013(10):58-62.
|
| [19] |
陆化普, 王建伟, 张鹏. 基于能源消耗的城市交通结构优化[J]. 清华大学学报:自然科学版, 2004(3):383-386.
|
| [20] |
林伯强, 杜之利. 中国城市车辆耗能与公共交通效率研究[J]. 经济研究, 2018, 53(6):142-156.
|
| [21] |
毛霖, 杨新苗, 马泽丹, 等. 电动自行车对城市交通结构的影响预测模型研究[J]. 交通运输系统工程与信息, 2007(1):25-28.
|
| [22] |
魏庆琦, 赵嵩正, 肖伟. 我国交通运输结构优化的碳减排能力研究[J]. 交通运输系统工程与信息, 2013, 13(3):10-17+32.
|
| [23] |
马丽梅, 刘生龙, 张晓. 能源结构、交通模式与雾霾污染——基于空间计量模型的研究[J]. 财贸经济, 2016, 37(1):147-160.
|
| [24] |
单豪杰. 中国资本存量K的再估算:1952—2006年[J]. 数量经济技术经济研究, 2008, 25(10):17-31.
|
| [25] |
李胜兰, 初善冰, 申晨. 地方政府竞争、环境规制与区域生态效率[J]. 世界经济, 2014, 37(4):88-110.
|
| [26] |
韩永辉, 黄亮雄, 王贤彬. 产业结构优化升级改进生态效率了吗?[J]. 数量经济技术经济研究, 2016, 33(4):40-59.
|
| [27] |
张勋, 王旭, 万广华, 等. 交通基础设施促进经济增长的一个综合框架[J]. 经济研究, 2018, 53(1):50-64.
|
| [28] |
罗能生, 王玉泽. 财政分权、环境规制与区域生态效率——基于动态空间杜宾模型的实证研究[J]. 中国人口·资源与环境, 2017, 27(4):110-118.
|
| [29] |
孙祁祥, 王向楠, 韩文龙. 城镇化对经济增长作用的再审视——基于经济学文献的分析[J]. 经济学动态, 2013(11):20-28.
|
/
| 〈 |
|
〉 |