
Spatial Pattern and Influential Factors of Exhibition Passenger Flow in China
Received date: 2018-12-17
Revised date: 2019-07-14
Online published: 2025-04-18
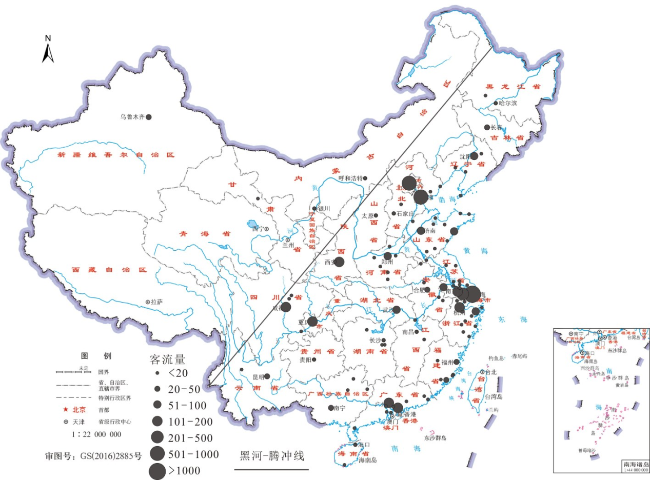
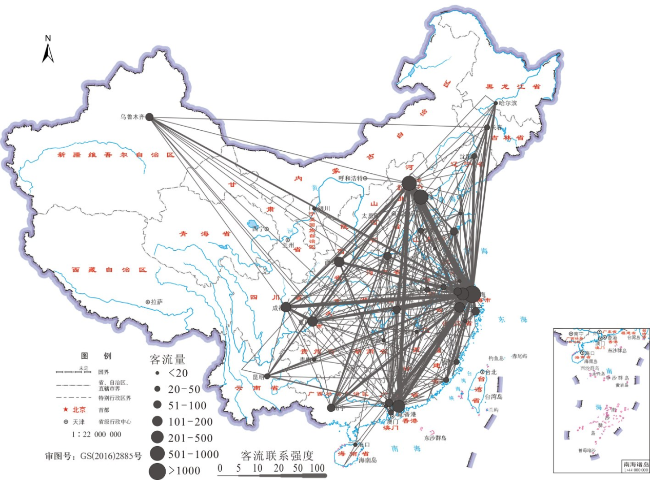
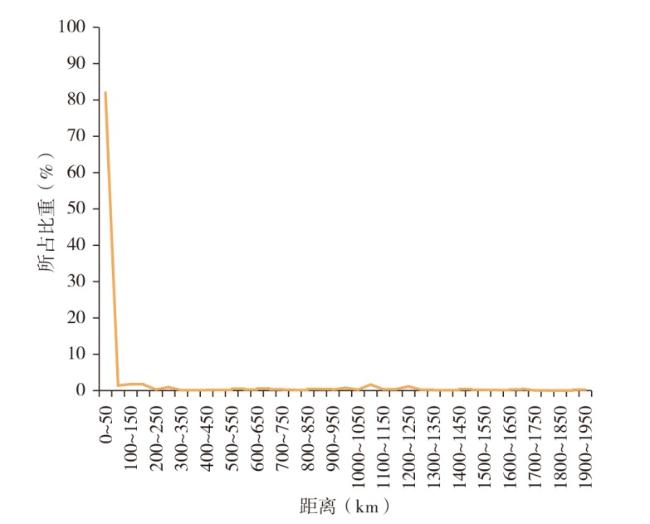
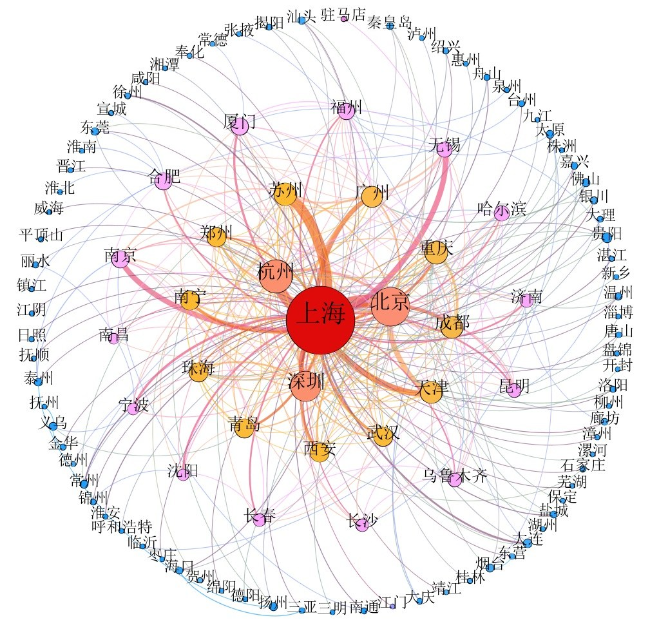
Based on the exhibition big data mining in Dianping.com network platform, with GIS spatial analysis, complex network analysis and multiple linear regression model, this paper analyzed the spatial pattern and influential factors of exhibition passenger flow in China. The study shows that, firstly, exhibition source market in China is mainly concentrated in a few large cities such as Shanghai, Beijing, Tianjin and Shenzhen, shows the spatial distribution characteristics of "more in the east and less in the west", "large dispersion and small concentration". The Yangtze River delta, Beijing-Tianjin-Hebei and Pearl River delta are the three major clusters of exhibition source market in China. Secondly, exhibition passenger flow in China forms a diamond-shaped space structure centered on Shanghai, Beijing, Guangzhou, Shenzhen, Chengdu and Chongqing. The exhibition passenger flow generally shows obvious distance attenuation characteristics, about 82.05% of the passenger flow is mainly concentrated in the range of 0-50 km. Thirdly, exhibition passenger flow network in China obvious hierarchical structure, taking Shanghai as the core and Beijing, Hangzhou and Shenzhen as the sub-core, showing obvious small-world effect. Fourthly, the level and scale of exhibition development, business development, economy development level are the main influential factors of spatial pattern of exhibition passenger flow in China. Among those, the level of exhibition development is the primary influential factor.
LIU Dajun , CHEN Junzi , JIA Yaoyan . Spatial Pattern and Influential Factors of Exhibition Passenger Flow in China[J]. Economic geography, 2019 , 39(12) : 103 -109 . DOI: 10.15957/j.cnki.jjdl.2019.12.012
图4 中国会展客流网络图注:图中圆点的大小表示该城市的度,线条的粗细表示客流联系强度的大小。 Fig.4 Exhibition passenger flow network in China |
表1 中国会展客流网络节点中心性(前10)Tab.1 Centralities of the top 10 cities in China |
| 度 | 接近中心性 | 特征向量中心性 | |||
|---|---|---|---|---|---|
| 上海 | 69 | 上海 | 0.73 | 上海 | 1.00 |
| 北京 | 37 | 北京 | 0.60 | 北京 | 0.78 |
| 杭州 | 31 | 杭州 | 0.56 | 杭州 | 0.66 |
| 深圳 | 28 | 深圳 | 0.55 | 深圳 | 0.63 |
| 苏州 | 20 | 重庆 | 0.52 | 苏州 | 0.53 |
| 重庆 | 20 | 广州 | 0.52 | 重庆 | 0.50 |
| 天津 | 19 | 天津 | 0.52 | 珠海 | 0.49 |
| 成都 | 19 | 成都 | 0.51 | 武汉 | 0.49 |
| 广州 | 18 | 青岛 | 0.51 | 广州 | 0.47 |
| 青岛 | 17 | 苏州 | 0.50 | 成都 | 0.46 |
表2 旋转后主成分载荷Tab.2 Rotated component matrix |
| 变量 | 主成分1 | 主成分2 | 主成分3 | 主成分4 |
|---|---|---|---|---|
| X1 | 0.71 | 0.26 | 0.15 | 0.40 |
| X2 | 0.89 | 0.15 | 0.18 | 0.13 |
| X3 | 0.23 | 0.21 | 0.16 | 0.86 |
| X4 | 0.52 | 0.51 | 0.22 | 0.44 |
| X5 | 0.12 | 0.89 | 0.01 | 0.32 |
| X6 | 0.45 | 0.73 | 0.26 | 0.29 |
| X7 | 0.65 | 0.44 | 0.51 | 0.26 |
| X8 | 0.66 | 0.49 | 0.39 | 0.35 |
| X9 | 0.20 | 0.09 | 0.91 | 0.24 |
| X10 | 0.38 | 0.59 | 0.54 | -0.17 |
| X11 | 0.52 | 0.54 | 0.30 | -0.01 |
| 特征值 | 6.97 | 0.92 | 0.81 | 0.63 |
| 贡献率 | 63.34 | 8.39 | 7.40 | 5.76 |
| 累计贡献率 | 63.34 | 71.73 | 79.13 | 84.89 |
表3 主成分回归分析Tab.3 Regression result analysis |
| 自变量 | 模型1 | 模型2 |
|---|---|---|
| 常数 | 177.76(2.95)*** | 177.76(3.11)*** |
| F1 | 0.72(6.12)*** | 0.72(6.44)*** |
| F2 | - | - |
| F3 | - | 0.24(2.17)** |
| F4 | - | - |
| R | 0.72 | 0.76 |
| R2 | 0.52 | 0.58 |
| Adjusted R2 | 0.50 | 0.55 |
注:数值为回归系数;括号内为t检验值;***、**、*分别表示在1%、5%、10%水平上显著。 |
| [1] |
方忠权. 广州会展企业空间集聚特征与影响因素[J]. 地理学报, 2013, 68(4):464-476.
|
| [2] |
|
| [3] |
|
| [4] |
|
| [5] |
|
| [6] |
|
| [7] |
|
| [8] |
|
| [9] |
|
| [10] |
梁明珠, 钟金凤, 廖奇辉. 澳门会展旅游的发展模式及其推进路径[J]. 旅游科学, 2012, 26(2):77-84.
|
| [11] |
彭顺生. 新世纪国际宏观环境变化对中国会展业的影响及其应对策略[J]. 广州大学学报:社会科学版, 2013, 12(2):48-54.
|
| [12] |
李智玲. 会展业的带动效应研究[J]. 经济管理, 2011, 33(6):125-131.
|
| [13] |
郑天翔. 大型会展对地方旅游业贡献的影响——以上海世博会为例[J]. 社会科学家, 2014(8):80-84.
|
| [14] |
李铁成, 刘力. 区域间投入产出模型(IRIO)的我国会展业经济影响分析[J]. 旅游学刊, 2014, 29(6):34-45.
|
| [15] |
王晓敏, 戴光全. 权力、责任及利益视角下展览企业部门协作分析——以深圳会展中心为例[J]. 旅游学刊, 2016, 31(9):113-123.
|
| [16] |
吴开军. 会展企业和旅游企业竞合联盟伙伴选择[J]. 经济管理, 2013, 35(4):133-140.
|
| [17] |
蔡礼彬, 司玲. 会展可持续发展评价指标之构建——以广交会为例[J]. 广州大学学报(社会科学版), 2016, 15(1):73-81.
|
| [18] |
胡平. 基于展馆视角的我国会展区域竞争力差异分析[J]. 商业经济与管理, 2008(3):64-68.
|
| [19] |
卞显红. 会展旅游参与者决策过程及其影响因素研究[J]. 旅游学刊, 2002, 17(4):59-62.
|
| [20] |
戴光全, 梁春鼎, 陈欣. 基于扎根理论的节事场所与会展场馆场所依赖差异[J]. 地理研究, 2012, 31(9):1 707-1 721.
|
| [21] |
蔡金阳, 韩勇, 胡瑞法, 等. 企业会展参与及展位面积选择的影响因素[J]. 北京理工大学学报(社会科学版), 2017, 19(2):103-108.
|
| [22] |
朱海森. 海外会展业空间布局的研究及启示:以德国、香港为例[J]. 人文地理, 2004, 19(5):93-96.
|
| [23] |
鞠航, 田金信, 万立君, 等. 城市会展产业的发展布局与创新模式研究[J]. 中国软科学, 2006(11):131-136.
|
| [24] |
杨欣, 金李梅. 中国会展业时空分布特征[J]. 经济地理, 2014, 34(8):96-102.
|
| [25] |
任国岩. 长三角会展场馆空间集聚特征及影响因素[J]. 经济地理, 2014, 34(9):86-92.
|
| [26] |
方忠权, 王章郡, 刘莉. 珠江三角洲会展企业空间格局变动[J]. 中国人口·资源与环境, 2013, 23(7):149-154.
|
| [27] |
张玲, 邬永强. 广州市会展旅游产业集聚过程及形成机理研究[J]. 人文地理, 2013, 28(2):111-116.
|
| [28] |
朱玮, 魏晓阳. 基于时间效用模型的大型展会游客时空行为模式研究——以2014青岛世园会为例[J]. 旅游学刊, 2019, 34(1):73-81.
|
| [29] |
朱鹤, 刘家明. 基于LBS数据的休闲商业区业态空间分布及评价分析[J]. 辽宁大学学报:哲学社会科学版, 2018, 46(5):76-83.
|
| [30] |
|
| [31] |
吴康, 方创琳, 赵渺希. 中国城市网络的空间组织及其复杂性结构特征[J]. 地理研究, 2015, 34(4):711-728.
|
| [32] |
武文杰, 董正斌, 张文忠, 等. 中国城市空间关联网络结构的时空演变[J]. 地理学报, 2011, 66(4):435-445.
|
| [33] |
胡焕庸. 中国人口的分布、区划和展望[J]. 地理学报, 1990, 45(2):139-145.
|
| [34] |
赵现红, 吴丽霞. 会展客商旅游意愿及其影响因素研究——以郑州国际汽车后市场博览会为例[J]. 经济经纬, 2018, 35(3):123-129.
|
| [35] |
梁圣蓉. 城市会展旅游发展的动力机制与评估——以武汉市为例[J]. 旅游学刊, 2008, 23(10):76-81.
|
| [36] |
吴开军. 会展业和旅游业合作动因——基于战略联盟视角的分析[J]. 旅游学刊, 2011, 26(4):73-81.
|
| [37] |
李树民. 旅游产业融合与旅游产业协整发展[J]. 旅游学刊, 2011, 26(6):5-6.
|
/
| 〈 |
|
〉 |