
Received date: 2019-01-05
Revised date: 2019-07-04
Online published: 2025-04-18
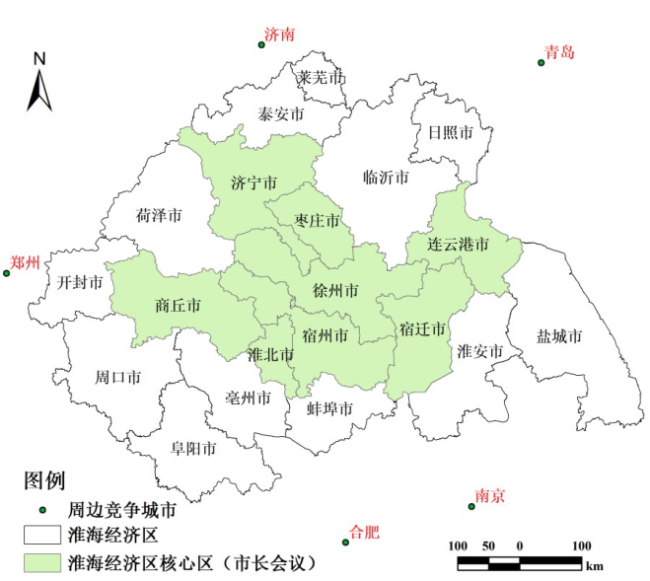
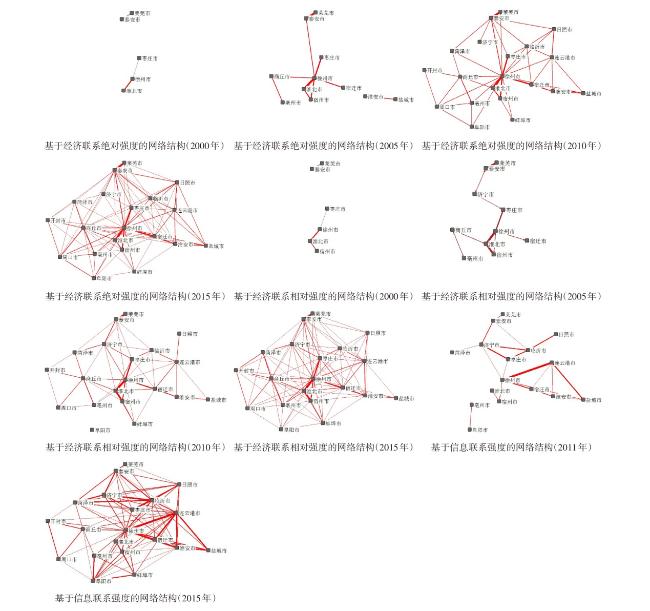
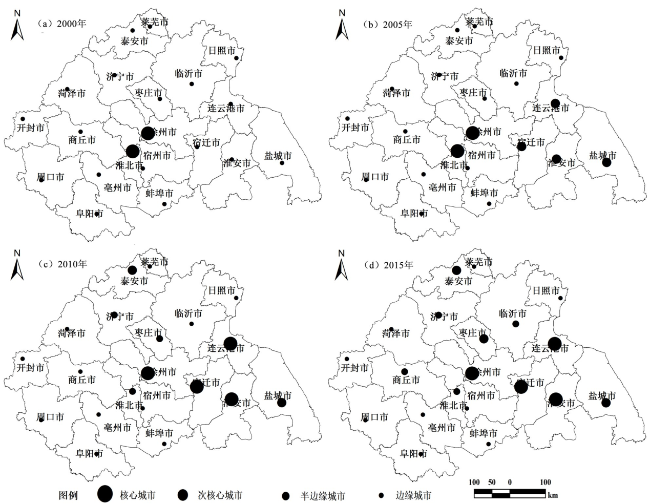
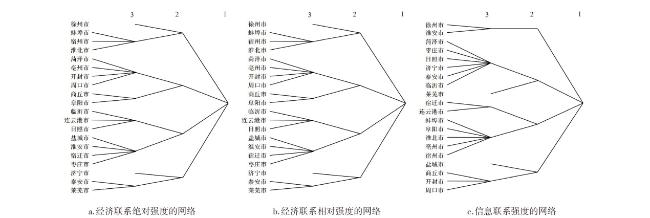
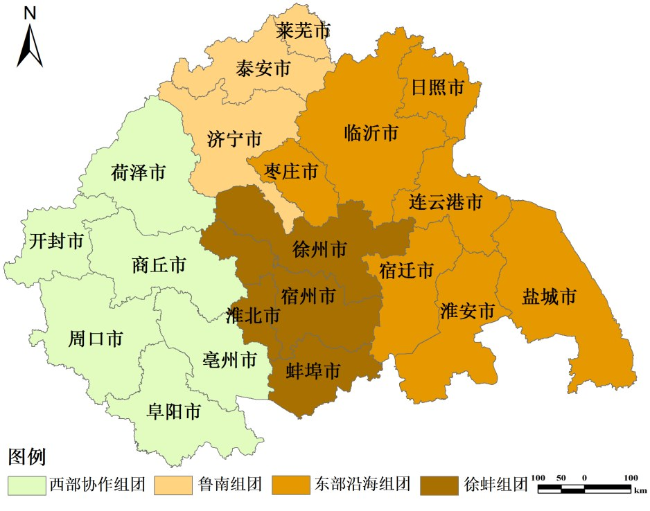
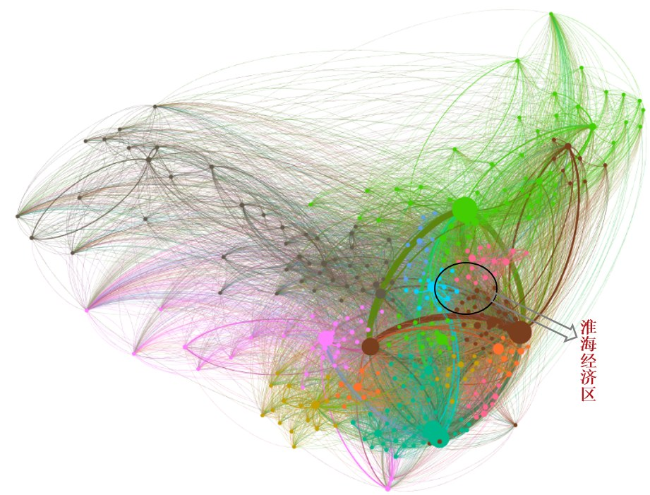
Under the background of globalization and localization and regionalization, the rapid flow of economy and information between nodes promotes the formation of urban networks and becomes a new regional organization model and spatial structure, especially for regional integration. The area has had a profound impact. Taking Huaihai Economic Zone as an example, this paper starts from the network space of absolute intensity of economic connection, relative strength of economic connection and intensity of information connection, from the perspective of network density, feature vector center degree, core-edge structure and cohesion subgroup. The time and space pattern of the economic and information network in the Huaihai Economic Zone was studied. The results show that the overall network density of the Huaihai Economic Zone is not high, but it gradually evolves with time; whether it is the absolute intensity of economic linkages, the relative strength of economic linkages, or the intensity of information linkage, Xuzhou is the primary central city of Huaihai Economic Zone; The core cities that define the Huaihai Economic Zone are Xuzhou, Lianyungang, Huai'an and Suqian, and the sub-core cities are Yancheng, Tai'an and Zaozhuang. There are four sub-groups of local cities in huaihai economic zone. The urban subgroups are Xuzhou-Bengbu Group, Eastern Coast Group, Southern shandong Group and Western Collaboration Group. Finally, the idea of promoting the development of urban agglomerations in the Huaihai Economic Zone is proposed.
MENG Hao , HUANG Xianjin , YANG Jun , LIN Bingquan . Network Structure and Development Concept in Huaihai Economic Zone[J]. Economic geography, 2019 , 39(12) : 1 -10 . DOI: 10.15957/j.cnki.jjdl.2019.12.001
表1 2015年淮海经济区与国内主要经济区发展情况比较Tab.1 Comparison of the development of Huaihai Economic Zone and major domestic economic zones |
| 名称 | 面积(万km2) | 人口(亿人) | GDP(亿元) | 人均GDP(元/人) | 三次产业结构(%) |
|---|---|---|---|---|---|
| 京津冀经济区 | 21.70 | 1.09 | 62 172 | 57 329 | 6∶42∶51 |
| 长三角经济区 | 21.10 | 1.59 | 118 332 | 74 823 | 5∶47∶48 |
| 珠三角经济区 | 5.48 | 0.57 | 53 060 | 93 114 | 2∶45∶53 |
| 中原经济区 | 28.90 | 1.81 | 49 998 | 27 609 | 12∶54∶32 |
| 山东半岛经济区 | 6.98 | 0.37 | 27 497 | 74 870 | 14∶49∶37 |
| 皖江经济区 | 9.00 | 0.33 | 13 566 | 40 951 | 7∶53∶41 |
| 淮海经济区 | 18.06 | 1.14 | 38 494 | 33 667 | 9∶57∶33 |
注:数据来源于2016年各省(市、区)统计年鉴加总、整理。 |
表2 2000—2015年淮海经济区网络联系密度Tab.2 Network connection density of Huaihai Economic Zone from 2000 to 2015 |
| 网络类型 | 2000 | 2005 | 2010 | 2015 | |||||||
|---|---|---|---|---|---|---|---|---|---|---|---|
| 密度 | 标准差 | 密度 | 标准差 | 密度 | 标准差 | 密度 | 标准差 | ||||
| 经济联系绝对强度 | 0.05 | 0.40 | 0.28 | 1.40 | 1.67 | 4.81 | 5.42 | 11.98 | |||
| 经济联系相对强度 | 0.09 | 0.63 | 0.42 | 2.14 | 2.40 | 6.44 | 6.16 | 13.02 | |||
| 信息联系强度 | / | / | / | / | 1.29 | 3.61 | 12.47 | 17.98 | |||
表3 淮海经济区特征向量中心度Tab.3 Characteristic vector center degree of Huaihai Economic Zone |
| 城市 | 经济联系绝对强度 | 经济联系相对强度 | 信息联系强度 | |||||||||
|---|---|---|---|---|---|---|---|---|---|---|---|---|
| 2000 | 2005 | 2010 | 2015 | 2000 | 2005 | 2010 | 2015 | 2011 | 2015 | |||
| 徐州 | 100.00 | 93.58 | 92.39 | 84.15 | 84.57 | 80.47 | 82.06 | 84.15 | 75.89 | 64.94 | ||
| 连云港 | 0.00 | 0.00 | 15.01 | 15.82 | 0.00 | 0.00 | 11.68 | 15.82 | 63.79 | 58.19 | ||
| 淮安 | 0.00 | 0.00 | 19.37 | 19.02 | 0.00 | 0.00 | 11.57 | 19.02 | 52.17 | 45.89 | ||
| 盐城 | 0.00 | 0.00 | 12.35 | 13.09 | 0.00 | 0.00 | 1.48 | 13.09 | 45.09 | 29.91 | ||
| 宿迁 | 0.00 | 23.67 | 34.80 | 34.56 | 0.00 | 9.92 | 27.71 | 34.56 | 45.99 | 39.39 | ||
| 开封 | 0.00 | 0.00 | 1.03 | 6.62 | 0.00 | 0.00 | 1.99 | 6.62 | 0.00 | 8.45 | ||
| 商丘 | 0.00 | 14.95 | 19.17 | 28.99 | 0.00 | 12.42 | 21.21 | 28.99 | 0.00 | 13.51 | ||
| 周口 | 0.00 | 0.00 | 7.41 | 12.11 | 0.00 | 0.00 | 2.50 | 12.11 | 0.00 | 4.90 | ||
| 枣庄 | 47.20 | 35.63 | 34.36 | 44.22 | 32.47 | 26.93 | 39.79 | 44.22 | 31.44 | 28.22 | ||
| 济宁 | 0.00 | 0.00 | 1.16 | 7.07 | 0.00 | 3.72 | 17.20 | 7.07 | 35.03 | 36.22 | ||
| 泰安 | 0.00 | 26.30 | 27.10 | 42.69 | 0.00 | 0.76 | 13.03 | 42.69 | 13.74 | 26.38 | ||
| 日照 | 0.00 | 0.00 | 8.38 | 19.23 | 0.00 | 0.00 | 0.91 | 19.23 | 5.80 | 27.45 | ||
| 莱芜 | 0.00 | 18.22 | 19.33 | 31.27 | 0.00 | 0.41 | 7.10 | 31.27 | 3.19 | 7.47 | ||
| 临沂 | 0.00 | 0.00 | 14.26 | 15.36 | 0.00 | 0.00 | 9.47 | 15.36 | 22.08 | 47.61 | ||
| 菏泽 | 0.00 | 0.00 | 7.06 | 8.77 | 0.00 | 0.00 | 4.24 | 8.77 | 7.36 | 26.67 | ||
| 淮北 | 88.16 | 75.38 | 66.35 | 52.69 | 94.58 | 90.02 | 80.43 | 52.69 | 3.87 | 10.65 | ||
| 亳州 | 0.00 | 2.34 | 11.37 | 15.26 | 0.00 | 2.04 | 10.67 | 15.26 | 0.00 | 7.74 | ||
| 宿州 | 0.00 | 49.79 | 42.64 | 35.30 | 53.37 | 66.51 | 52.56 | 35.30 | 17.23 | 16.77 | ||
| 蚌埠 | 0.00 | 0.00 | 8.50 | 9.62 | 0.00 | 0.00 | 14.58 | 9.62 | 0.00 | 14.38 | ||
| 阜阳 | 0.00 | 0.00 | 6.55 | 8.64 | 0.00 | 0.00 | 0.00 | 8.64 | 0.00 | 17.72 | ||
表4 淮海经济区核心城市识别(Y表示核心城市)Tab.4 Identification of core cities in Huaihai Economic Zone |
| 城市/年份 | 经济联系绝对强度 | 经济联系相对强度 | 信息联系强度 | |||||||||
|---|---|---|---|---|---|---|---|---|---|---|---|---|
| 2000 | 2005 | 2010 | 2015 | 2000 | 2005 | 2010 | 2015 | 2011 | 2015 | |||
| 徐州 | Y | Y | Y | Y | Y | Y | Y | Y | Y | Y | ||
| 连云港 | - | Y | Y | Y | - | - | Y | Y | Y | Y | ||
| 淮安 | - | Y | Y | Y | - | - | Y | Y | Y | Y | ||
| 盐城 | - | Y | Y | Y | - | - | - | - | Y | Y | ||
| 宿迁 | - | Y | Y | Y | - | - | Y | Y | Y | Y | ||
| 商丘 | - | - | - | Y | - | - | - | - | - | - | ||
| 枣庄 | - | - | - | Y | - | - | Y | Y | - | - | ||
| 济宁 | - | Y | - | - | - | - | - | - | Y | Y | ||
| 泰安 | - | - | Y | Y | - | - | Y | Y | - | - | ||
| 临沂 | - | - | - | - | - | - | - | - | - | Y | ||
| 菏泽 | - | - | - | - | - | - | - | - | - | - | ||
| 淮北 | Y | - | - | - | Y | Y | Y | Y | - | - | ||
| [1] |
艾少伟, 苗长虹. 从“地方空间”,“流动空间”到“行动者网络空间”:ANT视角[J]. 人文地理, 2010, 25(2):43-49.
|
| [2] |
|
| [3] |
|
| [4] |
钟业喜, 冯兴华, 文玉钊. 长江经济带经济网络结构演变及其驱动机制研究[J]. 地理科学, 2016, 36(1):10-19.
|
| [5] |
吴常艳, 黄贤金, 陈博文, 等. 长江经济带经济联系空间格局及其经济一体化趋势[J]. 经济地理, 2017, 37(7):71-78.
|
| [6] |
|
| [7] |
|
| [8] |
甄峰, 王波, 陈映雪. 基于网络社会空间的中国城市网络特征——以新浪微博为例[J]. 地理学报, 2012, 67(8):1 031-1 043.
|
| [9] |
车冰清, 朱传耿, 杜艳, 等. 淮海经济区城市空间影响范围与城市经济区划分[J]. 人文地理, 2010, 25(5):86-91.
|
| [10] |
孟浩, 王仲智, 张骏菲, 等. 基于百度指数的淮海经济区城市层级与联系研究[J]. 江苏师范大学学报:自然科学版, 2015(2):14-17.
|
| [11] |
渠立权. 淮海经济区区域空间结构评价与重构[J]. 地理与地理信息科学, 2014, 30(1):76-80.
|
| [12] |
孙姗姗, 朱传耿, 李志江. 淮海经济区经济发展差异研究[J]. 地理学报, 2009, 64(8):924-934.
|
| [13] |
孙峻岭, 林炳耀, 孙琳琳. 新亚欧大陆桥东端城市群空间结构规划构想[J]. 地理研究, 2012, 31(5):931-944.
|
| [14] |
钱春蕾, 叶菁, 陆潮. 基于改进城市引力模型的武汉城市圈引力格局划分研究[J]. 地理科学进展, 2015, 34(2):237-245.
|
| [15] |
蒋天颖, 谢敏, 刘刚. 基于引力模型的区域创新产出空间联系研究——以浙江省为例[J]. 地理科学, 2014, 34(11):1 320-1 326.
|
| [16] |
谭秀杰, 周茂荣. 21世纪“海上丝绸之路”贸易潜力及其影响因素——基于随机前沿引力模型的实证研究[J]. 国际贸易问题, 2015(2):3-12.
|
| [17] |
王姣娥, 焦敬娟, 金凤君. 高速铁路对中国城市空间相互作用强度的影响[J]. 地理学报, 2015, 69(12):1 833-1 846.
|
| [18] |
刘铮, 王世福, 赵渺希, 等. 有向加权型城市网络的探索性分析[J]. 地理研究, 2013, 32(7):1 253-1 268.
|
| [19] |
王宁宁, 赵宇, 陈锐. 基于辐射模型的城市信息空间关联复杂网络研究[J]. 经济地理, 2015, 35(4):76-83.
|
| [20] |
汤放华, 汤慧, 孙倩, 等. 长江中游城市集群经济网络结构分析[J]. 地理学报, 2013, 68(10):1 357-1 366.
|
| [21] |
|
| [22] |
刘军. 社会网络分析导论[M]. 北京: 社会科学文献出版社, 2004.
|
| [23] |
邹嘉龄, 刘卫东. 2001-2013年年中国与“一带一路”沿线国家贸易网络分析[J]. 地理科学, 2016, 36(11):1 629-1 636.
|
/
| 〈 |
|
〉 |