
Synergy Degree of Innovation Network of Emerging Technology Industry in Central China
Received date: 2018-12-20
Revised date: 2019-05-27
Online published: 2025-04-17
Based on the panel data of six provinces in the central regions from 2010 to 2017, this paper constructs the synergetic degree model to measure the synergy degree of innovation network of emerging technology industry in the central regions from the aspects of innovation goals, resource allocation and knowledge transfer. The results show that it overall maintains the growth trend in the synergy degree of innovation network of emerging technology industry in the central regions, but the level of collaborative innovation is relatively low, and its difference among the six provinces is relatively large, Which is an orderly growth trend in Hubei Province and Anhui Province, and a fluctuating growth in Hunan Province, Jiangxi Province, Henan Province and Shanxi Province. Resource allocation and knowledge transfer are the main factors that restrict the collaboration of innovation network of emerging technology industry. Finally, it puts forward the policy proposals which are strengthening the integration and investment of cooperative R&D resources among the entities in the innovation network, standardizing the cooperation mode among the collaborative innovation entities, accelerating the transfer, absorption and re-creation of the emerging technology knowledge, and improving the synergy degree of the innovation network in the emerging technology industry.
MA Hui , CAO Xing , LI Xingyu . Synergy Degree of Innovation Network of Emerging Technology Industry in Central China[J]. Economic geography, 2019 , 39(9) : 164 -173 . DOI: 10.15957/j.cnki.jjdl.2019.09.020
表1 新兴技术产业创新网络的协同度指标体系Tab.1 Synergy index system of innovation network of emerging technology industry |
| 系统 | 一级指标 | 要素 | 单位 | 权重 |
|---|---|---|---|---|
| 创新目标实现度(I) | 创新投入 | 高技术产业研究与开发机构数(e11) | 个 | 0.0524 |
| 高技术产业R&D人员折合全时当量(e12) | 个 | 0.0393 | ||
| 高技术产业R&D项目经费(e13) | 亿元 | 0.0402 | ||
| 创新产出 | 高技术产业新产品开发项目数(e14) | 件 | 0.0366 | |
| 高技术产业有效发明专利数(e15) | 件 | 0.0557 | ||
| 资源合理配置度(R) | 政府资源 | 政府资金占企业研发内部支出的比重(e21) | % | 0.0403 |
| 高校科研院所资源 | 与高校合作研发的经费占企业研发外部支出的比重(e22) | % | 0.0596 | |
| 与研发机构合作研发的经费占企业研发外部支出的比重(e23) | % | 0.0436 | ||
| 知识转移有效度(K) | 知识流向 | 购买国外技术经费(e24) | 亿元 | 0.1345 |
| 购买国内技术经费(e25) | 亿元 | 0.0705 | ||
| 技术市场输出技术成交额(e31) | 亿元 | 0.1574 | ||
| 技术市场引进技术成交额(e32) | 亿元 | 0.1367 | ||
| 知识吸收 | 消化吸收费用(e33) | 亿元 | 0.1333 |
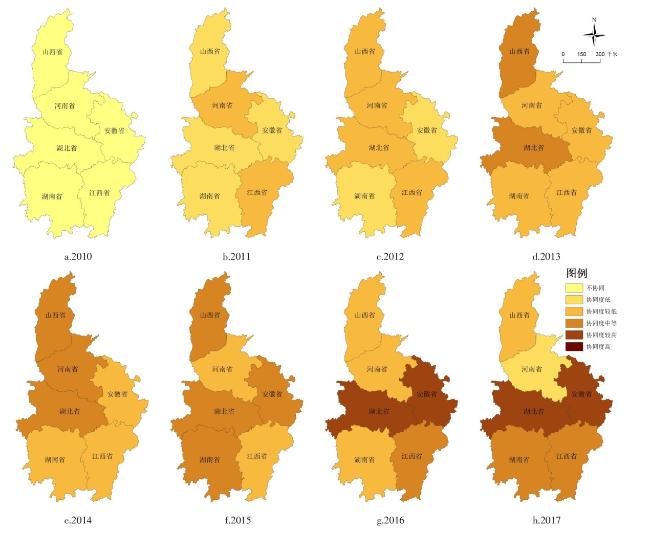
表2 新兴技术产业创新网络协同度划分标准Tab.2 Synergy criteria for innovation network of emerging technology industry |
| Cd | <0 | 0~0.2 | 0.2~0.4 | 0.4~0.6 | 0.6~0.8 | 0.8~1.0 |
|---|---|---|---|---|---|---|
| 协同度 | 不协同 | 低 | 较低 | 中等 | 较高 | 高 |
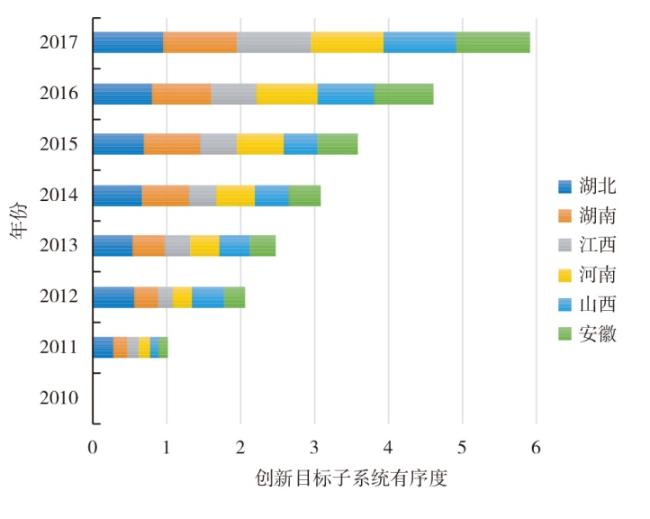
表3 创新目标实现度统计表Tab.3 The statistical table of innovation goal |
| 地区 | 2010 | 2011 | 2012 | 2013 | 2014 | 2015 | 2016 | 2017 |
|---|---|---|---|---|---|---|---|---|
| 湖北 | 0.0001 | 0.2933 | 0.5781 | 0.5459 | 0.6736 | 0.7075 | 0.8179 | 0.9686 |
| 湖南 | 0.0001 | 0.1900 | 0.3091 | 0.4433 | 0.6351 | 0.7628 | 0.7865 | 0.9998 |
| 江西 | 0.0001 | 0.1425 | 0.2009 | 0.3307 | 0.3746 | 0.4931 | 0.6156 | 0.9998 |
| 河南 | 0.0001 | 0.1566 | 0.2669 | 0.4121 | 0.5184 | 0.6383 | 0.8207 | 0.9811 |
| 山西 | 0.0001 | 0.1167 | 0.4271 | 0.4126 | 0.4650 | 0.4417 | 0.7701 | 0.9765 |
| 安徽 | 0.0001 | 0.1266 | 0.2652 | 0.3315 | 0.4277 | 0.5417 | 0.7876 | 0.9998 |
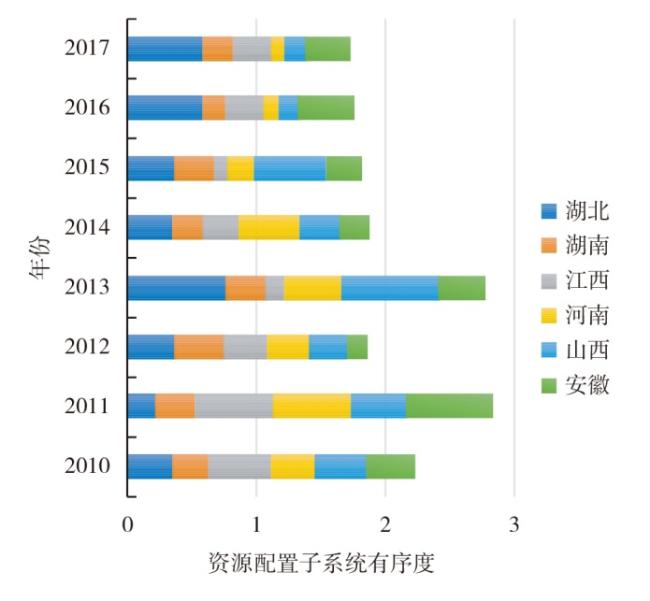
表4 资源配置合理度统计表Tab.4 The statistical table of resource allocation rationality |
| 地区 | 2010 | 2011 | 2012 | 2013 | 2014 | 2015 | 2016 | 2017 |
|---|---|---|---|---|---|---|---|---|
| 湖北 | 0.3561 | 0.2287 | 0.3713 | 0.7659 | 0.3481 | 0.3756 | 0.5836 | 0.5834 |
| 湖南 | 0.2723 | 0.2981 | 0.3843 | 0.3164 | 0.2467 | 0.2993 | 0.1767 | 0.2355 |
| 江西 | 0.4859 | 0.6121 | 0.3343 | 0.1462 | 0.2749 | 0.1080 | 0.3011 | 0.3006 |
| 河南 | 0.3398 | 0.5939 | 0.3300 | 0.4316 | 0.4703 | 0.1999 | 0.1152 | 0.0984 |
| 山西 | 0.4034 | 0.4286 | 0.2918 | 0.7541 | 0.3147 | 0.5576 | 0.1501 | 0.1659 |
| 安徽 | 0.3771 | 0.6721 | 0.1530 | 0.3557 | 0.2333 | 0.2762 | 0.4327 | 0.3438 |
表5 知识转移有效度统计表Tab.5 The statistical table of knowledge transfer validity |
| 地区 | 2010 | 2011 | 2012 | 2013 | 2014 | 2015 | 2016 | 2017 |
|---|---|---|---|---|---|---|---|---|
| 湖北 | 0.0274 | 0.0394 | 0.2032 | 0.3027 | 0.6343 | 0.5215 | 0.6670 | 0.7461 |
| 湖南 | 0.3222 | 0.0892 | 0.0631 | 0.3728 | 0.4446 | 0.4420 | 0.3134 | 0.6882 |
| 江西 | 0.1605 | 0.3881 | 0.2431 | 0.2661 | 0.2325 | 0.3734 | 0.5970 | 0.6882 |
| 河南 | 0.0000 | 0.2659 | 0.1887 | 0.3047 | 0.5636 | 0.3656 | 0.4570 | 0.7094 |
| 山西 | 0.0132 | 0.0643 | 0.1693 | 0.5563 | 0.4934 | 0.3152 | 0.4338 | 0.6882 |
| 安徽 | 0.3148 | 0.2175 | 0.1608 | 0.3812 | 0.3773 | 0.5911 | 0.8098 | 0.6882 |
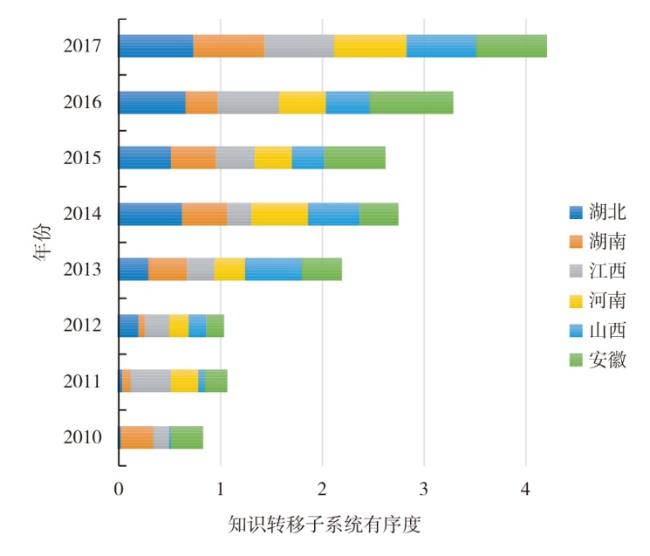
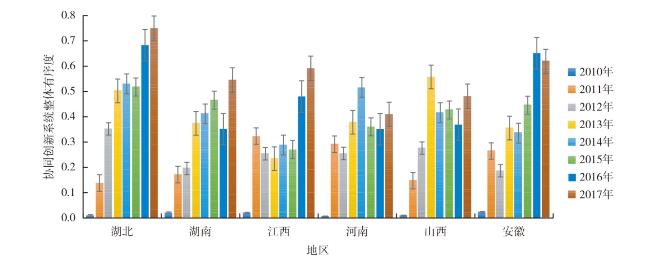
表6 中部地区六省新兴技术协同创新有序度统计表Tab.6 Statistics on the order degree of collaborative innovation in central China |
| 地区 | 2010 | 2011 | 2012 | 2013 | 2014 | 2015 | 2016 | 2017 |
|---|---|---|---|---|---|---|---|---|
| 湖北 | 0.0099 | 0.1383 | 0.3520 | 0.5021 | 0.5298 | 0.5175 | 0.6828 | 0.7498 |
| 湖南 | 0.0206 | 0.1716 | 0.1957 | 0.3739 | 0.4114 | 0.4656 | 0.3518 | 0.5452 |
| 江西 | 0.0198 | 0.3235 | 0.2537 | 0.2343 | 0.2882 | 0.2709 | 0.4801 | 0.5914 |
| 河南 | 0.0015 | 0.2914 | 0.2552 | 0.3784 | 0.5161 | 0.3600 | 0.3509 | 0.4091 |
| 山西 | 0.0081 | 0.1476 | 0.2763 | 0.5573 | 0.4164 | 0.4266 | 0.3688 | 0.4813 |
| 安徽 | 0.0228 | 0.2645 | 0.1868 | 0.3556 | 0.3351 | 0.4456 | 0.6510 | 0.6185 |
表7 中部地区六省新兴技术协同创新有序度的标准离差率统计表Tab.7 The standard deviation for the order degree of collaborative innovation in central China |
| 地区 | 2010 | 2011 | 2012 | 2013 | 2014 | 2015 | 2016 | 2017 |
|---|---|---|---|---|---|---|---|---|
| 湖北 | 0.0348 | 0.0102 | 0.0210 | 0.0254 | 0.0441 | 0.0511 | 0.0348 | 0.0102 |
| 湖南 | 0.0450 | 0.0015 | 0.0017 | 0.0226 | 0.0983 | 0.0308 | 0.0450 | 0.0015 |
| 江西 | 0.2719 | 0.0602 | 0.0352 | 0.0609 | 0.0399 | 0.0648 | 0.2719 | 0.0602 |
| 河南 | 0.0615 | 0.0175 | 0.0188 | 0.0012 | 0.0135 | 0.0353 | 0.0615 | 0.0175 |
| 山西 | 0.1331 | 0.0070 | 0.0352 | 0.0106 | 0.1151 | 0.0309 | 0.0331 | 0.0070 |
| 安徽 | 0.1478 | 0.1344 | 0.0093 | 0.0247 | 0.1075 | 0.0313 | 0.1478 | 0.0344 |
表8 新兴技术产业创新网络协同度统计表Tab.8 Synergy statistics of innovation network of emerging technology industry |
| 地区 | 2010 | 2011 | 2012 | 2013 | 2014 | 2015 | 2016 | 2017 |
|---|---|---|---|---|---|---|---|---|
| 湖北 | -0.0502 | 0.1173 | 0.3152 | 0.4465 | 0.4975 | 0.4894 | 0.6686 | 0.7120 |
| 湖南 | -0.0567 | 0.1600 | 0.1626 | 0.3699 | 0.3723 | 0.4073 | 0.3413 | 0.4837 |
| 江西 | -0.0989 | 0.2634 | 0.2490 | 0.2253 | 0.2828 | 0.2277 | 0.4481 | 0.4610 |
| 河南 | -0.0557 | 0.2362 | 0.2501 | 0.3737 | 0.5139 | 0.3084 | 0.2071 | 0.1522 |
| 山西 | -0.0701 | 0.1041 | 0.2591 | 0.5274 | 0.4071 | 0.4117 | 0.2622 | 0.2876 |
| 安徽 | -0.0828 | 0.1709 | 0.1829 | 0.3550 | 0.3248 | 0.4160 | 0.6053 | 0.6056 |
| [1] |
邓龙安. 战略性新兴产业技术范式演进中的企业动态集成创新管理研究[J]. 科技进步与对策, 2013, 30(16):43-47.
|
| [2] |
杨忠泰. 地方培育发展战略性新兴产业与高新技术产业差异分析[J]. 科技管理研究, 2013, 33(11):127-131.
|
| [3] |
沈灏, 魏泽龙, 苏中锋. 多层次视角的新兴技术创新管理研究回顾与展望[J]. 科技进步与对策, 2017, 34(8):154-160.
|
| [4] |
孟娟. 网络环境下企业生态系统协同创新的影响机制研究[D]. 衡阳: 南华大学, 2008.
|
| [5] |
李星宇, 曹兴, 马慧. 长株潭地区新兴技术企业间协同创新影响因素与机制研究[J]. 经济地理, 2017, 37(6):122-128.
|
| [6] |
张慧颖, 吴红翠. 基于创新过程的区域创新系统协调发展的比较研究——兼析天津市区域创新复合系统协调性[J]. 情报杂志, 2011, 30(8):12-16.
|
| [7] |
齐二石, 李辉, 刘亮. 基于遗传算法的虚拟企业协同资源优化问题研究[J]. 中国管理科学, 2011, 19(1):77-83.
|
| [8] |
陶长琪, 陈文华, 林龙辉. 我国产业组织演变协同度的实证分析——以企业融合背景下的我国IT产业为例[J]. 管理世界, 2007(12):67-72.
|
| [9] |
|
| [10] |
解学梅. 企业协同创新影响因素与协同程度多维关系实证研究[J]. 科研管理, 2015, 36(2):69-78.
|
| [11] |
董豪, 曾剑秋, 沈孟如. 产业创新复合系统构建与协同度分析——以信息通信产业为例[J]. 科学学研究, 2016, 34(8):1 152-1 160.
|
| [12] |
|
| [13] |
|
| [14] |
吴笑, 魏奇锋, 顾新. 协同创新的协同度测度研究[J]. 软科学, 2015, 29(7):45-50.
|
| [15] |
李海东, 王帅, 刘阳. 基于灰色关联理论和距离协同模型的区域协同发展评价方法及实证[J]. 系统工程理论与实践, 2014, 34(7):1 749-1 755.
|
| [16] |
毕克新, 孙德花. 基于复合系统协调度模型的制造业企业产品创新与工艺创新协同发展实证研究[J]. 中国软科学, 2010(9):156-162.
|
| [17] |
王宏起, 徐玉莲. 科技创新与科技金融协同度模型及其应用研究[J]. 中国软科学, 2012(6):129-138.
|
| [18] |
|
| [19] |
|
| [20] |
刘英基. 高技术产业技术创新、制度创新与产业高端化协同发展研究——基于复合系统协同度模型的实证分析[J]. 科技进步与对策, 2015, 32(2):66-72.
|
| [21] |
李虹, 张希源. 区域生态创新协同度及其影响因素研究[J]. 中国人口·资源与环境, 2016, 26(6):43-51.
|
| [22] |
杨珍丽, 唐承丽, 周国华, 等. 城市群—开发区—产业集群协同发展研究——以长株潭城市群为例[J]. 经济地理, 2018, 38(1):78-84.
|
| [23] |
龚艳萍, 陈艳丽. 企业创新网络的复杂适应系统特征分析[J]. 研究与发展管理, 2010, 22(1):68-74.
|
/
| 〈 |
|
〉 |