
Coordinated Development and Evolution of Multidimensional Rail Transit and New Urbanization in Western China
Received date: 2020-09-23
Revised date: 2021-06-28
Online published: 2025-04-17
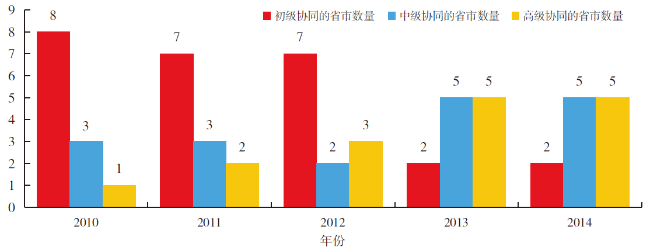
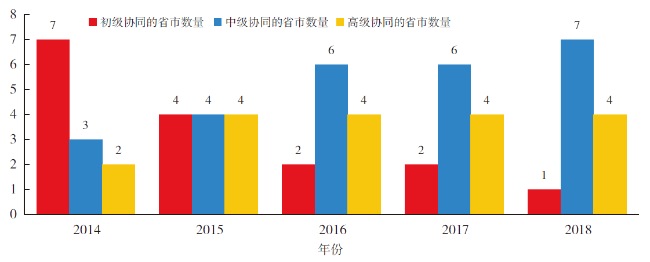
The construction of multi-dimensional rail transit system is of great significance to improve the level of regional economy,promote the process of regional integration and improve the quality of new urbanization. Based on 12 provinces and cities in Western China,this study constructs the evaluation index system of multi-dimensional rail transit and new urbanization,and analyzes the evolutionary relationship between multi-dimensional rail transit and new urbanization in Western China in stages by the means of data fitting,Kendall and Haken Model. The results show that: 1) the development level of multi-dimensional rail transit and new urbanization system in Western China is low,but the coordination degree is high. 2) New urbanization controls the path and direction of the co-evolution of multi-dimensional rail transit and new urbanization system,and the two systems presents the characteristics of long-term equilibrium and stability. 3) The coordinated development of multi-dimensional rail transit and new urbanization is in the intermediate stage,and the regional gradient difference is obvious. 4) From 2010 to 2014,the coordinated development of multi-dimensional rail transit and new urbanization evolves from intermediate coordination stage to advanced coordination stage,and from 2014 to 2018,it changes from primary coordination stage to intermediate coordination stage. The coordinated development of two systems in Western China has entered a higher evolution form. The research conclusion aims to provide reference and suggestions for promoting the coordinated development of rail transit and new urbanization in Western China.
ZENG Junwei , QIAN Yongsheng , ZHU Leipeng , GUANG Xiaoping , ZHANG Yongzhi . Coordinated Development and Evolution of Multidimensional Rail Transit and New Urbanization in Western China[J]. Economic geography, 2021 , 41(11) : 77 -86 . DOI: 10.15957/j.cnki.jjdl.2021.11.009
表1 多维轨道交通系统指标Tab.1 Indicators of multi-dimensional rail transit system |
| 一级指标 | 二级指标 | 指标权重 |
|---|---|---|
| 线网指标 | X1:线网长度(km) | 0.122 |
| X2:线网密度(km/km2) | 0.122 | |
| X3:正线延展里程(km) | 0.158 | |
| 运营指标 | X4:客运总量(万人) | 0.116 |
| X5:货运总量(万t) | 0.083 | |
| X6:旅客周转量(亿人km) | 0.074 | |
| X7:货物周转量(亿t·km) | 0.075 | |
| X8:行政区间货物交流(万t) | 0.080 | |
| 经济指标 | X9:轨道交通投资(万元) | 0.096 |
| X10:轨道交通就业人数(人) | 0.072 |
表2 新型城镇化系统指标Tab.2 Indicators of the new urbanization system |
| 一级指标 | 二级指标 | 指标权重 |
|---|---|---|
| 人口转移 | Y1:城镇化率(%) | 0.100 |
| Y2:城市人口密度(人/km2) | 0.105 | |
| 经济建设 | Y3:GDP(亿元) | 0.090 |
| Y4:第二、三产业产值比重(%) | 0.062 | |
| Y5:第三产业增加值(亿元) | 0.074 | |
| Y6:固定资产投资(亿元) | 0.052 | |
| 社会发展 | Y7:每千人拥有的医护人员数(人) | 0.056 |
| Y8:每万人拥有的公共交通车辆数(辆) | 0.052 | |
| 城乡统筹 | Y9:城镇居民可支配收入(元) | 0.070 |
| Y10:农村居民可支配收入(元) | 0.073 | |
| Y11:城乡居民消费水平比(%) | 0.094 | |
| 生态环境 | Y12:建成区绿化覆盖率(%) | 0.069 |
| 空间格局 | Y13:人均城市道路面积(m2) | 0.051 |
| Y14:城市建设用地占市区面积比重(%) | 0.052 |
表3 第一阶段(2010—2014年)哈肯模型计算结果Tab.3 Calculation results of the Haken model in the first stage (2010-2014) |
| 序号 | 模型假设 | 运动方程 | 结论 |
|---|---|---|---|
| ① | q1=GDJT q2=XXCZH | a.运动方程不成立 b.不满足绝热近似假设 | |
| ② | q1=XXCZH q2=GDJT | a.运动方程成立 b.满足绝热近似假设 c.模型假设成立,XXCZH为序参量 |
注:运动方程()内为t检验值,*、**、***分别表示在10%、5%、1%水平上显著,无*表示不显著,下同。 |
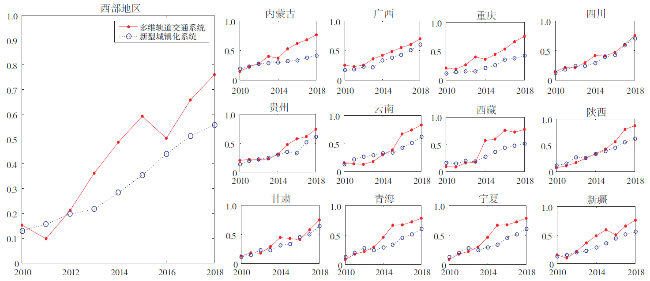
表4 第一阶段(2010—2014年)西部地区各省份多维轨道交通与新型城镇化协同发展得分值Tab.4 Scores for the coordinated development of multi-dimensional rail transit and new urbanization in the provinces(cities)in the western region during the first stage (2010-2014) |
| 行政区 | 2010 | 2011 | 2012 | 2013 | 2014 | 平均值 |
|---|---|---|---|---|---|---|
| 内蒙古 | 0.201 | 0.261 | 0.319 | 0.390 | 0.453 | 0.325 |
| 广西 | 0.402 | 0.490 | 0.594 | 0.707 | 0.809 | 0.600 |
| 重庆 | 0.517 | 0.621 | 0.761 | 0.902 | 0.992 | 0.758 |
| 四川 | 0.921 | 0.973 | 0.950 | 0.948 | 0.939 | 0.946 |
| 贵州 | 0.330 | 0.445 | 0.577 | 0.719 | 0.850 | 0.584 |
| 云南 | 0.183 | 0.240 | 0.297 | 0.362 | 0.477 | 0.312 |
| 西藏 | 0.019 | 0.025 | 0.055 | 0.089 | 0.119 | 0.058 |
| 陕西 | 0.617 | 0.752 | 0.903 | 0.960 | 0.961 | 0.839 |
| 甘肃 | 0.183 | 0.247 | 0.316 | 0.393 | 0.463 | 0.321 |
| 青海 | 0.175 | 0.240 | 0.306 | 0.378 | 0.442 | 0.308 |
| 宁夏 | 0.164 | 0.219 | 0.278 | 0.344 | 0.401 | 0.281 |
| 新疆 | 0.086 | 0.137 | 0.193 | 0.254 | 0.311 | 0.196 |
| 平均值 | 0.317 | 0.388 | 0.462 | 0.537 | 0.601 | 0.461 |
表5 第二阶段(2014—2018年)哈肯模型计算结果Tab.5 Calculation results of the Haken model in the second stage (2014-2018) |
| 序号 | 模型假设 | 运动方程 | 结论 |
|---|---|---|---|
| ① | q1=GDJT q2=XXCZH | ①运动方程成立 ②不满足绝热近似假设 ③模型假设不成立 | |
| ② | q1=XXCZH q2=GDJT | ①运动方程成立 ②满足绝热近似假设 ③模型假设成立,XXCZH 为序参量 |
表6 第二阶段(2014—2018年)西部地区各省份多维轨道交通与新型城镇化协同发展得分值Tab.6 Scores for the coordinated development of multi-dimensional rail transit and new urbanization in the second stage (2014-2018) of the provinces (cities) |
| 行政区 | 2014 | 2015 | 2016 | 2017 | 2018 | 平均值 |
|---|---|---|---|---|---|---|
| 内蒙古 | 0.293 | 0.301 | 0.366 | 0.371 | 0.423 | 0.351 |
| 广西 | 0.603 | 0.697 | 0.796 | 0.858 | 0.927 | 0.776 |
| 重庆 | 0.640 | 0.760 | 0.883 | 0.967 | 0.998 | 0.850 |
| 四川 | 0.998 | 0.955 | 0.900 | 0.840 | 0.825 | 0.904 |
| 贵州 | 0.314 | 0.330 | 0.403 | 0.451 | 0.507 | 0.401 |
| 云南 | 0.495 | 0.490 | 0.516 | 0.549 | 0.546 | 0.519 |
| 西藏 | 0.015 | 0.027 | 0.059 | 0.091 | 0.124 | 0.060 |
| 陕西 | 0.909 | 0.957 | 0.998 | 0.981 | 0.899 | 0.949 |
| 甘肃 | 0.302 | 0.351 | 0.418 | 0.377 | 0.439 | 0.377 |
| 青海 | 0.283 | 0.334 | 0.394 | 0.440 | 0.497 | 0.390 |
| 宁夏 | 0.248 | 0.293 | 0.351 | 0.383 | 0.435 | 0.342 |
| 新疆 | 0.168 | 0.209 | 0.232 | 0.283 | 0.308 | 0.240 |
| 平均值 | 0.439 | 0.475 | 0.526 | 0.549 | 0.577 | 0.513 |
| [1] |
|
| [2] |
|
| [3] |
|
| [4] |
金凤君, 武文杰. 铁路客运系统提速的空间经济影响[J]. 经济地理, 2007, 27(6):10-13,17.
|
| [5] |
赵丹, 张京祥. 高速铁路影响下的长三角城市群可达性空间格局演变[J]. 长江流域资源与环境, 2012, 21(4):391-398.
|
| [6] |
黄泰, 查爱欢, 应南茜. 高铁对都市圈城市旅游服务力格局演变的影响——以长三角都市圈为例[J]. 经济地理, 2014, 34(11):158-165.
|
| [7] |
|
| [8] |
覃成林, 杨礼杉. 铁路对沿线城市要素空间集聚的影响[J]. 城市问题, 2016(2):25-35.
|
| [9] |
吕韬, 姚士谋, 曹有挥. 中国城市群区域城际轨道交通布局模式[J]. 地理科学进展, 2010, 29(2):249-256.
|
| [10] |
李琳娜, 曹小曙, 黄晓燕. 世界大都会区城际轨道交通的发展规律[J]. 地理科学进展, 2012, 31(2):221-230.
|
| [11] |
李夏苗, 曾明华, 黄桂章. 基于交通系统与城市空间结构互馈机制的城际轨道交通走廊客流预测[J]. 中国铁道科学, 2009, 30(4):118-123.
|
| [12] |
赵渺希, 王世福, 张小星. 基于地铁出行的广佛城市功能联系研究[J]. 华南理工大学学报:自然科学版, 2012(6):152-158.
|
| [13] |
李燕, 王芳. 北京的人口、交通和土地利用发展战略:基于东京都市圈的比较分析[J]. 经济地理, 2017, 37(4):5-14.
|
| [14] |
陈小君. 我国大都市区轨道交通网络结构演进:由等级到协同[J]. 北京交通大学学报:社会科学版, 2015, 14(3):28-37.
|
| [15] |
王文静, 陆化普. 轨道交通与都市圈空间体系耦合关系研究[J]. 城市发展研究, 2013, 20(4):112-118.
|
| [16] |
顾朝林, 曹根榕. 基于城镇化发展趋势的中国交通网战略布局[J]. 地理科学, 2019, 39(6):865-873.
|
| [17] |
荣朝和. 铁路/轨道交通在新型城镇化及大都市时空形态优化中的作用[J]. 北京交通大学学报:社会科学版, 2014, 13(2):20-28.
|
| [18] |
张博野, 闫晨红, 曾菊新. “三铁”建设中的武汉城市圈空间效应[J]. 经济地理, 2014, 34(10):46-52.
|
| [19] |
孟德友, 陆玉麒, 樊新生. 基于投影寻踪模型的河南县域交通与经济协调性评价[J]. 地理研究, 2013, 32(11):2092-2106.
|
| [20] |
孟德友, 沈惊宏, 陆玉麒. 中原经济区县域交通优势度与区域经济空间耦合[J]. 经济地理, 2012, 32(6):7-14.
|
| [21] |
单飞, 李旭宏, 张军. 基于FAHP和加权灰色关联度的区域交通一体化评价方法[J]. 交通运输系统工程与信息, 2011(5):147-154.
|
| [22] |
米鹏飞, 钱勇生, 曾俊伟. 基于VAR模型的交通运输与城镇化发展的动态关系研究——以甘肃省为例[J]. 现代城市研究, 2019(1):69-74.
|
| [23] |
汪德根, 孙枫. 长江经济带陆路交通可达性与城镇化空间耦合协调度[J]. 地理科学, 2018, 38(7):1089-1097.
|
| [24] |
郑玉雯, 薛伟贤. 丝绸之路经济带沿线国家协同发展的驱动因素——基于哈肯模型的分阶段研究[J]. 中国软科学, 2019(2):78-92.
|
| [25] |
游细斌, 杨青生, 付远方. 区域交通系统与城镇系统耦合发展研究——以潮州市域为例[J]. 经济地理, 2017, 37(12):96-102.
|
| [26] |
戚晓旭, 杨雅维, 杨智尤. 新型城镇化评价指标体系研究[J]. 宏观经济管理, 2014(2):51-54.
|
| [27] |
范英飞, 章国鹏, 徐梦清. 成渝城市群经济与交通运输通道协同演化表征方法[J]. 交通运输系统工程与信息, 2018, 18(3):238-245.
|
| [28] |
何平. 数理统计与多元分析[M]. 成都: 西南交通大学出版社, 2007.
|
| [29] |
莫杨辉, 张培林, 谢羽盟. 新型城镇化与综合交通发展的互动关系计量研究[J]. 交通运输系统工程与信息, 2019(5):13-19.
|
| [30] |
李桥兴, 胡雨晴. 基于哈肯模型的我国大数据产业演化机制研究[J]. 工业技术经济, 2020, 39(3):125-131.
|
| [31] |
李琳, 刘莹. 中国区域经济协同发展的驱动因素——基于哈肯模型的分阶段实证研究[J]. 地理研究, 2014, 33(9):1603-1616.
|
/
| 〈 |
|
〉 |