
Spatial-temporal Patterns of Grain Output and Its Spatial Relationship with Economic Development at the County Level in China
Received date: 2020-12-07
Revised date: 2021-08-26
Online published: 2025-04-17
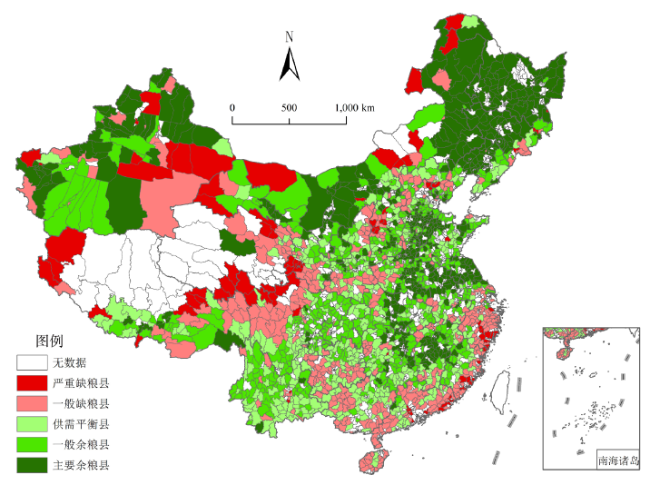
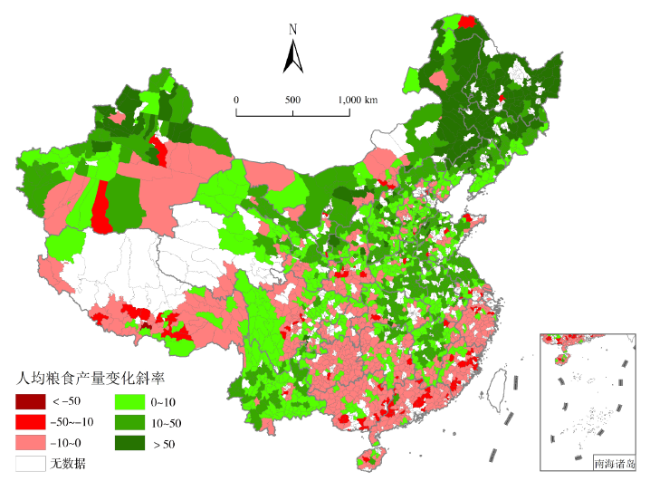
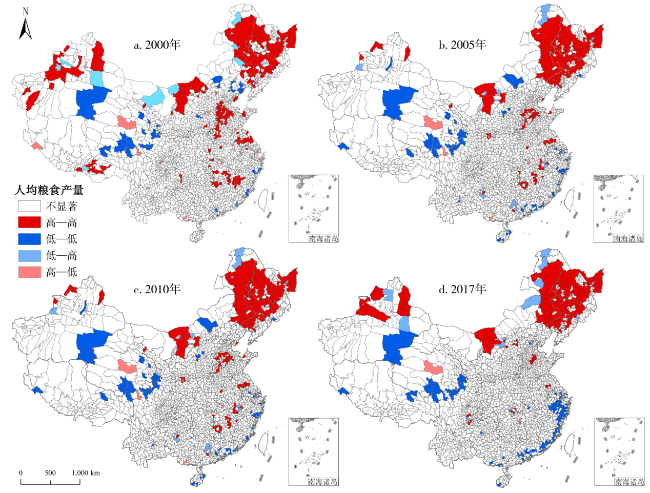
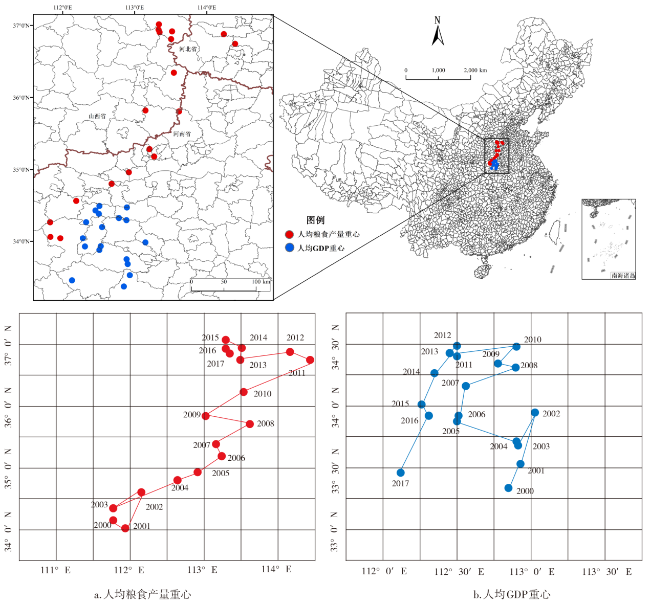
Grain is not only the basic necessity of human survival,but also the material basis for regional economic development. Analyzing the spatial-temporal patterns of grain production and its relationship with economic development has important significance for comprehensive understanding of current grain security in China. It's important to understand the coordinated development of grain production and regional economy,and formulate differentiated grain policies. Based on the statistic data of each county between 2000 and 2017,the study takes 2 019 counties in China as objects. Using the spatial autocorrelation analysis,gravity center model and CGE index,it analyzes the regional pattern of grain output and its spatial relationship with economic development at the county level in China. The results show that: 1) There are obvious regional differentiation characteristics in the spatial pattern of per capita grain output in China. The grain deficit areas are concentrated in Qinghai-Tibet region,Loess Plateau region and south China. The surplus grain regions are concentrated in northeast region,Huanghe-Huaihe-Haihe region,Mongolia-Xinjiang region and the middle and lower reaches of the Yangtze River. 2) The trend of per capita grain output change in China is mainly increased,especially in northeast China and Huanghe-Huaihe-Haihe region,but it shows decreasing trend in the middle and lower reaches of the Yangtze River and south China. The spatial agglomeration characteristics of per capita grain output in China are obvious. The regional division of labor of grain production has become clearer over time. 3) The gravity center of per capita grain output and the gravity center of economy in China are separated. The gravity center of per capita grain output moves to the northeast,while the gravity center of economy moves westward as a whole. It presents spatial unbalanced development in the grain production and economy in China. The consistency of grain production and economic development has improved as time goes on. The areas which need to be improved are concentrated in the west of the middle and lower reaches of the Yangtze River,the east of southwestern region,and the west of Loess Plateau in central China.
XIE Kun , DING Mingjun , XIN Liangjie , CHEN Liwen . Spatial-temporal Patterns of Grain Output and Its Spatial Relationship with Economic Development at the County Level in China[J]. Economic geography, 2021 , 41(11) : 167 -175 . DOI: 10.15957/j.cnki.jjdl.2021.11.018
表1 中国不同人均粮食产量类型县域的分布情况Tab.1 The distribution of per capita grain output at different types in different regions of China |
| 严重缺粮县 | 一般缺粮县 | 供需平衡县 | 一般余粮县 | 主要余粮县 | ||||||||||
|---|---|---|---|---|---|---|---|---|---|---|---|---|---|---|
| 个数(个) | 占比(%) | 个数(个) | 占比(%) | 个数(个) | 占比(%) | 个数(个) | 占比(%) | 个数(个) | 占比(%) | |||||
| 全国 | 106 | 5.25 | 428 | 21.20 | 432 | 21.40 | 540 | 26.75 | 513 | 25.41 | ||||
| 东北区 | 5 | 3.33 | 8 | 5.33 | 10 | 6.67 | 15 | 10.00 | 112 | 74.67 | ||||
| 黄淮海区 | 6 | 1.75 | 35 | 10.20 | 38 | 11.08 | 117 | 34.11 | 147 | 42.86 | ||||
| 黄土高原区 | 15 | 5.51 | 67 | 24.63 | 71 | 26.10 | 76 | 27.94 | 43 | 15.81 | ||||
| 蒙新区 | 19 | 11.52 | 17 | 10.30 | 9 | 5.45 | 31 | 18.79 | 89 | 53.94 | ||||
| 青藏区 | 16 | 18.39 | 28 | 32.18 | 18 | 20.69 | 16 | 18.39 | 9 | 10.34 | ||||
| 长江中下游区 | 25 | 5.29 | 108 | 22.83 | 95 | 20.08 | 139 | 29.39 | 106 | 22.41 | ||||
| 华南区 | 11 | 6.40 | 88 | 51.16 | 59 | 34.30 | 12 | 6.98 | 2 | 1.16 | ||||
| 西南区 | 9 | 2.52 | 77 | 21.57 | 132 | 36.97 | 134 | 37.54 | 5 | 1.40 | ||||
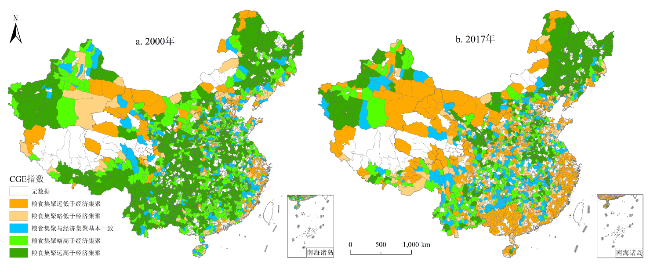
表2 中国不同CGE指数类型县域的分布情况(单位:%)Tab.2 The distribution of CGE index at different types in different regions of China |
| 区域 | 粮食集聚远低于 经济集聚 | 粮食集聚略低于 经济集聚 | 粮食集聚与经济 集聚基本一致 | 粮食集聚略高于 经济集聚 | 粮食集聚远高于 经济集聚 | |||||||||
|---|---|---|---|---|---|---|---|---|---|---|---|---|---|---|
| 2000 | 2017 | 2000 | 2017 | 2000 | 2017 | 2000 | 2017 | 2000 | 2017 | |||||
| 全国 | 9.00 | 29.82 | 7.01 | 13.92 | 12.38 | 17.10 | 25.20 | 18.44 | 46.42 | 20.72 | ||||
| 东北区 | 10.67 | 12.00 | 6.00 | 6.67 | 9.33 | 6.00 | 19.33 | 5.33 | 54.67 | 70.00 | ||||
| 黄淮海区 | 8.16 | 21.28 | 9.62 | 14.58 | 19.83 | 16.62 | 27.99 | 22.45 | 34.40 | 25.07 | ||||
| 黄土高原区 | 7.01 | 21.40 | 3.69 | 15.13 | 21.40 | 15.13 | 21.40 | 19.93 | 59.04 | 25.09 | ||||
| 蒙新区 | 13.50 | 26.99 | 9.20 | 11.04 | 23.93 | 11.04 | 23.93 | 12.27 | 46.63 | 45.40 | ||||
| 青藏区 | 12.50 | 37.50 | 7.95 | 15.91 | 21.59 | 15.91 | 21.59 | 19.32 | 48.86 | 7.95 | ||||
| 长江中下游区 | 13.16 | 35.88 | 7.22 | 14.44 | 29.09 | 23.14 | 29.09 | 18.26 | 36.09 | 8.28 | ||||
| 华南区 | 8.77 | 80.12 | 11.70 | 12.28 | 38.60 | 6.43 | 38.60 | 0.58 | 27.49 | 0.58 | ||||
| 西南区 | 2.25 | 19.15 | 3.66 | 16.06 | 17.75 | 23.94 | 17.75 | 30.42 | 67.04 | 10.42 | ||||
| [1] |
胡甜, 鞠正山, 周伟. 中国粮食供需的区域格局研究[J]. 地理学报, 2016, 71(8):1372-1383.
|
| [2] |
邓宗兵, 封永刚, 张俊亮, 等. 中国粮食生产区域格局变动及成因的实证分析[J]. 宏观经济研究, 2014(3):94-113.
|
| [3] |
刘影, 肖池伟, 李鹏, 等. 1978—2013年中国粮食主产区“粮—经”关系分析[J]. 资源科学, 2015, 37(10):1891-1901.
|
| [4] |
高军波, 刘彦随, 乔伟峰, 等. 中国典型农区县域社会不平等空间模式与地域差异——以河南省为例[J]. 地理研究, 2016, 35(5):885-897.
|
| [5] |
黄爱军. 我国粮食生产区域格局的变化趋势探讨[J]. 农业经济问题, 1995(2):20-23.
|
| [6] |
鲁奇, 吕鸣伦. 五十年代以来我国粮食生产地域格局变化趋势及原因初探[J]. 地理科学进展, 1997, 16(1):31-36.
|
| [7] |
伍山林. 中国粮食生产区域特征与成因研究——市场化改革以来的实证分析[J]. 经济研究, 2000(10):38-45,79.
|
| [8] |
殷培红, 方修琦. 中国粮食安全脆弱区的识别及空间分异特征[J]. 地理学报, 2008, 63(10):1064-1072.
|
| [9] |
殷培红, 方修琦, 马玉玲, 等. 21世纪初我国粮食供需的新空间格局[J]. 自然资源学报, 2006, 21(4):625-631.
|
| [10] |
邓宗兵, 封永刚, 张俊亮, 等. 中国粮食生产空间布局变迁的特征分析[J]. 经济地理, 2013, 33(5):117-123.
|
| [11] |
|
| [12] |
|
| [13] |
解伟, 魏玮, 崔琦. 气候变化对中国主要粮食作物单产影响的文献计量Meta分析[J]. 中国人口·资源与环境, 2019, 29(1):79-85.
|
| [14] |
|
| [15] |
张利国, 陈苏. 中国人均粮食占有量时空演变及驱动因素[J]. 经济地理, 2015, 35(3):171-177.
|
| [16] |
戈大专, 龙花楼, 张英男, 等. 中国县域粮食产量与农业劳动力变化的格局及其耦合关系[J]. 地理学报, 2017, 72(6):1063-1077.
|
| [17] |
马彪, 陈璐. 粮食主产区粮食生产与经济发展的“剪刀差”现象分析[J]. 农村经济, 2019(5):51-59.
|
| [18] |
陆婷婷, 夏四友. 江苏省粮食生产与经济发展时空耦合与优化策略[J]. 东北农业科学, 2020, 45(2):95-100.
|
| [19] |
辛岭, 蒋和平. 产粮大县粮食生产与农民收入协调性研究——以河南省固始县为例[J]. 农业技术经济, 2016(2):45-51.
|
| [20] |
齐蘅, 吴玲. 我国粮食主产区粮食生产与收入水平的协调度分析[J]. 经济地理, 2017, 37(6):156-163.
|
| [21] |
|
| [22] |
周立青, 程叶青. 黑龙江省粮食生产的时空格局及动因分析[J]. 自然资源学报, 2015, 30(3):491-501.
|
| [23] |
杨慧, 渠丽萍, 杨保战, 等. 粮食与经济重心迁移路径及空间耦合关系分析——以湖北省粮食主产县为例[J]. 中国农业资源与区划, 2018, 39(12):40-47.
|
| [24] |
潘竟虎, 张建辉. 中国县域人均粮食占有量的时空差异及驱动因素[J]. 长江流域资源与环境, 2017, 26(3):410-418.
|
| [25] |
李亚婷, 潘少奇, 苗长虹. 中国县域人均粮食占有量的时空格局——基于户籍人口和常住人口的对比分析[J]. 地理学报, 2014, 69(12):1753-1766.
|
| [26] |
徐海亚, 朱会义. 基于自然地理分区的1990—2010年中国粮食生产格局变化[J]. 地理学报, 2015, 70(4):582-590.
|
| [27] |
陈彦光. 基于Moran统计量的空间自相关理论发展和方法改进[J]. 地理研究, 2009, 28(6):1449-1463.
|
| [28] |
赵璐, 赵作权. 基于特征椭圆的中国经济空间分异研究[J]. 地理科学, 2014, 34(8):979-986.
|
| [29] |
封志明, 刘晓娜. 中国人口分布与经济发展空间一致性研究[J]. 人口与经济, 2013(2):3-11.
|
| [30] |
邱爽, 周光美. 农业气象灾害对粮食产量影响的实证研究——基于西南四省市数据[J]. 生态经济, 2019, 35(1):108-113.
|
| [31] |
刘彦随, 翟荣新. 中国粮食生产时空格局动态及其优化策略探析[J]. 地域研究与开发, 2009, 28(1):1-5.
|
| [32] |
刘玉, 高秉博, 潘瑜春. 中国县域人均粮食占有量空间变异特征研究[J]. 中国农业大学学报, 2012, 17(3):154-162.
|
| [33] |
王凤, 刘艳芳, 孔雪松, 等. 中国县域粮食产量时空演变及影响因素变化[J]. 经济地理, 2018, 38(5):142-151.
|
| [34] |
刘颖杰, 林而达. 气候变暖对中国不同地区农业的影响[J]. 气候变化研究进展, 2007, 3(4):229-233.
|
| [35] |
国务院. 中国的粮食安全白皮书[N/OL]. 2019-10-14.
|
| [36] |
石淑芹, 陈佑启, 姚艳敏, 等. 中国区域性耕地变化与粮食生产的关系研究:以东北地区为例[J]. 自然资源学报, 2008, 23(3):361-368.
|
| [37] |
房艳刚, 刘建志. 东北地区县域粮劳变化耦合模式与乡村发展类型[J]. 地理学报, 2020, 75(10):2241-2255.
|
| [38] |
潘桔. 中国区域经济发展不平衡测度及影响因素分析[D]. 沈阳: 辽宁大学, 2020.
|
| [39] |
樊杰, 王亚飞. 40年来中国经济地理格局变化及新时代区域协调发展[J]. 经济地理, 2019, 39(1):1-7.
|
| [40] |
涂建军, 刘莉, 张跃, 等. 1996—2015年我国经济重心的时空演变轨迹——基于291个地级市数据[J]. 经济地理, 2018, 38(2):18-26.
|
/
| 〈 |
|
〉 |