
Spatial Pattern and Influencing Factors of Population Shrinkage in Siberian and Far East Federal Districts in Russia
Received date: 2021-02-15
Revised date: 2021-07-31
Online published: 2025-04-17
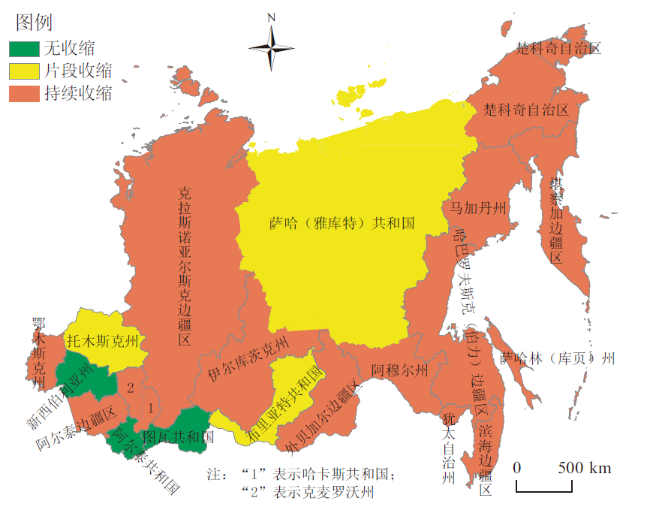
Under the background of "the Belt and Road Initiative" and the China-Mongolia-Russia economic corridor,this paper studied the pattern and influencing factors of population shrinkage in Siberian and Far East Federal Districts in Russia. Firstly,this paper calculated the population shrinkage degree with regard to the time trace and spatial differentiation aspects of Siberian and Far East Federal Districts in 2002-2017. Secondly,the influencing factors identification of the population shrinkage of the Siberian and Far East Federal Districts was performed by using influencing factors model of population shrinkage. The results are as following: 1) Both the demographic changes in Siberian and Far East Federal Districts have been universally contracting with short-term locally growing,but 86% of the federal subjects are in a state of population shrinking. The population shrinkage is affected by external shocks such as the international financial crisis in Siberian Federal District, and it is determined by the internal factors such as the periodical variation of city in Far East Federal District. 2) The types of population shrinkage are central attack type, hollow attenuation type and resource-shrinkage type respectively. The population number of Republic of Altay,Republic of Tyva,and Novosibirsk Region was increased from 2002 to 2017. The population number of Tomsk Region,Republic of Sakha(Yakutia),and Republic of Buryatia showed the trend of short-term locally growing from 2002 to 2017. In 2002-2017,it showed decreasing characteristic in Altay Territory,Kemerovo Region,Irkutsk Region,Primorsky Territory,Omsk Region,Khabarovsk Territory,Amur Region,Krasnoyarsk Territory,Zabaikalsk Territory,Sakhalin Region,Kamchatka Territory,Magadan Region,Jewish Autonomous Area,Republic of Khakasia and Chukotka Autonomous Area. 3) From the perspective of space,the population shrinking degree of the whole area (Siberian and Far East Federal Districts) shows a "high value in the east,lower in the west" spatial pattern,which in general displays a population shrinkage tendency of H-shape. It's found that the population shrinkage is affected by the insufficient economic power,weak financial capitals, poor social infrastructure,sharp decreasing working population and aggravated ageing population.
CHU Nanchen , ZHANG Pingyu , WU Xiangli , LI He , YANG Qifeng , LI Hanzhu . Spatial Pattern and Influencing Factors of Population Shrinkage in Siberian and Far East Federal Districts in Russia[J]. Economic geography, 2021 , 41(11) : 1 -8 . DOI: 10.15957/j.cnki.jjdl.2021.11.001
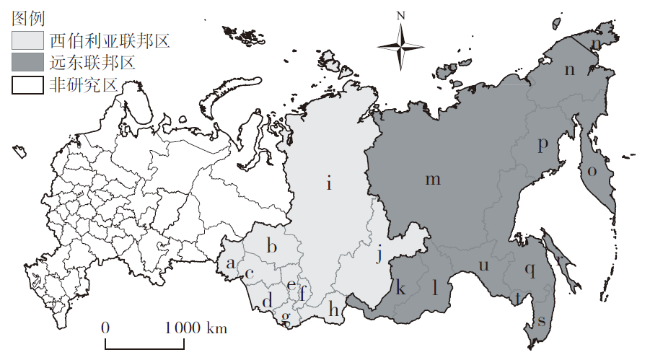
图1 研究区略图注:基于国家自然资源部标准地图服务系统的标准地图(审图号:GS(2016)2276号)绘制,底图无修改(图3同)。字母代码如下:a鄂木斯克州,b托木斯克州,c新西伯利亚州,d阿尔泰边疆区,e克麦罗沃州,f哈卡斯共和国,g阿尔泰共和国,h图瓦共和国,i克拉斯诺亚尔斯克边疆区,j伊尔库茨克州,k布里亚特共和国,l外贝加尔边疆区,m萨哈(雅库特)共和国,n楚科奇自治区,o堪察加边疆区,p马加丹州,q哈巴罗夫斯克(伯力)边疆区,r萨哈林(库页)州,s滨海边疆区,t犹太自治州,u阿穆尔州。 Fig.1 Sketch map of the study area |
表1 收缩联邦主体的类型划分Tab.1 Classification of population shrinkage of federal subjects |
| 收缩类型 | 特征描述 | 界定标准 |
|---|---|---|
| 人口无收缩 | 2002—2017年人口为正增长的联邦主体 | Pi2002-2017>0 |
| 人口阶段性收缩 | 2002—2017年人口为正增长,但其间至少有5年以上人口呈负增长的联邦主体 | Pi2002-2017>0且Pi>5a<0 |
| 人口持续性收缩 | 2002—2017年人口为负增长的联邦主体 | Pi2002-2017<0 |
表2 特征变量的选择Tab.2 Selection of characteristic variables |
| 特征变量 | 单位 | 符号 | 均值 | 最小值 | 最大值 | 标准差 | |
|---|---|---|---|---|---|---|---|
| 经济因素 | 人均GDP | 卢布 | product | 590 002 | 204 826 | 1 573 869 | 398 543 |
| 人均每月货币收入 | 卢布 | income | 32 984 | 21 209 | 70 904 | 13 789 | |
| 人均零售贸易营业额 | 卢布 | trade | 177 635 | 131 401 | 289 573 | 42 130 | |
| 经济中的固定资产 | 十亿卢布 | capital | 1 378 | 141 | 3 227 | 1 040 | |
| 政府角色 | 人均政府固定资本投资 | 卢布 | investment | 155 596 | 35 828 | 610 975 | 152 283 |
| 政府综合预算支出 | 百万卢布 | finance | 98 412 | 11 386 | 251 314 | 64 890 | |
| 在国家机关和地方自治机构雇佣的员工 | 千人 | employment | 23 | 3 | 52 | 14 | |
| 平均每月名义工资 | 卢布 | salary | 45 590 | 22 732 | 92 368 | 18 808 | |
| 社会因素 | 普通教育机构数量 | 个 | education | 447 | 42 | 1 009 | 310 |
| 门诊和综合医院数量 | 个 | medical | 194 | 27 | 569 | 165 | |
| 公路营业里程 | km | highway | 11 963 | 851 | 37 098 | 9 800 | |
| 移动无线电话连接的用户设备 | 件 | telephone | 2 175 | 84 | 5 175 | 1 686 |
表3 计量模型估计结果Tab.3 Estimation results of econometric model |
| 统计项 | 显著性(双侧) | 标准化系数 |
|---|---|---|
| 人均GDP | 0.039 | 0.073 |
| 人均每月货币收入 | 0.008 | 0.319 |
| 人均零售贸易营业额 | 0.087 | - |
| 经济中的固定资产 | 0.001 | 0.004 |
| 人均政府固定资本投资 | 0.016 | 0.108 |
| 政府综合预算支出 | 0.001 | 0.066 |
| 在国家机关和地方自治机构雇用的员工 | 0.000 | 0.120 |
| 平均每月名义工资 | 0.004 | -0.327 |
| 普通教育机构数量 | 0.000 | 0.080 |
| 门诊和综合医院数量 | 0.000 | 0.083 |
| 公路营业里程 | 0.000 | 0.013 |
| 移动无线电话连接的用户设备 | 0.000 | 0.625 |
| [1] |
刘振, 戚伟, 王雪芹, 等. 国内外人口收缩研究进展综述[J]. 世界地理研究, 2019, 28(1):13-23.
|
| [2] |
|
| [3] |
|
| [4] |
|
| [5] |
|
| [6] |
|
| [7] |
|
| [8] |
|
| [9] |
|
| [10] |
|
| [11] |
|
| [12] |
|
| [13] |
|
| [14] |
|
| [15] |
|
| [16] |
冯春萍. 俄罗斯人口危机透析[J]. 俄罗斯研究, 2002(4):19-23,51.
|
| [17] |
冯春萍. 当前俄罗斯人口地理变动的新特点[J]. 人文地理, 2002, 17(5):60-64.
|
| [18] |
于小琴. 俄罗斯人口低流动性论析[J]. 俄罗斯中亚东欧研究, 2011(5):43-52.
|
| [19] |
李莎, 刘卫东. 俄罗斯人口分布及其空间格局演化[J]. 经济地理, 2014, 34(2):42-49.
|
| [20] |
高际香. 俄罗斯地区经济发展之人口视角初探[J]. 俄罗斯学刊, 2016, 6(2):47-54.
|
| [21] |
李同升, 黄国胜. 俄罗斯西伯利亚人口状况及其地理分析[J]. 人文地理, 2007, 22(3):120-124.
|
| [22] |
田畑朋子, 郑宇超. 俄罗斯远东地区人口减少问题[J]. 俄罗斯学刊, 2014, 4(1):56-67.
|
| [23] |
初楠臣, 张平宇, 李鹤, 等. 俄罗斯西伯利亚与远东地区城镇化发展水平测度及空间分异研究[J]. 地理科学, 2018, 38(7):1069-1078.
|
| [24] |
高舒琦, 龙瀛. 东北地区收缩城市的识别分析及规划应对[J]. 规划师, 2017, 33(1):26-32.
|
| [25] |
周恺, 钱芳芳, 严妍. 湖南省多地理尺度下的人口“收缩地图”[J]. 地理研究, 2017, 36(2):267-280.
|
| [26] |
杜志威, 张虹鸥, 叶玉瑶, 等. 2000年以来广东省城市人口收缩的时空演变与影响因素[J]. 热带地理, 2019, 39(1):20-28.
|
| [27] |
季志业, 冯玉军. 俄罗斯发展前景与中俄关系走向[M]. 北京: 时事出版社, 2016.
|
/
| 〈 |
|
〉 |