
Spatial and Temporal Effecs of Housing Price in Urban School Districts Based on Education Equity:A Case Study of Public Pimary School in the Main Urban Area of Nanjing
Received date: 2018-12-10
Revised date: 2019-04-18
Online published: 2025-04-17
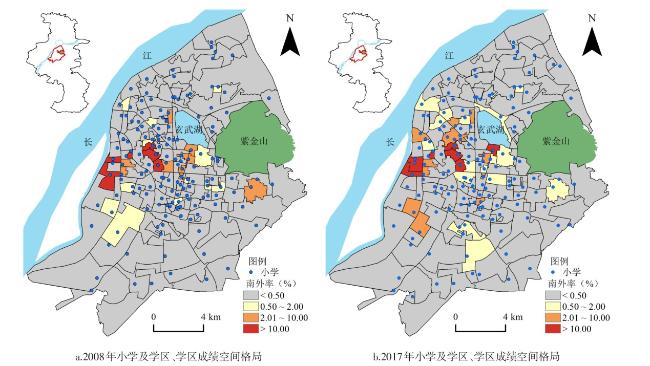
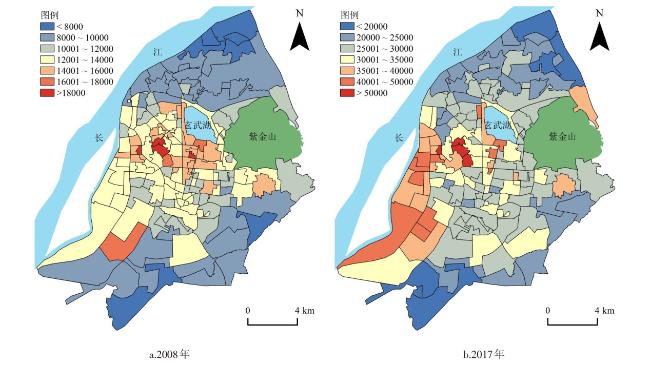
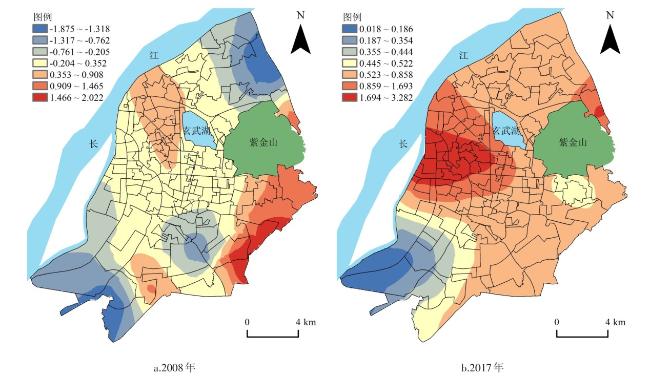
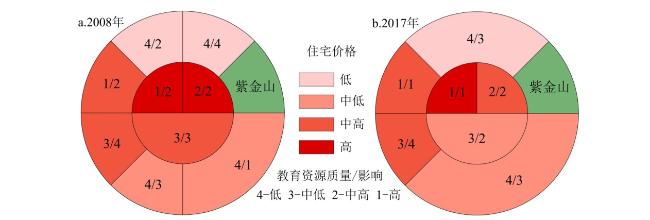
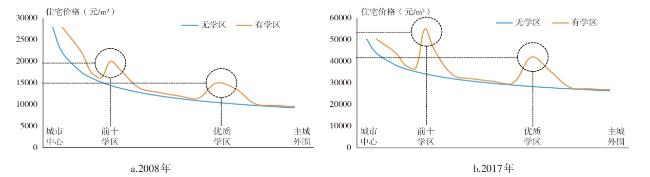
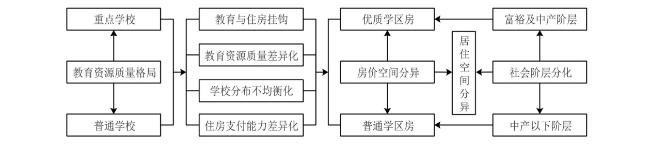
Education equity is one of the hot issues in China's social transformation period. This study takes the main urban area of Nanjing as an research area and selects the public primary school and residence community in 2008 and 2017 as the research object. Based on the hedonic price model and geographically weighted regression (GWR) model, this study analyze the effect and degree of location characteristics, architectural characteristics, school district characteristics, and neighborhood characteristics on housing price, and explores the spatial heterogeneity of the impact of educational resource quality on housing price. The results of this study indicate that: 1)The housing price in the main urban area shows the decreasing characteristics from the top-level prestigious school district to the periphery, it changes the core-edge structure of the urban housing price. 2)The influence of acceptance rate of Nanjing Foreign Language School(junior high school) on housing price rises from the third to the first in the main urban area, and has significant spatial heterogeneity on housing price. 3)With the increasing spillover effect of quality educational resources on the housing price of the school district, the demand for economic capital in quality school district is increasing, it triggers many social problems such as residential differentiation, educational alienation and class solidification. The spatial and temporal effects of school district housing caused by the uneven spatial distribution of quality education resources have affected education and social equity. It is of great social significance to formulate policies and measures to optimize quality education resources.
YIN Shanggang , HU Xin , MA Zhifei , SONG Weixuan . Spatial and Temporal Effecs of Housing Price in Urban School Districts Based on Education Equity:A Case Study of Public Pimary School in the Main Urban Area of Nanjing[J]. Economic geography, 2019 , 39(9) : 82 -93 . DOI: 10.15957/j.cnki.jjdl.2019.09.011
表1 排名前十位小学学区及住宅价格排名情况Tab.1 The top 10 housing prices in elementary school districts |
| 学校成 绩排名 | 2008年 | 2017年 | ||||||||
|---|---|---|---|---|---|---|---|---|---|---|
| 小学名称 | 录取率(%) | 住宅价格(元/m2) | 住宅价格排名 | 小学名称 | 录取率(%) | 住宅价格(元/m2) | 住宅价格排名 | |||
| 1 | 拉萨路 | 16.01 | 17 300 | 5 | 琅琊路 | 17.01 | 62 794 | 2 | ||
| 2 | 琅琊路 | 14.05 | 22 033 | 1 | 拉萨路 | 16.25 | 54 359 | 3 | ||
| 3 | 力学 | 12.24 | 21 059 | 2 | 芳草园 | 15.60 | 53 066 | 4 | ||
| 4 | 金陵汇文 | 10.82 | 13 795 | 35 | 北京东路 | 13.20 | 40 597 | 15 | ||
| 5 | 芳草园 | 10.24 | 19 826 | 3 | 力学 | 12.50 | 63 777 | 1 | ||
| 6 | 银城 | 10.18 | 14 579 | 22 | 银城 | 11.34 | 46 948 | 5 | ||
| 7 | 南师附小 | 7.93 | 15 238 | 10 | 金陵汇文 | 10.07 | 46 629 | 6 | ||
| 8 | 北京东路 | 7.59 | 16 854 | 7 | 南师附小 | 7.14 | 40 729 | 14 | ||
| 9 | 天正 | 5.58 | 15 336 | 9 | 天正 | 6.98 | 42 475 | 11 | ||
| 10 | 汉江路 | 5.01 | 15 673 | 8 | 游府西街 | 6.36 | 45 998 | 7 | ||
表2 南京主城区住宅价格分异影响因素Tab.2 The impact factors of differentiation of housing price in the main urban area of Nanjing |
| 变量类型 | 特征变量 | 变量描述 | 数据来源 |
|---|---|---|---|
| 区位特征 | 中心位势 | 与新街口和最近二级商业中心距离之乘积 | Google Earth |
| 交通位势 | 与最近地铁站的距离 | Google Earth | |
| 景观位势 | 与最近城市大型山水景观资源的距离 | Google Earth | |
| 建筑特征 | 住宅房龄 | 距离住宅建成年份 | 挂牌数据 |
| 绿化率 | 小区绿化面积/小区规划面积 | 挂牌数据 | |
| 容积率 | 地上建筑面积/占地面积 | 挂牌数据 | |
| 学区特征 | 学区成绩 | 所属学区南外录取率 | 公布数据 |
| 学区机会 | 所属学区内住宅套数占研究区住宅套数比重 | 挂牌数据计算 | |
| 学校距离 | 与所属学区内小学的距离 | Google Earth | |
| 邻里特征 | 生活配套 | 与最近大型商场和各类超市的距离 | Google Earth |
| 医疗设施 | 与最近医院(含诊所、卫生站)的距离 | Google Earth | |
| 金融配套 | 与最近银行网点(不包括ATM机网点)的距离 | Google Earth | |
| 休闲设施 | 与最近城市公园广场、大学校园和文化体育场馆的距离 | Google Earth | |
| 餐饮配套 | 与最近酒店、饭店的距离 | Google Earth | |
| 商务配套 | 与最近商务大厦的距离 | Google Earth |
注:主城区二级商业中心包括:河西、城南、湖南路。主城区大型山水景观资源包括:紫金山、幕府山、将军山;玄武湖、月牙湖、内外秦淮河、长江、夹江;小桃园公园、莫愁湖公园、雨花台风景区等。 |
表3 特征价格模型回归结果Tab.3 The regression results of the hedonic price model |
| 变量 | 2008年 | 2017年 | |||||||||||
|---|---|---|---|---|---|---|---|---|---|---|---|---|---|
| 主城整体 | 优质学区 | 普通学区 | 主城整体 | 优质学区 | 普通学区 | ||||||||
| 系数 | 统计量 | 系数 | 统计量 | 系数 | 统计量 | 系数 | 统计量 | 系数 | 统计量 | 系数 | 统计量 | ||
| (常数项) | 10.391*** | 157.759 | 10.449*** | 54.469 | 10.411*** | 153.883 | 11.268*** | 134.537 | 10.916*** | 62.496 | 11.294*** | 131.485 | |
| ln中心位势 | -0.339*** | -17.301 | -0.289*** | -4.884 | -0.347*** | -17.077 | -0.183*** | -9.108 | -0.046 | -1.101 | -0.198*** | -9.562 | |
| ln交通位势 | 0.054*** | 4.025 | 0.074* | 1.817 | 0.047*** | 3.454 | -0.078*** | -4.416 | -0.115** | -2.566 | -0.082*** | -4.542 | |
| ln景观位势 | -0.046*** | -2.946 | -0.069 | -1.324 | -0.056*** | -3.459 | -0.034** | -2.258 | 0.008 | 0.243 | -0.035** | -2.212 | |
| ln住宅房龄 | -0.112*** | -16.411 | -0.066*** | -3.370 | -0.115*** | -16.377 | -0.183*** | -14.179 | -0.124*** | -4.719 | -0.189*** | -14.165 | |
| 绿化率 | 0.004*** | 8.152 | 0.001 | 0.506 | 0.005*** | 8.206 | 0.006*** | 10.029 | 0.003*** | 2.577 | 0.006*** | 10.005 | |
| 容积率 | -0.002 | -0.527 | -0.004 | -0.448 | 0.000 | -0.096 | -0.005 | -1.326 | 0.008 | 0.944 | -0.008* | -1.929 | |
| 学区成绩 | 0.021*** | 8.911 | 0.022*** | 5.771 | 0.017*** | 2.863 | 0.036*** | 11.630 | 0.045*** | 17.141 | 0.023** | 2.033 | |
| 学区机会 | -0.001*** | -2.678 | 0.001 | 1.234 | -0.002*** | -3.457 | -0.004*** | -4.501 | -0.006 | -1.327 | -0.004*** | -4.334 | |
| ln学校距离 | -0.006 | -0.922 | -0.053*** | -2.699 | -0.005 | -0.731 | -0.020*** | -2.840 | -0.059*** | -3.380 | -0.013* | -1.785 | |
| ln生活配套 | 0.175*** | 3.573 | 0.126 | 0.917 | 0.171*** | 3.474 | 0.111** | 2.300 | 0.034 | 0.299 | 0.152*** | 3.014 | |
| ln医疗设施 | 0.044 | 1.108 | 0.401*** | 4.213 | 0.021 | 0.524 | 0.063 | 1.619 | 0.360*** | 4.630 | 0.016 | 0.394 | |
| ln金融配套 | -0.063* | -1.682 | -0.334** | -2.320 | -0.040 | -1.058 | 0.115*** | 3.041 | 0.134 | 1.345 | 0.107*** | 2.751 | |
| ln休闲设施 | -0.101*** | -4.488 | -0.045 | -0.568 | -0.081*** | -3.567 | -0.164*** | -6.762 | -0.026 | -0.413 | -0.188*** | -7.581 | |
| ln餐饮配套 | 0.031 | 1.135 | 0.073 | 0.823 | 0.019 | 0.708 | 0.060** | 2.207 | 0.082 | 1.280 | 0.048* | 1.745 | |
| ln商务配套 | -0.101*** | -4.432 | 0.150 | 1.330 | -0.099*** | -4.281 | -0.126*** | -5.260 | -0.052 | -0.724 | -0.110*** | -4.497 | |
| R2 | 0.544 | 0.496 | 0.531 | 0.513 | 0.508 | 0.489 | |||||||
| Adjusted R2 | 0.539 | 0.455 | 0.525 | 0.506 | 0.470 | 0.484 | |||||||
注:***、**、*分别表示在1%、5%、10%水平上显著。表4同。 |
表4 学区特征对住宅价格的稳健性检验Tab.4 Robust test of school district characteristics on housing prices |
| 变量 | 2008年 | 2017年 | |||||||||||
|---|---|---|---|---|---|---|---|---|---|---|---|---|---|
| 主城整体 | 优质学区 | 普通学区 | 主城整体 | 优质学区 | 普通学区 | ||||||||
| 系数 | 统计量 | 系数 | 统计量 | 系数 | 统计量 | 系数 | 统计量 | 系数 | 统计量 | 系数 | 统计量 | ||
| 学区成绩 | 0.021*** | 8.911 | 0.022*** | 5.771 | 0.018*** | 3.181 | 0.044*** | 12.025 | 0.046*** | 17.974 | 0.026** | 2.608 | |
| 学区机会 | -0.001*** | -2.678 | 0.001 | 0.947 | -0.002*** | -3.567 | -0.003*** | -4.416 | -0.005 | -1.170 | -0.005*** | -4.497 | |
| ln学校距离 | -0.007 | -1.058 | -0.053*** | -2.699 | -0.005 | -0.730 | -0.020*** | -2.840 | -0.061*** | -2.144 | -0.013* | -1.785 | |
表5 学区特征的价格弹性/半弹性系数Tab.5 Elasticity and semi-elasticity coefficient of price from the perspective of school district characteristic |
| 变量 | 2008年 | 2017年 | |||||||||||
|---|---|---|---|---|---|---|---|---|---|---|---|---|---|
| 主城整体 | 优质学区 | 普通学区 | 主城整体 | 优质学区 | 普通学区 | ||||||||
| 弹性系数(%) | 半弹性系数(%) | 弹性系数(%) | 半弹性系数(%) | 弹性系数(%) | 半弹性系数(%) | 弹性系数(%) | 半弹性系数(%) | 弹性系数(%) | 半弹性系数(%) | 弹性系数(%) | 半弹性系数(%) | ||
| 学区成绩 | 2.122 | 2.224 | 1.715 | 3.666 | 4.603 | 2.327 | |||||||
| 学区机会 | -0.100 | 0.100 | -0.200 | -0.399 | -0.598 | -0.399 | |||||||
| ln学校距离 | -0.006 | -0.053 | -0.005 | -0.020 | -0.059 | -0.013 | |||||||
表6 学区特征的影响程度系数Tab.6 The impact coefficient of school district characteristic |
| 变量 | 2008年 | 2017年 | ||||||||||||
|---|---|---|---|---|---|---|---|---|---|---|---|---|---|---|
| 主城整体 | 优质学区 | 普通学区 | 主城整体 | 优质学区 | 普通学区 | |||||||||
| 标准化系数绝对值 | 影响程 度系数 | 标准化系数绝对值 | 影响程 度系数 | 标准化系数绝对值 | 影响程 度系数 | 标准化系数绝对值 | 影响程 度系数 | 标准化系数绝对值 | 影响程 度系数 | 标准化系数绝对值 | 影响程 度系数 | |||
| 学区成绩 | 0.173 | 0.091 | 0.396 | 0.150 | 0.077 | 0.042 | 0.401 | 0.198 | 0.625 | 0.366 | 0.230 | 0.110 | ||
| 学区机会 | 0.060 | 0.031 | 0.125 | 0.047 | 0.088 | 0.048 | 0.094 | 0.046 | 0.081 | 0.047 | 0.103 | 0.049 | ||
| ln学校距离 | 0.019 | 0.010 | 0.197 | 0.075 | 0.016 | 0.009 | 0.054 | 0.027 | 0.130 | 0.076 | 0.040 | 0.019 | ||
表7 学区成绩的边际价格Tab.7 Marginal price of acceptance rate of Nanjing Foreign Language School |
| 2008年 | 2017年 | ||||||
|---|---|---|---|---|---|---|---|
| 主城整体 | 优质学区 | 普通学区 | 主城整体 | 优质学区 | 普通学区 | ||
| 住宅均价(元/m2) | 12 044 | 15 343 | 11 808 | 30 682 | 41 915 | 29 068 | |
| 回归系数 | 0.021 | 0.022 | 0.017 | 0.036 | 0.045 | 0.023 | |
| 半弹性系数(%) | 2.122 | 2.224 | 1.715 | 3.666 | 4.603 | 2.327 | |
| 边际价格(元) | 256 | 341 | 202 | 1125 | 1929 | 676 | |
| [1] |
胡洪彬. 我国教育公平研究的回顾与展望——基于2002—2012年CNKI期刊数据的分析[J]. 教育研究, 2014, 35(1):54-59.
|
| [2] |
吴愈晓, 黄超. 基础教育中的学校阶层分割与学生教育期望[J]. 中国社会科学, 2016(4):111-134.
|
| [3] |
戴特奇, 廖聪, 胡科, 等. 公平导向的学校分配空间优化——以北京石景山区为例[J]. 地理学报, 2017, 72(8):1 476-1 485.
|
| [4] |
毛丰付, 罗刚飞, 潘加顺. 优质教育资源对杭州学区房价格影响研究[J]. 城市与环境研究, 2014, 1(2):53-64.
|
| [5] |
|
| [6] |
王洋, 方创琳, 盛长元. 扬州市住宅价格的空间分异与模式演变[J]. 地理学报, 2013, 68(8):1 082-1 096.
|
| [7] |
|
| [8] |
宋伟轩, 刘春卉. 长三角一体化区域城市商品住宅价格分异机理研究[J]. 地理研究, 2018, 37(1):92-102.
|
| [9] |
冯长春, 李维瑄, 赵蕃蕃. 轨道交通对其沿线商品住宅价格的影响分析——以北京地铁5号线为例[J]. 地理学报, 2011, 66(8):1 055-1 062.
|
| [10] |
|
| [11] |
彭保发, 石忆邵, 单玥, 等. 上海市三甲医院对周边地区住房价格的空间影响效应分析[J]. 地理科学, 2015, 35(7):860-866.
|
| [12] |
尹海伟, 徐建刚, 孔繁花. 上海城市绿地宜人性对房价的影响[J]. 生态学报, 2009, 29(8):4 492-4 500.
|
| [13] |
|
| [14] |
|
| [15] |
温海珍, 李旭宁, 张凌. 城市景观对住宅价格的影响——以杭州市为例[J]. 地理研究, 2012, 31(10):1 806-1 814.
|
| [16] |
|
| [17] |
石忆邵, 王伊婷. 上海市学区房价格的影响机制[J]. 中国土地科学, 2014, 28(12):47-55.
|
| [18] |
|
| [19] |
胡婉旸, 郑思齐, 王锐. 学区房的溢价究竟有多大:利用“租买不同权”和配对回归的实证研究[J]. 经济学(季刊), 2014, 13(3):1 195-1 214.
|
| [20] |
刘润秋, 孙潇雅. 教育质量“资本化”对住宅价格的影响——基于成都市武侯区小学学区房的实证分析[J]. 财经科学, 2015(8):91-99.
|
| [21] |
|
| [22] |
洪世键, 周玉. 基于特征价格法的学区房价格外溢效应探讨——以厦门岛为例[J]. 建筑经济, 2016, 37(2):65-69.
|
| [23] |
|
| [24] |
王少剑, 王洋, 蔺雪芹, 等. 中国县域住宅价格的空间差异特征与影响机制[J]. 地理学报, 2016, 71(8):1 329-1 342.
|
| [25] |
刘蓓佳, 刘勇. 基于Hedonic模型的城市轨道沿线房价特征分析[J]. 西南大学学报:自然科学版, 2016, 38(8):83-89.
|
| [26] |
|
| [27] |
汤庆园, 徐伟, 艾福利. 基于地理加权回归的上海市房价空间分异及其影响因子研究[J]. 经济地理, 2012, 32(2):52-58.
|
| [28] |
张静, 张丽芳, 濮励杰, 等. 基于GWR模型的城市住宅地价的时空演变研究——以江苏省为例[J]. 地理科学, 2012, 32(7):828-834.
|
| [29] |
宋伟轩, 毛宁, 陈培阳, 等. 基于住宅价格视角的居住分异耦合机制与时空特征——以南京为例[J]. 地理学报, 2017, 72(4):589-602.
|
| [30] |
尹上岗, 宋伟轩, 马志飞, 等. 南京市住宅价格时空分异格局及其影响因素分析——基于地理加权回归模型的实证研究[J]. 人文地理, 2018, 33(3):68-77.
|
| [31] |
陈友华, 施旖旎, 季春梅. 学区房的形成机制及其社会后果研究[J]. 学海, 2017(4):122-127.
|
| [32] |
|
| [33] |
吴启焰, 吴小慧,
|
| [34] |
陈培阳. 中国城市学区绅士化及其社会空间效应[J]. 城市发展研究, 2015, 22(8):55-60.
|
| [35] |
|
| [36] |
辛涛, 黄宁. 教育公平的终极目标:教育结果公平——对教育结果公平的重新定义[J]. 教育研究, 2009, 30(8):24-27.
|
/
| 〈 |
|
〉 |